Marrow Disorders
Thomas H. Berquist
Protocols
Key Facts
Routine radiographs
Anteroposterior (AP) and lateral views of involved structures
Radionuclide scans
Technetium-99m whole-body images
Magnetic resonance imaging (MRI)
Field of view: smallest practical for area of interest
Coil: phased array
Matrix: 256 × 256 or 192 × 256
Acquisitions: 1 to 2
Sequences:
T1-weighted spin-echo 500/10
Fast spin-echo T2-weighted with fat suppression (2800/105, ETL 17)
Short T1 inversion recovery (STIR) 5600/109/165
Suggested Reading
Mirowitz SA, Apicella P, Reinus WR, et al. MR imaging of bone marrow lesions: Relative conspicuousness on T1-weighted, fat suppressed T2-weighted, and STIR images. AJR Am J Roentgenol 1994;162:215–221.
Schellinger D, Lin CS, Fertikh D, et al. Normal lumbar vertebrae: Anatomic, age, sex variance in subjects at proton MR spectroscopy-initial experience. Radiology 2000;215:910–916.
Normal Marrow: Basic Concepts
Key Facts
Bone marrow consists of trabeculae (15%) and cellular constituents (85%) (erythrocytic, leukocytic, fat cells, and reticulum cells).
Hemopoietic cells (blood cells) comprise red marrow. The remainder, or inactive marrow, is yellow marrow.
Red marrow is 40% water, 40% fat, and 20% protein. Yellow marrow is 80% fat, 15% water, and 5% protein.
At birth, nearly the entire skeleton is composed of red marrow. Red marrow converts to yellow marrow in a predictable pattern from peripheral to central. The adult marrow pattern is usually attained by 25 years of age.
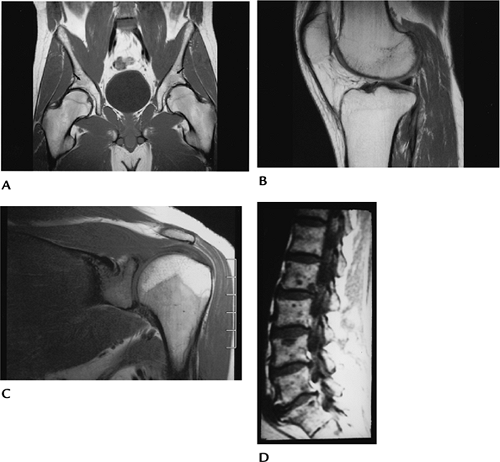
Adult marrow pattern is primarily red in the axial skeleton (skull, spine, pelvis, ribs, and sternum) and proximal humeri and femora.
MRI features of normal marrow are predictable on T1- and T2-weighted sequences. Yellow marrow has signal intensity similar to subcutaneous fat on T1-weighted sequences and low signal intensity on T2-weighted sequences. Red marrow has lower intensity than fat on T1-weighted and signal intensity near that of fat (high) on T2-weighted sequences. STIR sequences show red marrow as even higher intensity compared with T2-weighted sequences.
Suggested Reading
Vogler JB, Murphy WA. Bone marrow imaging. Radiology 1988;168:679–693.
Marrow Reconversion
Key Facts
Hematopoietic demand may result in conversion of yellow to red marrow.
The sequence of red marrow conversion occurs in reverse of the red to yellow marrow conversion, occurring as one develops adult marrow pattern.
Reconversion begins in the axial skeleton and moves peripherally.
Reconversion is symmetric, but not necessarily uniform.
Patients without bone marrow disorders may develop expanded red marrow termed “hyperplasia.”
Marrow reconversion, or hyperplasia, may be the result of multiple conditions:
Chronic anemia
Chronic infection
Marrow replacement diseases
Cyanotic heart disease
Marathon running
Smoking
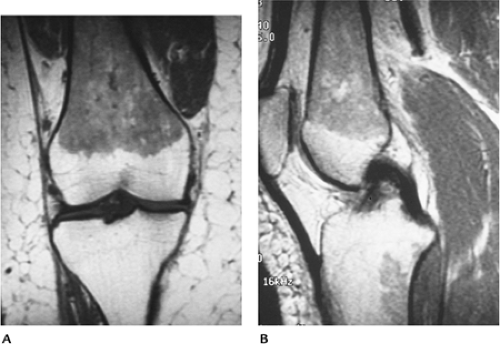
Imaging of red marrow reconversion is best accomplished with MRI. Signal intensity changes may be difficult to differentiate from infiltrative diseases. T1-weighted images show areas of decreased signal intensity. T2-weighted and STIR sequences show signal intensity higher than fat.
Suggested Reading
Shellock FG, Morris E, Deutsch AL, et al. Hemopoietic marrow hyperplasia: High prevalence on MR images of the knee in asymptomatic marathon runners. AJR Am J Roentgenol 1992;158:335–338.
Vande Berg BC, Levouvet FE, Moyson P, et al. MR assessment of red marrow distribution and composition in the proximal femur: Correlation with clinical and laboratory parameters. Skel Radiol 1997;26:589–596.
Myeloid Depletion
Key Facts
In patients with myeloid depletion, the hemopoietic (red) marrow is replaced by fatty (yellow) marrow.
Fat replacement may be diffuse or focal, depending on the extent and duration of the process.
Conditions leading to myeloid depletion include
Aplastic anemia
Chemotherapy
Radiation
Marrow toxins
Viral infections
Radiation changes are focal, so fat replacement occurs in the treated region. Changes occur as early as 3 to 7 weeks. With low doses, recovery may occur. Patients receiving more than 50 Gy usually are irreversible.
Fatty marrow has fat signal intensity on T1- and T2-weighted sequences.
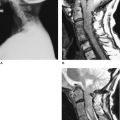
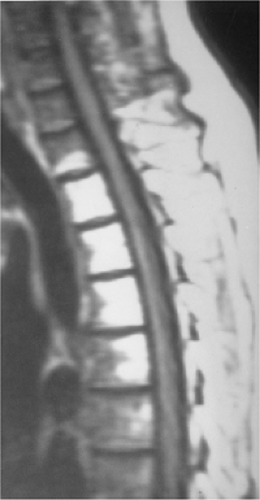 FIGURE 12-4 Radiation changes with fatty marrow in the upper thoracic spine seen on T1-weighted magnetic resonance (MR) image. |
Suggested Reading
Cavenagh EC, Weinberger E, Shal DW, et al. Hemopoietic marrow reconversion in pediatric patients undergoing spinal irradiation. MR depiction. AJNR Am J Neuroradiol 1995;16:461–467.
Marrow Ischemia
Key Facts

