(1)
Australian Centre for Microscopy & Microanalysis, University of Sydney, Sydney, NSW, Australia
Abstract
All measurements require that the microscope must be aligned as accurately as possible, and the gain (or PMT voltage) and black level must be set to avoid any overflow or underflow. Measuring surface profiles and relative depths is straightforward and can be carried out to a higher accuracy than the depth resolution of the microscopes, even though the actual images may look poor. Measuring the thickness of objects which are labeled throughout is less accurate. Length and 2D area measurements are common image analysis problems and easily carried out with image analysis software. Volume measurements are conceptually equally simple but require manual techniques or 3D analysis software. 3D surface area measurements require specialist software, or can be carried out with stereological techniques. Fluorescence intensity measurements require careful calibration. For ratiometric measurements filters and/or laser lines should be chosen to optimize the response and calibration should be done in conditions as close as possible to the experimental ones. FLIM allows exploration of the chemical environment, and multiple labelling even where spectra overlap. When the hardware is available it is also usually the method of choice for measuring FRET, which can measure molecular interactions in the nanometer range. Without FLIM hardware, either intensity measurements with correction for bleed-through and cross talk or acceptor bleaching are the most popular methods of measuring FRET.
Key words
AlignmentContrastDepth measurementThickness measurementLength measurementArea measurementVolume measurementFluorescence measurementStereologyRatiometryFLIMFRET1 Prerequisites
1.1 Alignment
Accurate alignment of the microscope is vital for most measurements. Many of the more complex modern microscopes do not provide any alignments accessible to the user but even so regular checks to be sure that the system is functioning properly are essential. Many of the alignments described below are not user adjustable on the current generation of high-end systems but that does not make it any the less essential to check them. Experience shows that the service engineer may not always know best.
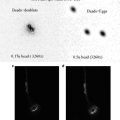
If the focussed spot is not aligned precisely on the pinhole the image will not be at its brightest when it is in true focus. This is guaranteed to destroy the accuracy of any measurement, particularly measurements of depth and intensity. A mirror coverslip (see Note 1) is a very useful test specimen for this. To check the pinhole alignment with a mirror coverslip take a vertical (X–Z) section of the coverslip with the pinhole fully closed—misalignment will show as a double image of the reflective surface (Fig. 1). The actual alignment is best carried out with a brightly fluorescent sample, adjusting the pinhole for maximum signal, but the mirror slide is the most sensitive test. Carry out the alignment with the pinhole fully closed (or the smallest pinhole selected) for greatest accuracy. Then select the best size—between 0.7 and 1 times the airy disk diameter—for the objective being used.

Fig. 1
Confocal reflection images of a mirrored coverslip. (a) XZ image with the pinhole misaligned. Note how the reflective surface appears artifactually as a double line. (b) With the pinhole aligned correctly the surface appears as a single line
The axis of the scan must pivot around the back focal plane of the objective lens. If this is not so vignetting will occur—the edges of the image will be dimmer than the center. This will affect some measurements more than others, but it will have most importance where structures are being segmented out by grey values. Some manufacturers provide a tool to check this in the form of a prism (upright microscopes) or a diffuser (inverted microscopes) which fits in the objective position. If not, just remove an objective and place a piece of paper or card on the stage. Do not use any reflective object such as a mirror or even a glass slide.
The circular patch of laser light should appear stationary. If it is not, the appropriate adjustment must be made. On older or simpler microscopes this may be accessible to the user—on the now-discontinued Biorad systems, for example, the height of the transfer lens between microscope and confocal head is adjusted by a screw collar. On more modern or sophisticated systems a service call will be required. After this adjustment the confocal and conventional optical systems may need readjustment to make them parfocal so that both the confocal image and that seen through the eyepiece are in focus. (This is worth doing purely as a matter of convenience, but it could also affect the magnification if it was severely out.) Again taking the Biorad as an example, the confocal head is moved towards or away from the microscope port to make both sets of optics parfocal—and once again more complex systems will need a visit from the technician.
The field of view of the confocal optics should be centered on the optical view. It is inconvenient if it is not, and although measurements will not be affected, resolution might be as all lenses perform at their best in the center of the field of view. The illumination should be even across the confocal image. A piece of fluorescent plastic is a good test specimen for this—the filter manufacturer Chroma (Brattleboro, Vt, USA) supply uniformly fluorescent plastic microscope slides in several colors, which are ideal for this. Some microscopes are notably uneven at their lowest zoom settings—in this case it is better to use a higher zoom.
1.2 Contrast
The requirements for obtaining accurate measurements in the confocal microscope are not necessarily compatible with the best image quality as judged by eye. First, it is essential, when making any measurements of intensity or resolution, that the mean background intensity nowhere goes to zero. While this is not so essential for measurements of position or depth, it is still advisable since otherwise the resolution, and hence the possible error, cannot be estimated (Fig. 2). In most cases the background level needs to be the dark current from the photomultiplier, since background fluorescence in the tissue may vary from sample to sample. Therefore the first step should be to remove the sample from the microscope and adjust the black level until a (just) nonzero value is present across the entire field of view. The resulting background will probably be higher than would be chosen for visual impact, but it is easy to rescale the image for publication and impossible to recover information that has been lost. Never use automatic gain or black level control when making measurements.

Fig. 2
Line profile across a 100 nm fluorescent bead, taken using a ×63, NA 1.4 oil immersion lens. The width of the curve, taken half-way between the maximum and minimum values, gives the resolution of the system. To obtain a meaningful value the peak must not reach saturation intensity (256) and the background has to be above 0
It is even more important, for any sort of measurement, that the intensity at any point in the image never exceeds the maximum which the system can record. Most modern confocals will acquire and store 12-bit images (maximum value 4,095 counts) but in many cases they default to 8-bit images, in which case the maximum recordable intensity is 255. This is all too easy to exceed, and it is very important to set the gain of the amplifier or the PMT voltage to a value at which even your brightest sample will not saturate the image. If the intensity values saturate at any point in an object then its true intensity cannot be measured, and neither can its position laterally or in depth. Always select the 12-bit option when possible.
1.3 Summary
Before you start, the microscope must be aligned as accurately as possible, and the gain (or PMT voltage) and black level must be set to avoid any overflow or underflow.
2 Depth and Thickness Measurement
Confocal microscopes are commonly used for making measurements in depth—something which conventional microscopes, whether light or electron, cannot easily do. Their major rivals in this field are scanning probe (atomic force) microscopes and interferometric microscopes, both of which offer superior accuracy to confocal microscopes but can only measure surfaces. In the confocal microscope various types of measurement are possible, with varying degrees of accuracy. The relative heights of various parts of a single surface can be measured with considerable precision, whereas measurements of vertical depths and spacings within a three-dimensional solid or liquid are constrained to some extent by the resolution of the system, which is unlikely to exceed 0.5 μm in the axial direction. Since axial resolution is related to the square of the numerical aperture, it is absolutely essential to use the highest NA objective which is capable of covering the desired area.
Common to all depth measurements is the need to take account of the refractive indexes of the specimen and of the medium in which it is mounted (which should be the same if possible). If specimen, mountant, and the medium between sample and lens are all equivalent in refractive index, the displacement of the slide or the objective will give the actual depth difference and no correction is needed. This applies whatever the actual refractive index is.
Examples are as follows:
1.
Sample mounted in permanent mountant, under a coverslip, viewed with an oil immersion lens (refractive index (n) = ~1.5 throughout).
2.
Surface sample, such as a tooth, bone, or pollen grain viewed in reflection mode, in air (n = 1 throughout).
3.
Living sample, viewed in water, using a water-immersion lens, with or without a coverslip (n = ~1.3).
In each case the lens must be optically corrected for the medium. In (1) it is obvious that an oil-immersion lens is needed, while in (2) the objective must be corrected for use without a coverslip (the prefix epi- is often used). In (3) the lens must not only be designed for water immersion, but it will also specify whether or not a coverslip is required. (The coverslip will only affect the optical correction, not the measurement since it will introduce an equal apparent displacement to all levels of the sample.) A lens which is not matched to the medium will give a very poor image because of spherical aberration (SA), which can only be corrected for a single working distance and optical medium. The effects of SA increase as the cube of the NA, and since we saw above that a high NA lens is required for good depth resolution it follows that a refractive index mismatch can severely reduce resolution both laterally and in depth. In some circumstances it can actually give incorrect depth measurements [1].
Conventional “dry” (non-immersion) objectives for biological use are intended for use with a coverslip, and with the specimen beneath mounted in a medium of refractive index ~1.5. The distance from the top of the coverslip to the sample should be 0.17 mm, and this figure will be marked on the lens. Provided that this distance is, overall, approximately correct, reasonably well-corrected images can be obtained over a distance of several microns, but relative depth measurements must be corrected for the difference between the refractive index of the medium around the lens and the medium containing the sample. Figure 3 shows why this is so. Rays of light from the object are refracted away from the normal as they leave the coverslip, according to Snell’s law of refraction. They therefore appear to emanate from the point indicated by the dotted lines. The correct measurement will be given by multiplying the apparent measurement by the refractive index of the mountant (1.5) over that of air (1)—in other words the correct figure will be 1.5 times the measured value.

Fig. 3
The relationship between real and measured depth when using a dry lens with a permanently mounted sample
Samples mounted in water should not, in theory, be measured with a dry lens but in the real world we may want to do this. The image will be reasonable about 0.2 mm below the upper surface of the coverslip, and the measured depth should be corrected by multiplying by 1.3, the refractive index of water. Nevertheless a water immersion lens is strongly preferable—as well as not needing any correction, the image will be aberration free. Measuring depth or thickness in aqueous media under oil immersion should not be attempted—while a passable image can be obtained immediately below the coverslip the image quality deteriorates so rapidly with depth that measurements could not be trusted [2].
The software built into the microscope should make these apparent depth corrections automatically, so that reconstructions and depth measurements will be correct. But the standard software is often limited in functionality, and when using third-party programs such as Image J or one of the commercial analysis systems it is important to ensure that these corrections are made.
2.1 Measuring Heights on a Surface
Variations of height in a single plane surface can be measured with considerable accuracy in the confocal microscope; this is very commonly done in the engineering sciences but also has applications in biology. A line profile can be taken by making a vertical (X–Z) section of the surface, or an overall view can be had by collecting a series of optical sections. The accuracy to which a surface can be located considerably exceeds the vertical resolution of the microscope (resolution being the vertical distance between two objects which can be distinguished from each other). The spacing between planes (or lines in an X–Z section) should therefore be as fine as is compatible with a reasonable size for the resultant file.
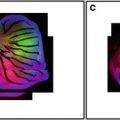
The resulting dataset, viewed as an X–Z section or a side view in a 3D reconstruction, will generally look very disappointing at first glance. The plane surface will be stretched or smeared in depth—possibly to the extent that measurement seems impossible (Fig. 4a) [3]. However a line intensity profile through the surface will show that there is in fact a strong maximum at the actual location of the surface. This can be used directly as the basis for measurement, or various image processing techniques can be used. Thinning or erosion algorithms can produce a single-pixel wide line indicating the profile of the surface to the nearest depth step (Fig. 4b). Some systems include this feature as part of their standard software, but in other cases third-party software will be needed. Free software is available which will not only extract a surface in this way but also carry out hyperbolic interpolation to give sub-pixel accuracy (see Note 2). Another alternative is to create a height-coded image, which is effectively a contour-colored map of the surface, plotting the depth of the brightest pixel as the intensity in the output image.

Fig. 4
X–Z section through a sample consisting of a 3 μm layer of SiO2 on a silicon substrate. Over the oxide is a thin layer of oil (not normally a recommended practice but deliberate in this case!). In the original image (a) although the actual position of the surface of each layer is actually the brightest part this is not apparent to the unaided eye, and accurate measurements of layer thickness would seem impossible. After only five iterations of an erosion (thinning) algorithm, which preserves the peak intensity, the actual position of each surface (to the nearest pixel) is clearly visible
2.2 Thickness Measurements
When measuring the thickness of a cell or a similar structure the simplest approach is again to take an XZ section, or multiple XZ sections. Where the boundary of the object is stained (for example where a cell is bounded by a labeled membrane or wall) the brightest pixel can again be taken as an indicator of the true position of the surface. The depth (with any necessary correction for refractive index) can then be measured from a line profile.
If the object to be measured is stained or labeled throughout its thickness the problem of determining the true edge of the structure is more complex. The best general approximation is to take the halfway point between the background level and the peak intensity. This will be reasonably valid provided that there is no refractive index difference between the object and the surrounding medium.
2.3 Summary
Refractive index effects must always be borne in mind when making this class of measurement. Measuring surface profiles and relative depths is straightforward and can be carried out to a higher accuracy than the depth resolution of the microscopes, even though the actual images may look poor. Measuring the thickness of objects which are labeled throughout is less accurate.
3 Length, Area, and Volume Measurement
Most confocal microscopes have a wide range of image analysis facilities built into their software. However no two offer the same features, and in many cases some features are quite expensive options which therefore may or may not be present on any individual microscope. Therefore some of the measurement protocols outlined in this section will require third-party software and some will not; the aim is to make the methods clear so that the user can select appropriate tools for the task. Almost all can be done in the popular freeware package Image J for which many plug-ins have been supplied by the user community, though commercial packages may be more user friendly.
3.1 Two-Dimensional Measurements
There is little here that is specific to the confocal microscope. Since the image is already in digital form these measurements are simple to do, and most microscopes include software permitting segmentation of single or multiple grayscale ranges for simple area measurement, and line cursors for measurements of straight-line lengths. More sophisticated measurements will require the files to be exported to specialist image analysis software.
3.2 Surface Area and Volume
Volume measurement from a confocal dataset is straightforward, since a count of the voxels in the volume of interest (with appropriate corrections for scaling in the vertical dimension) is all that is required. Sometimes thresholding by intensity is enough to separate out the required object or objects, if the staining is sufficiently specific. In more complex situations “seeding” can be a valuable tool. This involves identifying a voxel within the desired volume and then setting intensity thresholds to segment out the required volume, spreading outward from the seed so that only the specified object is selected. This will give a numerical result very simply so long as intensity does not become significantly attenuated with depth. Some programs provide correction for depth attenuation, and so long as suitable fiduciary markers are present to validate the correction this can be extremely useful. Such markers can be structures for which it is reasonable to assume that staining is depth independent (such as expressible fluorescent protein markers) or fluorescent beads which are introduced into the sample. If these conditions cannot be met it may be preferable to segment out the structure of interest in the individual layers and measure each one. Naturally refractive index considerations for determining the true depth will still apply.
Related posts:
 Confocal Imaging of Butterfly Tissue
 Confocal Imaging of Fluorescently Labeled Proteins in the Drosophila Larval Neuromuscular Junction
 Vital Imaging of Multicellular Spheroids
 Imaging Tools for Analysis of the Ureteric Tree in the Developing Mouse Kidney
 Evaluating Confocal Microscopy System Performance
 Laser Scanning Confocal Microscopy: History, Applications, and Related Optical Sectioning Techniques
Stay updated, free articles. Join our Telegram channel

Full access? Get Clinical Tree


