be a smooth bounded domain in  or 3 and let ν x denote the outward normal to
  at x. Suppose that the conductivity of
  is equal to 1. Let D denote a smooth anomaly inside
  with conductivity 0 < k ≠ 1 < +∞. The voltage potential in the presence of the set D of conductivity anomalies is denoted by u. It is the solution to the conductivity problem

(1)
The background voltage potential U in the absence of any anomaly satisfies


(2)
Let N(x, z) be the Neumann function for  corresponding to a Dirac mass at z. That is, N is the solution to

Note that the Neumann function N(x, z) is defined as a function of  for each fixed
 corresponding to a Dirac mass at z. That is, N is the solution to
(3)
 for each fixed
For B a smooth bounded domain in  a conductivity parameter, let
  be the solution to
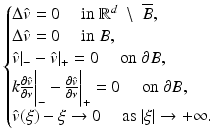
Here, one denotes
 and
and
 if the limits exist, where ν ξ is the outward unit normal to ∂ B at ξ and
  is the scalar product in
  . For ease of notation, the dot will be sometimes used for the scalar product in
  .
.
 a conductivity parameter, let
  be the solution to
(4)


 is the scalar product in
  . For ease of notation, the dot will be sometimes used for the scalar product in
  .
.Recall that  plays the role of the first-order corrector in the theory of homogenization [79].
 plays the role of the first-order corrector in the theory of homogenization [79].
 Asymptotic Analysis of the Voltage Perturbations
In this section, an asymptotic expansion of the voltage potentials in the presence of a diametrically small anomaly with conductivity different from the background conductivity is provided.
The following theorem gives asymptotic formulas for both boundary and internal perturbations of the voltage potential that are due to the presence of a conductivity anomaly.
Theorem 1 (Voltage perturbations).
Suppose that D = δB + z,δ being the characteristic size of D, and let u be the solution of (1), where 0 < k ≠ 1 < +∞. Denote by U the background solution, that is, the solution of (2).
(i)
(ii)
Let w be a smooth harmonic function in  . The weighted boundary measurements I w [U] satisfies
![$$\displaystyle{ I_{w}[U]:=\int _{\partial \Omega }(u - U)(x)\frac{\partial w} {\partial \nu } (x)\,d\sigma (x) \approx -\delta ^{d}\nabla U(z) \cdot M(k,B)\nabla w(z). }$$](/wp-content/uploads/2016/04/A183156_2_En_47_Chapter_Equ7.gif)
 . The weighted boundary measurements I w [U] satisfies
![$$\displaystyle{ I_{w}[U]:=\int _{\partial \Omega }(u - U)(x)\frac{\partial w} {\partial \nu } (x)\,d\sigma (x) \approx -\delta ^{d}\nabla U(z) \cdot M(k,B)\nabla w(z). }$$](/wp-content/uploads/2016/04/A183156_2_En_47_Chapter_Equ7.gif)
(7)
(iii)
The following inner asymptotic formula holds:


(8)
The inner asymptotic expansion (8) uniquely characterizes the shape and the conductivity of the anomaly. In fact, suppose for two Lipschitz domains B and B ′ and two conductivities k and k ′ that  in a domain englobing B and B ′ , then using the jump conditions satisfied by
  and
and  , one can easily prove that B = B ′ and k = k ′ .
 in a domain englobing B and B ′ , then using the jump conditions satisfied by
  and
and  , one can easily prove that B = B ′ and k = k ′ .
The asymptotic expansion (5) expresses the fact that the conductivity anomaly can be modeled by a dipole far away from z. It does not hold uniformly in  . It shows that, from an imaging point of view, the location z and the polarization tensor M of the anomaly are the only quantities that can be determined from boundary measurements of the voltage potential, assuming that the noise level is of order δ d+1. It is then important to precisely characterize the polarization tensor and derive some of its properties, such as symmetry, positivity, and isoperimetric inequalities satisfied by its elements, in order to develop efficient algorithms for reconstructing conductivity anomalies of small volume.
 . It shows that, from an imaging point of view, the location z and the polarization tensor M of the anomaly are the only quantities that can be determined from boundary measurements of the voltage potential, assuming that the noise level is of order δ d+1. It is then important to precisely characterize the polarization tensor and derive some of its properties, such as symmetry, positivity, and isoperimetric inequalities satisfied by its elements, in order to develop efficient algorithms for reconstructing conductivity anomalies of small volume.
Some important properties of the polarization tensor are listed in the next theorem.
Theorem 2 (Properties of the polarization tensor).
For 0 < k ≠ 1 < +∞, let  be the polarization tensor associated with the bounded domain B in
  and the conductivity k. Then
 be the polarization tensor associated with the bounded domain B in
  and the conductivity k. Then
(i)
M is symmetric.
(ii)
If k > 1, then M is positive definite, and it is negative definite if 0 < k < 1.
(iii)
The following isoperimetric inequalities for the polarization tensor

hold, where trace denotes the trace of a matrix and |B| is the volume of B.

(9)
The polarization tensor M can be explicitly computed for disks and ellipses in the plane and balls and ellipsoids in three-dimensional space. See [25, pp. 81–89]. The formula of the polarization tensor for ellipses will be useful here. Let B be an ellipse whose semiaxes are on the x 1– and x 2-axes and of lengths a and b, respectively. Then, M(k, B) takes the form

Formula (5) shows that from boundary measurements, one can always represent and visualize an arbitrary-shaped anomaly by means of an equivalent ellipse of center z with the same polarization tensor. Further, it is impossible to extract the conductivity from the polarization tensor. The information contained in the polarization tensor is a mixture of the conductivity and the volume. A small anomaly with high conductivity and a larger anomaly with lower conductivity can have the same polarization tensor.

(10)
Numerical Methods for Anomaly Detection
In this section, one applies the asymptotic formula (5) for the purpose of identifying the location and certain properties of the shape of the conductivity anomalies. Two simple fundamental algorithms that take advantage of the smallness of the anomalies are singled out: projection-type algorithms and multiple signal classification (MUSIC)-type algorithms. These algorithms are fast, stable, and efficient.
Detection of a Single Anomaly: A Projection-Type Algorithm
One briefly discusses a simple algorithm for detecting a single anomaly. The reader can refer to [31, 73] for further details. The projection-type location search algorithm makes use of constant current sources. One wants to apply a special type of current that makes ∇U constant in D. The injection current  for a fixed unit vector
  yields
  in
in  .
.
 for a fixed unit vector
  yields
  in
in  .
.Assume for the sake of simplicity that d = 2 and D is a disk. Set
 Since w is harmonic in
  , then from (7) to (10), it follows that
![$$\displaystyle{ I_{w}[U] \approx \frac{(k - 1)\vert D\vert } {\uppi (k + 1)} \frac{(x - z) \cdot a} {\vert x - z\vert ^{2}} \;,\quad x \in \mathbb{R}^{2}\setminus \overline{\Omega }\;. }$$](/wp-content/uploads/2016/04/A183156_2_En_47_Chapter_Equ11.gif)

 , then from (7) to (10), it follows that
![$$\displaystyle{ I_{w}[U] \approx \frac{(k - 1)\vert D\vert } {\uppi (k + 1)} \frac{(x - z) \cdot a} {\vert x - z\vert ^{2}} \;,\quad x \in \mathbb{R}^{2}\setminus \overline{\Omega }\;. }$$](/wp-content/uploads/2016/04/A183156_2_En_47_Chapter_Equ11.gif)
(11)
The first step for the reconstruction procedure is to locate the anomaly. The location search algorithm is as follows. Take two observation lines  and
and  contained in
  given by
 Find two points
  so that
 = 0,\quad I_{w}[U](P_{2}) =\max _{x\in \Sigma _{2}}\vert I_{w}[U](x)\vert \;.& & {}\\ \end{array}$$](/wp-content/uploads/2016/04/A183156_2_En_47_Chapter_Equ13.gif) From (11), one can see that the intersecting point P of the two lines
From (11), one can see that the intersecting point P of the two lines


is close to the center z of the anomaly D: | P − z | = O(δ 2).
 and
and  contained in
  given by
 so that
 = 0,\quad I_{w}[U](P_{2}) =\max _{x\in \Sigma _{2}}\vert I_{w}[U](x)\vert \;.& & {}\\ \end{array}$$](/wp-content/uploads/2016/04/A183156_2_En_47_Chapter_Equ13.gif)

(12)

(13)
Once one locates the anomaly, the factor | D | (k − 1)∕(k + 1) can be estimated. As it has been said before, this information is a mixture of the conductivity and the volume. A small anomaly with high conductivity and larger anomaly with lower conductivity can have the same polarization tensor.
An arbitrary-shaped anomaly can be represented and visualized by means of an ellipse or an ellipsoid with the same polarization tensor. See Fig. 1.
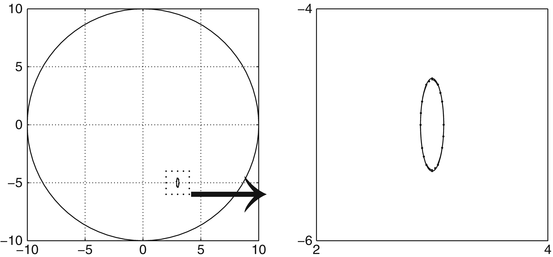

Fig. 1
Detection of the location and the polarization tensor of a small arbitrary-shaped anomaly by a projection-type algorithm. The shape of the anomaly is approximated by an ellipse with the same polarization tensor
We refer the reader to [57] for a discussion on the limits of the applicability of the projection-type location search algorithm and the derivation of a second efficient method, called the effective dipole method.
Detection of Multiple Anomalies: A MUSIC-Type Algorithm
Consider m well-separated anomalies  (these are a fixed distance apart), with conductivities k s ,
  . Suppose for the sake of simplicity that all the domains B s are disks. Let
  for l = 1, …, n denote the source points. Set
 The MUSIC-type location search algorithm for detecting multiple anomalies is as follows. For
  sufficiently large, define the response matrix
  by
by
![$$\displaystyle{A_{ll^{{\prime}}} = I_{w_{y_{ l}}}[U_{y_{l^{{\prime}}}}]:=\int _{\partial \Omega }(u - U_{y_{l^{{\prime}}}})(x)\frac{\partial w_{y_{l}}} {\partial \nu } (x)\,d\sigma (x)\;.}$$](/wp-content/uploads/2016/04/A183156_2_En_47_Chapter_Eque.gif) Expansion (7) yields
Expansion (7) yields

 (these are a fixed distance apart), with conductivities k s ,
  . Suppose for the sake of simplicity that all the domains B s are disks. Let
  for l = 1, …, n denote the source points. Set
 sufficiently large, define the response matrix
  by
by![$$\displaystyle{A_{ll^{{\prime}}} = I_{w_{y_{ l}}}[U_{y_{l^{{\prime}}}}]:=\int _{\partial \Omega }(u - U_{y_{l^{{\prime}}}})(x)\frac{\partial w_{y_{l}}} {\partial \nu } (x)\,d\sigma (x)\;.}$$](/wp-content/uploads/2016/04/A183156_2_En_47_Chapter_Eque.gif)

Introduce
 where v ∗ denotes the transpose of the vector v.

Lemma 1 (MUSIC characterization of the range of the response matrix).
There exists n 0 > dm such that for any n > n 0, the following characterization of the location of the anomalies in terms of the range of the matrix A holds:


(14)
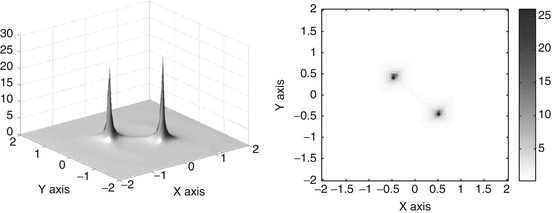
The MUSIC-type algorithm to determine the location of the anomalies is as follows. Let P noise = I − P, where P is the orthogonal projection onto the range of A. Given any point  , form the vector g(x). The point x coincides with the location of an anomaly if and only if P noise g(x) = 0. Thus, one can form an image of the anomalies by plotting, at each point x, the cost function
 The resulting plot will have large peaks at the locations of the anomalies.
 , form the vector g(x). The point x coincides with the location of an anomaly if and only if P noise g(x) = 0. Thus, one can form an image of the anomalies by plotting, at each point x, the cost function
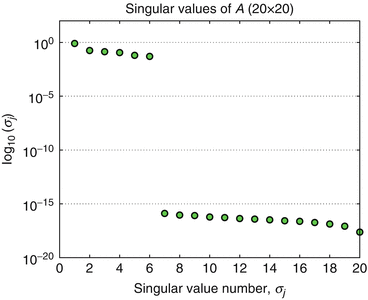
Once one locates the anomalies, the factors  can be estimated from the significant singular values of A.
 can be estimated from the significant singular values of A.
 Bibliography and Open Questions
Part (i) in Theorem 1 was proven in [21, 44, 51]. The proof in [21] is based on a decomposition formula of the solution into a harmonic part and a refraction part first derived in [61]. Part (iii) is from [28]. The Hashin–Shtrikman bounds for the polarization tensor were proved in [43, 77]. The projection algorithm was introduced in [31, 73]. The MUSIC algorithm was originally developed for source separation in signal theory [94]. The MUSIC-type algorithm for locating small conductivity anomalies from the response matrix was first developed in [38]. The strong relation between MUSIC and linear sampling methods was clarified in [16]. The results of this section can be generalized to the detection of anisotropic anomalies [60].
As it has been said before, it is impossible to extract separately from the detected polarization tensor information about the material property and the size of the anomaly. However, if the measurement system is very sensitive, then making use of higher-order polarization tensors yields such information. See [25] for the notion of the higher-order polarization tensors.
One of the most challenging problems in anomaly detection using electrical impedance tomography is that in practical measurements, one usually lacks exact knowledge of the boundary of the background domain. Because of this, the numerical reconstruction from the measured data is done using a model domain that represents the best guess for the true domain. However, it has been noticed that an inaccurate model of the boundary causes severe errors for the reconstructions. An elegant and original solution toward eliminating the error caused by an incorrectly modeled boundary has been proposed and implemented numerically in [69]. As nicely shown in [67], another promising approach is to use multifrequency data. The anomaly can be detected from a weighted frequency difference of the measured boundary voltage perturbations. Moreover, this method eliminates the need for numerically simulated background measurements at the absence of the conductivity anomaly. See [58, 67].
3 Ultrasound Imaging for Anomaly Detection
Physical Principles
Ultrasound imaging is a noninvasive, easily portable, and relatively inexpensive diagnostic modality which finds extensive clinical use. The major applications of ultrasound include many aspects of obstetrics and gynecology involving the assessment of fetal health, intra-abdominal imaging of the liver and kidney, and the detection of compromised blood flow in veins and arteries.
Operating typically at frequencies between 1 and 10 MHz, ultrasound imaging produces images via the backscattering of mechanical energy from interfaces between tissues and small structures within tissue. It has high spatial resolution, particularly at high frequencies, and involves no ionizing radiation. The weaknesses of the technique include the relatively poor soft tissue contrast and the fact that gas and bone impede the passage of ultrasound waves, meaning that certain organs cannot easily be imaged. However, ultrasound imaging is a valuable technique for anomaly detection. It can be done in the time domain and the frequency domain.
Mathematical models for acoustical soundings of biological media involve the Helmholtz equation in the frequency domain and the scalar wave equation in the time domain.
Asymptotic Formulas in the Frequency Domain
Let k and ρ be positive constants. With the notation of section “Asymptotic Analysis of the Voltage Perturbations,” ρ is the compressibility of the anomaly D and k is its volumetric mass density. The scalar acoustic pressure u generated by the Neumann data g in the presence of the anomaly D is the solution to the Helmholtz equation:

while the background solution U satisfies


(15)

(16)
Here, ω is the operating frequency. A relevant boundary data g is the normal derivative of a plane wave  , with the wavelength λ: = 2π∕ω, traveling in the direction of the unit vector θ.
 , with the wavelength λ: = 2π∕ω, traveling in the direction of the unit vector θ.
Introduce the Neumann function for  in
in  corresponding to a Dirac mass at z. That is, N ω is the solution to

 in
in  corresponding to a Dirac mass at z. That is, N ω is the solution to
(17)
Assuming that ω 2 is not an eigenvalue for the operator  with homogeneous Neumann boundary conditions, one can prove, using the theory of relatively compact operators, existence and uniqueness of a solution to (15) at least for δ small enough [95]. Moreover, the following asymptotic formula holds.
 with homogeneous Neumann boundary conditions, one can prove, using the theory of relatively compact operators, existence and uniqueness of a solution to (15) at least for δ small enough [95]. Moreover, the following asymptotic formula holds.
Theorem 3 (Pressure perturbations).
Let u be the solution of (15) and let U be the background solution. Suppose that  . Suppose that ωδ ≪ 1.
 . Suppose that ωδ ≪ 1.
(i)
For any  ,
,

where M(k,B) is the polarization tensor associated with B and k.
 ,
,
(18)
(ii)
Let w be a smooth function such that  in
in  . The weighted boundary measurements I w [U,ω] satisfy
![$$\displaystyle\begin{array}{rcl} I_{w}[U,\omega ]&:=& \int _{\partial \Omega }(u - U)(x)\frac{\partial w} {\partial \nu } (x)\,d\sigma (x) \\ & \approx &-\delta ^{d}\left (\nabla U(z) \cdot M(k,B)\nabla w(z) +\omega ^{2}(\rho -1)\vert B\vert U(z)w(z)\right ). {}\end{array}$$](/wp-content/uploads/2016/04/A183156_2_En_47_Chapter_Equ21.gif)
 in
in  . The weighted boundary measurements I w [U,ω] satisfy
![$$\displaystyle\begin{array}{rcl} I_{w}[U,\omega ]&:=& \int _{\partial \Omega }(u - U)(x)\frac{\partial w} {\partial \nu } (x)\,d\sigma (x) \\ & \approx &-\delta ^{d}\left (\nabla U(z) \cdot M(k,B)\nabla w(z) +\omega ^{2}(\rho -1)\vert B\vert U(z)w(z)\right ). {}\end{array}$$](/wp-content/uploads/2016/04/A183156_2_En_47_Chapter_Equ21.gif)
(19)
Compared to the conductivity equation, the only extra difficulty in establishing asymptotic formulas for the Helmholtz equation (15) as the size of the acoustic anomaly goes to zero is that the equations inside and outside the anomaly are not the same.
Asymptotic Formulas in the Time Domain
Suppose that ρ = 1. Consider the initial boundary value problem for the (scalar) wave equation

where T < +∞ is a final observation time, ![$$\Omega _{T} = \Omega \times ]0,T[,\mbox{ and}\ \partial \Omega _{T} = \partial \Omega \times ]0,T[$$](/wp-content/uploads/2016/04/A183156_2_En_47_Chapter_IEq50.gif) . The initial data
. The initial data  and the Neumann boundary data
  are subject to compatibility conditions.

(21)
![$$\Omega _{T} = \Omega \times ]0,T[,\mbox{ and}\ \partial \Omega _{T} = \partial \Omega \times ]0,T[$$](/wp-content/uploads/2016/04/A183156_2_En_47_Chapter_IEq50.gif) . The initial data
. The initial data  and the Neumann boundary data
  are subject to compatibility conditions.
Define the background solution U to be the solution of the wave equation in the absence of any anomalies. Thus, U satisfies


For ρ > 0, define the operator P ρ on tempered distributions by
 =\int _{\vert \omega \vert \leq \rho }e^{-\sqrt{-1}\omega t}\hat{\psi }(x,\omega )\;d\omega, }$$](/wp-content/uploads/2016/04/A183156_2_En_47_Chapter_Equ24.gif)
where  denotes the Fourier transform of ψ(x, t) in the t-variable. Clearly, the operator P ρ truncates the high-frequency component of ψ.
 =\int _{\vert \omega \vert \leq \rho }e^{-\sqrt{-1}\omega t}\hat{\psi }(x,\omega )\;d\omega, }$$](/wp-content/uploads/2016/04/A183156_2_En_47_Chapter_Equ24.gif)
(22)
 denotes the Fourier transform of ψ(x, t) in the t-variable. Clearly, the operator P ρ truncates the high-frequency component of ψ.
The following asymptotic expansion holds as  .
.
 .
.Theorem 4 (Perturbations of weighted boundary measurements).
Let  satisfy
  in
in  with ∂ t w(x,T) = w(x,T) = 0 for
  . Suppose that ρ ≪ 1∕δ. Define the weighted boundary measurements
![$$\displaystyle{I_{w}[U,T]:=\int _{\partial \Omega _{T}}P_{\rho }[u - U](x,t)\frac{\partial w} {\partial \nu } (x,t)\,d\sigma (x)\,dt.}$$](/wp-content/uploads/2016/04/A183156_2_En_47_Chapter_Equj.gif) Then, for any fixed
Then, for any fixed ![$$T> \mbox{ diam}(\Omega )$$” src=”/wp-content/uploads/2016/04/A183156_2_En_47_Chapter_IEq59.gif”></SPAN>, <SPAN class=EmphasisTypeItalic>the following asymptotic expansion for I</SPAN> <SUB>w</SUB> <SPAN class=EmphasisTypeItalic>[U,T] holds as δ → 0:</SPAN><br />
<DIV id=Equ25 class=Equation><br />
<DIV class=EquationContent><br />
<DIV class=MediaObject><IMG alt=](/wp-content/uploads/2016/04/A183156_2_En_47_Chapter_Equ25.gif)
 satisfy
  in
in  with ∂ t w(x,T) = w(x,T) = 0 for
  . Suppose that ρ ≪ 1∕δ. Define the weighted boundary measurements
![$$\displaystyle{I_{w}[U,T]:=\int _{\partial \Omega _{T}}P_{\rho }[u - U](x,t)\frac{\partial w} {\partial \nu } (x,t)\,d\sigma (x)\,dt.}$$](/wp-content/uploads/2016/04/A183156_2_En_47_Chapter_Equj.gif)
![$$T> \mbox{ diam}(\Omega )$$” src=”/wp-content/uploads/2016/04/A183156_2_En_47_Chapter_IEq59.gif”></SPAN>, <SPAN class=EmphasisTypeItalic>the following asymptotic expansion for I</SPAN> <SUB>w</SUB> <SPAN class=EmphasisTypeItalic>[U,T] holds as δ → 0:</SPAN><br />
<DIV id=Equ25 class=Equation><br />
<DIV class=EquationContent><br />
<DIV class=MediaObject><IMG alt=](/wp-content/uploads/2016/04/A183156_2_En_47_Chapter_Equ25.gif)
(23)
Expansion (23) is a weighted expansion. Pointwise expansions similar to those in Theorem 1 which is for the steady-state model can also be obtained.
Let  be such that | y − z | ≫ δ. Choose

It is easy to check that U y is the outgoing Green function to the wave equation:
![$$\displaystyle{\left (\partial _{t}^{2} - \Delta \right )U_{ y}(x,t) =\delta _{x=y}\delta _{t=0}\quad \mbox{ in }\mathbb{R}^{3}\times ]0,+\infty [\;.}$$](/wp-content/uploads/2016/04/A183156_2_En_47_Chapter_Equk.gif) Moreover, U y satisfies the initial conditions:
Moreover, U y satisfies the initial conditions:  for
for  . Consider now for the sake of simplicity the wave equation in the whole three-dimensional space with appropriate initial conditions:
![$$\displaystyle{ \left \{\begin{array}{ll} &\partial _{t}^{2}u -\nabla \cdot \left (\chi \left (\mathbb{R}^{3}\setminus \overline{D}\right ) + k\chi (D)\right )\nabla u =\delta _{ x=y}\delta _{t=0}\quad \text{in}\ \mathbb{R}^{3}\times ]0,+\infty [\;, \\ &u(x,0) = 0,\quad \partial _{t}u(x,0) = 0\quad \text{for}\ x \in \mathbb{R}^{3},x\neq y.\end{array} \right. }$$](/wp-content/uploads/2016/04/A183156_2_En_47_Chapter_Equ27.gif)
 be such that | y − z | ≫ δ. Choose
(24)
![$$\displaystyle{\left (\partial _{t}^{2} - \Delta \right )U_{ y}(x,t) =\delta _{x=y}\delta _{t=0}\quad \mbox{ in }\mathbb{R}^{3}\times ]0,+\infty [\;.}$$](/wp-content/uploads/2016/04/A183156_2_En_47_Chapter_Equk.gif)
 for
for  . Consider now for the sake of simplicity the wave equation in the whole three-dimensional space with appropriate initial conditions:
![$$\displaystyle{ \left \{\begin{array}{ll} &\partial _{t}^{2}u -\nabla \cdot \left (\chi \left (\mathbb{R}^{3}\setminus \overline{D}\right ) + k\chi (D)\right )\nabla u =\delta _{ x=y}\delta _{t=0}\quad \text{in}\ \mathbb{R}^{3}\times ]0,+\infty [\;, \\ &u(x,0) = 0,\quad \partial _{t}u(x,0) = 0\quad \text{for}\ x \in \mathbb{R}^{3},x\neq y.\end{array} \right. }$$](/wp-content/uploads/2016/04/A183156_2_En_47_Chapter_Equ27.gif)
(25)
The following theorem holds.
Theorem 5 (Pointwise perturbations).
Formula (26) shows that the perturbation due to the anomaly is in the time domain a wave front emitted by a dipolar source located at point z.
Taking the Fourier transform of (26) in the time variable yields the expansions given in Theorem 3 for the perturbations resulting from the presence of a small anomaly for solutions to the Helmholtz equation at low frequencies (at large wavelengths compared to the size of the anomaly).


 \approx -\delta ^{3}\int _{ \mathbb{R}}\nabla P_{\rho }[U_{z}](x,t-\tau ) \cdot M(k,B)\nabla P_{\rho }[U_{y}](z,\tau )\;d\tau \;, }$$](/wp-content/uploads/2016/04/A183156_2_En_47_Chapter_Equ28.gif)
 \approx \delta \hat{ v}\left (\frac{x - z} {\delta } \right ) \cdot \nabla P_{\rho }[U_{y}](x,t)\quad \mbox{ for }x\mbox{ near }z, }$$](/wp-content/uploads/2016/04/A183156_2_En_47_Chapter_Equ29.gif)



![$$\displaystyle{W_{{\mathrm{BP}}}(x):= \frac{1} {n}\sum _{l=1}^{n}e^{-2i\omega \theta _{l}\cdot x}I_{ w_{l}}[U_{l}],}$$](/wp-content/uploads/2016/04/A183156_2_En_47_Chapter_Equq.gif)


![$$\displaystyle\begin{array}{rcl} & & I_{w_{l}}[U_{l^{{\prime}}},\omega ] \propto {}\\ & &\quad \sum _{s=1}^{m}\vert D_{ s}\vert \left (-2\frac{k_{s} - 1} {k_{s} + 1} \frac{(z_{s} - y_{l}) \cdot (z_{s} - y_{l^{{\prime}}})} {\vert z_{s} - y_{l}\vert \vert z_{s} - y_{l^{{\prime}}}\vert } + (\rho _{s} - 1)\right )e^{i\omega (\vert z_{s}-y_{l}\vert +\vert z_{s}-y_{l^{{\prime}}}\vert )}. {}\\ \end{array}$$](/wp-content/uploads/2016/04/A183156_2_En_47_Chapter_Equ30.gif)

![$$\displaystyle{A_{ll^{{\prime}}}(\omega ):= I_{w_{l}}[U_{l^{{\prime}}},\omega ]}$$](/wp-content/uploads/2016/04/A183156_2_En_47_Chapter_Equx.gif)


![$$\displaystyle\begin{array}{rcl} W_{{\mathrm{TR}}}(x,t)& =& \int _{\mathbb{R}}\int _{S}\left [U_{x}\left (x^{{\prime}},t - s\right )\frac{\partial P_{\rho }\left [u - U_{y}\right ]} {\partial \nu } \left (x^{{\prime}},t_{ 0} - s\right )\right. \\ & & \left.-\frac{\partial U_{x}} {\partial \nu } \left (x^{{\prime}},t - s\right )P_{\rho }\left [u - U_{ y}\right ]\left (x^{{\prime}},t_{ 0} - s\right )\right ]\,d\sigma \left (x^{{\prime}}\right )\,ds,{}\end{array}$$](/wp-content/uploads/2016/04/A183156_2_En_47_Chapter_Equ31.gif)

 \approx -\delta ^{3}\int _{ \mathbb{R}}\nabla P_{\rho }[U_{z}](x,t-\tau ) \cdot m(z,\tau )\;d\tau,}$$](/wp-content/uploads/2016/04/A183156_2_En_47_Chapter_Equab.gif)
\;. }$$](/wp-content/uploads/2016/04/A183156_2_En_47_Chapter_Equ32.gif)
![$$\displaystyle{ \begin{array}{l} \int _{\mathbb{R}}\int _{S}\left [U_{x}(x^{{\prime}},t - s)\frac{\partial P_{\rho }[U_{z}]} {\partial \nu } (x^{{\prime}},t_{ 0} - s-\tau )\right. \\ \left.\qquad \quad -\frac{\partial U_{x}} {\partial \nu } (x^{{\prime}},t - s)P_{\rho }[U_{ z}](x^{{\prime}},t_{ 0} - s-\tau )\right ]\,d\sigma (x^{{\prime}})\,ds \\ = P_{\rho }[U_{z}](x,t_{0} -\tau -t) - P_{\rho }[U_{z}](x,t - t_{0}+\tau ), \end{array} }$$](/wp-content/uploads/2016/04/A183156_2_En_47_Chapter_Equ33.gif)
 - P_{\rho }[U_{z}](x,t - t_{0}+\tau )\right ]d\tau,& & {}\\ \end{array}$$](/wp-content/uploads/2016/04/A183156_2_En_47_Chapter_Equ34.gif)
 = \frac{\sin \rho (\tau -\vert x - y\vert )} {2\pi (\tau -\vert x - y\vert )\vert x - y\vert },}$$](/wp-content/uploads/2016/04/A183156_2_En_47_Chapter_Equac.gif)
 - P_{\rho }[U_{z}](x,t - t_{0} + T)\right ]. }$$](/wp-content/uploads/2016/04/A183156_2_En_47_Chapter_Equ35.gif)

![$$\displaystyle{ \begin{array}{ll} \int _{S}\left [\hat{U}_{x}\left (x^{{\prime}}\right )\frac{\partial \overline{\widehat{U_{z}}}} {\partial \nu } \left (x^{{\prime}}\right ) -\frac{\partial \hat{U}_{x}} {\partial \nu } \left (x^{{\prime}}\right )\overline{\widehat{U_{ z}}}\left (x^{{\prime}}\right )\right ]\,d\sigma \left (x^{{\prime}}\right )& = 2i\mathfrak{I}m\,\widehat{U_{ z}}(x) \\ & \propto j_{0}(\omega \vert x - z\vert ), \end{array} }$$](/wp-content/uploads/2016/04/A183156_2_En_47_Chapter_Equ36.gif)


![$$\displaystyle{I_{w}[U,T]:=\int _{\partial \Omega _{T}}(u - U)(x,t)\frac{\partial w} {\partial \nu } (x,t)\,d\sigma (x)\,dt.}$$](/wp-content/uploads/2016/04/A183156_2_En_47_Chapter_Equaf.gif)
![$$\displaystyle{ I_{w}[U,T] \approx -\delta ^{d}\int _{ 0}^{T}\nabla U(z,t) \cdot M(k,B)\nabla w(z,t)\,dt, }$$](/wp-content/uploads/2016/04/A183156_2_En_47_Chapter_Equ38.gif)
![$$\displaystyle{ \left \{\begin{array}{ll} &\partial _{t}u -\nabla \cdot \left (\chi \left (\mathbb{R}^{d}\setminus \overline{D}\right ) + k\chi (D)\right )\nabla u = 0\quad \text{in}\ \mathbb{R}^{d}\times ]0,+\infty [\;, \\ &u(x,0) = U_{y}(x,0)\quad \text{for}\ x \in \mathbb{R}^{d}.\end{array} \right. }$$](/wp-content/uploads/2016/04/A183156_2_En_47_Chapter_Equ40.gif)


