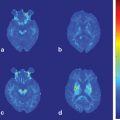
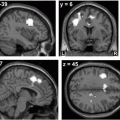
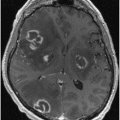
Fig. 2.1
Average cortical thickness and statistical results rendered on semiinflated white matter surface. The average regional cortical thickness of healthy controls (a) and patients with Parkinson’s disease (PD) (b) are expressed as color scale. c The cortical areas where the thickness is thinner in patients with PD than that of controls are expressed as cold colors. The upper color scale bar shows cortical thickness (mm) and the lower color scale bar shows logarithmic scale of P-values (− log10P) [43]
Dementia with Lewy Bodies (DLB)
A promising future direction in computational anatomy is the intention to create reliable neuroimaging biomarkers for early differentiation between DLB and dementia/parkinsonism . Contrary to ROI analyses showing volumes and atrophy rates in DLB within the normal range, the whole-brain comparison between DLB and demented iPD patients revealed greater regional volume loss in temporal, parietal, and occipital lobes for DLB patients despite the similar degree of dementia [39]. Interestingly, the pattern of volume loss in DLB was different from the frontal and temporal regional atrophy present in AD patients. According to another VBM study, DLB patients had significantly reduced right-sided fronto-temporal gray matter volume compared with iPD patients [44]. DLB patients show a characteristic pattern of white matter involvement with FA reductions in posterior regions correlating with poor performance in visuo-spatial tasks [45].
The overall conclusion from comparative morphometry studies in iPD, including AD cases, confirms the notion based on clinical experience that DLB and iPD with dementia might represent subtypes of the same spectrum of disorder with distinct patterns of brain structure changes reflecting dysfunction in specific cognitive domains.
Establishing Brain Morphometry as a Noninvasive Diagnostic and Predictive Biomarker in Early Stages of Disease
Neuropathological studies confirm the notion that at the time of first clinical signs, the underlying neurodegenerative process has been progressing for at least 10 years [46]. This motivates the continuous interest to investigate iPD-specific brain atrophy patterns bearing the theoretical possibility of high diagnostic and predictive value. The development of sensitive biomarkers at a very early clinical stage or even before symptom onset could pave the way to measure the efficacy of putative disease-modifying treatments. The assumption here is that neuroimaging can capture correlates of specific neuronal loss in early iPD.
Considering the fact that olfactory impairment is one of the first clinical signs in iPD, VBM studies focused on correlation between the degree of olfactory impairment and brain structure. Early iPD patients showed a trend for positive correlation between olfaction scores and gray matter volume in the right piriform gyrus, while moderately advanced iPD patients showed a positive correlation between olfaction and right amygdala volume [47]. Along these lines, a ROI study using DTI and olfactory testing differentiated between early-stage iPD patients and controls based on reduced FA in the anterior olfactory region [48]. Whole-brain studies in early stages of IPD demonstrated FA and MD changes in the frontal lobe white matter indicating an early microstructural damage [49, 50]. Considering the early involvement of brainstem structures in iPD, a ROI study showed significant volume reduction in the rostral medulla oblongata and the caudal pons [51].
A common limitation of previous studies aiming at preclinical diagnosis is the inclusion of patients even at the very early stages of motor dysfunction, which could pose a hurdle to start neuroprotective drug interventions.
Atypical Parkinsonisms
Progressive supranuclear palsy (PSP) and corticobasal syndrome (CBD) are neurodegenerative diseases pathologically classified as tauopathies. The differential diagnosis is based mainly on clinical criteria and lacks the required specificity and sensitivity. Multisystem atrophy, in its two clinical manifestations, with cerebellar (MSA-C) or parkinson-like (MSA-P) phenotype paralleled by prominent autonomic failure belongs neuropathologically to the family of synucleinopathies, but shares with PSP and CBD a more rapid progression to severe disability than iPD [52]. In early stages, the clinical manifestations of atypical parkinsonisms can mimic iPD and the differential diagnosis poses a challenge even to an experienced movement disorders specialist. Hence, numerous MR studies have attempted to find subtle morphometric differences allowing for earlier and more accurate diagnosis.
Progressive Supranuclear Palsy (PSP)
Although many studies reported successful differentiation of PSP from other forms of parkinsonism in the advanced stages of disease, there is still little evidence for an added diagnostic value of computational anatomy studies in the early phase. Volumetric and VBM studies confirm neuropathological findings with a prominent involvement of mesencephalic structures [53, 54]. The extent of cortical atrophy involves the medial frontal and lateral middle frontal gyri, the insular region comprising frontal opercula, SMA, and left mediotemporal areas [55]. The reported diagnostic accuracy distinguishing between iPD and PSP shows 84.3 % sensitivity and 79 % specificity using clinical criteria as a gold standard [56].
Corticobasal Degeneration (CBD)
Considering the substantial divergence between diagnosis based on clinical and neuropathology criteria, the existence of CBD as a clinico-pathological entity is still debated [57]. In clinically defined CBD cases, visual inspection of clinical scans can be enough to observe the typical asymmetric atrophy involving the frontal and parietal lobes. Accordingly, VBM studies in CBD showed a specific pattern of gray matter volume reduction involving the bilateral premotor cortex, superior parietal lobules, and striatum [58]. Another piece of evidence supporting the notion about differential physiopathology of cognitive decline in atypical parkinsonism is brought by a combined pathology-VBM study showing that subcortical white matter volume reductions in PSP are the strongest predictor of cognitive impairment opposed to cortical gray matter changes in CBD [59]. Using an ROI approach, Rizzo et al. [60] computed apparent diffusion coefficient (ADC) maps from DWI data to differentiate between iPD, CBD, and PSP (Richardson syndrome phenotype). ADC changes in putamen differentiated between typical and atypical PD forms, but failed to distinguish between CBD and PSP. Interestingly, the calculated hemispheric symmetry ratio demonstrated 100 % sensitivity and specificity for accurate differentiation of CBD from PSP and iPD patients.
Multisystem Atrophy (MSA)
A number of brain structure changes in MSA —most notably putaminal atrophy—have been reported in the literature. Novel in the field of automated morphometry is the combination of VBM and voxel-based quantification (VBQ) analysis. This approach was employed to differentiate between MSA-C and MSA-P variants of MSA demonstrating more severe infratentorial volume loss in MSA-C with pronounced T2-relaxation reduction in cerebellum and brain stem [61]. Using VBM and a prospective design, Brenneis et al. [62] found widespread cortical and subcortical atrophy in MSA as opposed to normal findings in iPD. In addition, MSA patients showed a positive correlation between cortical volume loss and disease duration, and a negative correlation in the striatum. The author’s supposition here was that early basal ganglia atrophy drives late onset cortical atrophy.
Diffusion parameters such as ADC raised hopes for deeper insight in the pathophysiology of atypical parkinsonism . In a recent study, ADC parameters in preselected ROIs differed between iPD, MSA, and PSP patients. In particular, ADC values in the pons, middle cerebellar peduncle, cerebellar white matter, and cerebellar dentate nucleus were higher in MSA than in PSP and controls; in PSP, they seemed to be higher in midbrain, globuspallidus, and caudate [63].
Most VBM studies are conducted at a group level and, although providing valuable information about the disease progression, are not suitable for studying the single-subject case. Manual scalar assessment of brain stem morphology characteristics have often been adopted with success, achieving differentiation of PSP from MSA with a sensitivity of 100 % and specificity of 90.5 % on the single-subject level, but suffer some operator-dependent limitations, or are extremely time consuming [64–66]. A recent study attempted to overcome these limitations by classifying quantitative structural whole-brain imaging data by employing a support vector machine approach [67]. This method proved to be quite promising, especially for differentiating PSP from iPD, with up to 96.8 % accuracy. In MSA versus iPD, an accuracy of 71.9 % was achieved; sensitivity, however, was low with 36.4 %. Interestingly, the support vector machine could not differentiate between iPD and healthy subjects, which, according to authors’ opinion, is in line with the sparse results of previous VBM studies in iPD patients without dementia. This study demonstrates the need to combine established and novel computational techniques in order to achieve unbiased and reproducible results. For infrequent conditions such as atypical parkinsonism, the aim is to extend the observations to larger cohorts by taking care to reduce hardware- and operator-dependent biases.
Dystonia
The precise pathophysiological mechanisms underlying the occurrence of primary torsion dystonias (PTD) remain elusive. By definition, the brain structure in idiopathic dystonia is normal on neuroradiology inspection. The involvement of basal ganglia initially suggested by lesion studies and theoretical models were confirmed by subsequent morphometric MR studies [68]. In recent years, computational anatomy findings confirmed the extent of structural changes to other brain areas, most notably sensorimotor cortex and cerebellum.
Evidence arising from lesional and neurophysiology studies in humans and animals implicate the putamen for its critical role in the pathogenesis of dystonia [69, 70]. A bilateral increase in putaminal gray matter was demonstrated in patients with blepharospasm (BLS) [71, 72], focal hand dystonia [71], cervical dystonia, spasmodic dysphonia, and musician’s dystonia [73]. However, there are controversial results, particularly in BLS [74] and cervical dystonia [75, 76] reporting volume decreases (Table 2.1). A potential explanation was suggested by a recent study in musician’s dystonia. Putamen gray matter volumes in professional pianists were increased in the presence of dystonia and correlated inversely with skilled piano playing performance even in healthy subjects. Immobilization of the affected hand in dystonic musicians was accompanied by gray matter putamen volume reduction promptly inversed after some weeks of practice [77]. Altogether, the published studies point mainly toward a volume increase rather than decrease, but the reason of such inconsistencies is hard to explain. We favor the idea of the occurrence of abnormal adaptive processes, with aberrant plasticity and variations in putamen volume in either direction, the underlying pathological and synaptic mechanisms not being sufficiently accessible to current neuroimaging techniques.
Table 2.1
Voxel-based morphometry (VBM) studies of primary dystonias are shown according to type of dystonia. (From [78])
Blepharospasm | 16/16 | Put (↑) | IPL (↓) | Etgen et al. [72] | ||
Blepharospasm | 11/14 | Caud (↑) | Hem (↑) | Thal (↓) | Obermann et al. [74] | |
Cervical dystonia | Put (↓) | |||||
Cervical dystonia | 10/10 | GP (↑) | Floc (↑) | PM (↑) | Draganski et al. [79] | |
Cervical dystonia | SMA (↓) | |||||
Cervical dystonia | DLPFC (↓) | |||||
Cervical dystonia | OCC (↓) | |||||
DYT1 dystonia | 11/31 | Egger et al. [76] | ||||
Focal hand dystonias | 9/14 | Caud (↑) | Hem (↑) | STL (↑) | Thal (↑) | Obermann et al. [74] |
Focal hand dystonias | Put (↓) | |||||
Generalized (idiopathic) | 29/28 | Put (↑) | Draganski et al. [80] | |||
Writer’s cramp | GP (↑) | |||||
Writer’s cramp | 19/28 | Caud (↓) | PM (↓) | Pantano et al. [75] | ||
Put (↓) | SMC (↓) | |||||
11/11 | Put (↓) | Draganski et al. [80] | ||||
36/36 | SMC (↑) | Garraux et al. [81] | ||||
11/31 | GP (↑) | Egger et al. [76] | ||||
9/31 | GP (↑) | Egger et al. [76] | ||||
30/30 | Hem (↓) | SMC (↓) | Thal (↓) | Delmaire et al. [82] | ||
14/14 | PM (↑) | Granert et al. [77] |
The involvement of brain structures other than putamen is backed by evidence for gray matter increase in the right internal globus pallidus [79], thalamus, caudate, superior temporal lobe, and left cerebellum [74]. Focal hand dystonia is associated with bilateral thalamic volume reductions [82, 83] and bilateral accumbens and internal globuspallidus increases [76]. Concerning DWI -derived parameters, studies in dystonic patients demonstrate FA reductions in corpus callosum, pallidum, and caudate [84]. According to Fabbrini et al. [85], there is decreased MD in the caudate, and putamen unilaterally paralleled by bilateral thalamic FA decrease in cervical dystonia. An increase of cerebellar gray matter volume has consistently been observed in focal dystonia [74, 79, 82, 86], most likely reflecting compensatory mechanisms [86]. At the cortical level, findings are also more consistent and show volume increases in sensorimotor areas [76, 79, 82, 81]. On the opposite, the results of the single study demonstrating sensorimotor cortex volume reduction progressing toward the 5 years follow-up scan in the absence of cervical dystonia symptom progression could be interpreted as age-related effects.
In summary, the provided evidence for subtle structural changes in primary dystonias converges to regional volume increases and microstructural modifications in basal ganglia, sensorimotor cortex, and cerebellum. The prevalent interpretation links the presence of volume expansion with the notion of abnormal brain plasticity in dystonia. The inconsistencies among studies arise most probably not only from methodological differences, but also from the choice of studied populations based mainly on clinical phenotype rather than genetic characterization.
Considering the fact that generalized early-onset dystonias are associated with genetic abnormalities under the modulatory impact of variable dominance and penetrance, neuroimaging research started investigations looking for informative genotype–phenotype interactions [87, 88]. Albeit morphometric alterations in patients brains could be an effect of brain plasticity secondary to the dystonic movements and postures and not their cause, findings from symptomatic carriers of particular genetic mutations suggest complex genotype–phenotype interactions. A voxel-based analysis of anatomical connectivity maps obtained with probabilistic diffusion tractography in manifesting and nonmanifesting DYT1 and DYT6 carriers, including correlation with cerebral blood flow PET measurements and assessment of motor behavior, showed reduced fiber integrity in the cerebellum-thalamus-cortex axis. Previous VBM study demonstrated morphometric correlates of an interaction between phenotype (i.e., presence of dystonic symptoms) and genotype (presence of a DYT1 gene mutation) with putamen volume changes in familial, sporadic non-DYT1 adult onset primary torsion dystonia (AOPTD) , and DYT1 gene mutation carriers [80]. Further exploration in individual gene carriers supported the notion of phenotype penetrance determination by connectivity differences in the proximal cerebellar segment of the cerebellum-thalamus-cortex axis [89].
Correlation between brain structure and behavioral parameters capturing subclinical pathology in familial AOPTD supported the hypothesis that basal ganglia volume changes are neural correlates of specific dystonia endophenotypes. ROI analysis demonstrated putamen volume expansion in nonmanifesting family members of familial AOPTD with pathological temporal discrimination thresholds for visual and tactile stimuli [73]. Dissecting further the morphometric correlates of familial and sporadic AOPTD endophenotypes, the authors found volume changes in primary somatosensory cortex, putamen and caudate depending on spatial discrimination thresholds or familial background.
The conclusion from these studies is that subtle sensory abnormalities are related to brain structure changes, though the interaction between differential subclinical sensory pathology and putamen volume with possible genetic modulation remains to be elucidated. From a pathophysiological point of view, we favor the idea that a defective sensorimotor integration promotes aberrant plasticity, as measured in terms of morphometric changes, and is eventually responsible for the loss of the harmonic interplay of agonists and antagonists muscle groups, typical of dystonia.
Huntington’s Disease (HD)
HD is a paradigmatic genetic neurodegenerative disease with dominant monoallelic transmission and full penetrance, and a highly predictable course within triplet expansion variability. The possibility of a presymptomatic diagnosis and the intense research for disease-modifying compounds create the need for a reliable marker of HD progression even before symptom onset. Progressive caudate atrophy in HD is a well-known pathological manifestation, which is easily detectable on conventional MRI images when the symptoms are established [90]. Disregarding methodological differences, morphometry studies also agree on the presence of progressive caudate tissue loss in HD correlating with CAG repeat length, cognitive and motor performance [91, 92].
Novel aspects in computational anatomy studies of HD are the attempts to characterize spatial pattern and temporal dynamics of extrastriatal structure changes in different stages of disease progression. Specific atrophy patterns have been described by a prospective VBM study in frontal, middle temporal, insular, and cerebellar areas, which correlated with symptom severity and CAG repeat length [93]. Progression rate correlates both with CAG repeats length and with age of onset, although not always with both, indicating the possible existence of other epigenetic factors modulating the local neurodegeneration [94]. Recent cortical thickness analysis demonstrated high topographic anatomical sensitivity to both motor and cognitive dysfunctional aspects in a wide span of disease-progression phenotypes [95].
Analysis of DWI data in HD tested the hypothesis of preferential loss of connections along specific radiating directions. Parallel increases in FA/MD were associated with dispersion of the principal diffusion direction with emphasis on striatopallidal connections [96]. Taking advantage of improved corpus callosum segmentation, diffusion-weighted parameter analysis showed specific regional changes in white matter integrity correlating with cognitive performance in early HD patients, suggesting dysfunctional interhemispheric information transfer [97]. White matter morphometry proved to be of great value for accurate automated classification in presymptomatic HD mutation carriers [10, 98]. In the caudate, FA and MD were decreased in presymptomatic HD, but increased in definite HD, suggesting developmental alterations leading to a peculiar histological architecture, preceding the onset of neurodegeneration [99].
Gray matter reductions in hypothalamus have been shown to differentiate gene carriers from controls [100]. Cortical thinning in the posterior–superior cerebrum has been found up to 15 years before the overt clinical onset (Fig. 2.2, [101]). Additional evidence of a smaller intracranial volume in prodromal HD [102] indicated total brain volume as an interesting group-level biomarker [98]. Relaxometry studies in HD demonstrated a lower peak height of the gray matter MT ratio in symptomatic mutation carriers [103]. Despite the limited number of studies utilizing relaxometry techniques, the field is open for more investigation considering recent evidence for a pivotal role of altered iron homeostasis early in disease course [104].
Fig. 2.2
Cortical thickness maps. Starting from the left, each group of six maps represent the comparison of cortical thickness between each prodromal HD group and the controls (Dx diagnosed). Left hemisphere is only shown. The top row shows (from left to right) lateral and medial views, the second row shows dorsal and ventral views, and the last row shows anterior and posterior views, respectively [101]
Essential Tremor (ET)
The precise etiology, clinical classification, and differentiation of essential tremor (ET) and tremor associated with dystonia are still subject of debate. Converging data indicate heterogeneity of the disorder, a pivotal role for genetic factors and possible association with risk for iPD.
Corresponding to the current status of debate, only a few morphometric studies of ET have been published. A cerebellar involvement is suggested by the clinical presentation, often associating the signs of kinetic tremor to an underlying ataxia [105], which are further confirmed by neuropathological data with loss of Purkinje cells [106]. Early VBM studies have demonstrated a very localized involvement of the cerebellum in patients with head tremor [107, 108].
The involvement of cerebellum has been further confirmed by diffusion-weighted studies showing MD increases and FA decreases in the inferior cerebellar peduncles [109]. The interhemismpheric asymmetry of the FA reductions was explained as an effect of handedness, responsible for a relatively higher myelination on the dominant side. This interpretation is hard to prove, and a subsequent study failed to reproduce the findings [110]. The analysis was extended to whole-brain analysis using tract-based spatial statistics (TBSS) that showed increase of MD in the right cerebral hemispheric WM, involving the internal capsule, external capsule, and frontoparietal lobar WM, bringing strong arguments for extracerebellar involvement [111].
Actually, a growing body of evidence suggests the presence of a more widespread white matter axonal damage in ET. From a clinical perspective, this is in line with the coexistence of mild cognitive impairment, olfactory dysfunction and personality changes, and gives further support to the idea of ET as a neurodegenerative disease [112]. More recent whole-brain VBM comparisons between ET and healthy controls demonstrated white matter changes in the midbrain, occipital lobes, and right frontal lobes in addition to the expected gray matter bilateral changes in the cerebellum [113, 114].
The exploration of brain structure in ET remains at the descriptive level with attempts for more thorough differentiation from other tremor entities. One of the challenges for the future research remains the whole brain assessment and tissue characterization of specific endophenotypes in genetically defined populations.
Gilles de la Tourette Syndrome (TS)
From a classical reductionist perspective, Gilles de la Tourette syndrome (TS) was considered a pediatric psychiatric disease further supported by the lack of evidence of associated brain abnormalities. Due to a high variability of clinical presentation and comorbidities as obsessive–compulsive disorder (OCD) and attention deficit-hyperactivity disorder (ADHD), structural imaging studies reported controversial anatomical findings. Nevertheless, most of structural changes corroborate the hypothesis of alterations in cortico-striato-thalamo-cortical circuits. Several network nodes involved in TS etiopathology were identified by studies using VBM, cortical thickness, and local diffusivity properties.
< div class='tao-gold-member'>
Only gold members can continue reading. Log In or Register to continue
Stay updated, free articles. Join our Telegram channel

Full access? Get Clinical Tree


