Fig. 7.1
Midsagittal T1-weighted MR images in a patient with PD (a), a patient with MSA-P (MSA with predominant parkinsonism) (b), and a patient with PSP (c). a No pontine or midbrain atrophy in the patient with PD. b Pontine atrophy (arrow) without midbrain atrophy in the MSA-P patient. c Midbrain atrophy without pontine atrophy (divided by the white line) forming the silhouette of the “penguin” or “hummingbird” sign with the shapes of midbrain tegmentum (bird’s head—above the white line) and pons (bird’s body—below the white line). (© M. Schocke, K. Seppi. Department of Radiology, Department of Neurology. Innsbruck Medical University)
Fig. 7.2
Axial T2-weighted MR images at the striatal level in a patient with PD (a) and a patient with MSA-P (b). The image appears normal in the PD patient, whereas there is putaminal atrophy (arrow), putaminal hypointensity (dotted arrow), and a putaminal hyperintense rim (dashed arrow) in the patient with MSA-P. (© M. Schocke, K. Seppi. Department of Radiology, Department of Neurology. Innsbruck Medical University)
Parkinson Disease
In early iPD patients, cMRI does not indicate disease-specific changes. Therefore, its main role is detecting or ruling out other underlying pathologies causing nonneurodegenerative symptomatic parkinsonisms. Structural brain imaging using MRI is usually normal in patients with uncomplicated iPD. In more advanced stages of the disease, signal changes in the area of the SN such as hyperintensities in T2-weighted sequences, or smudging of the red nucleus borders toward the SN, may occur. When using the inversion recovery ratio, signal loss in the SN has also been reported in patients with iPD [3–5]. Some studies were able to completely discriminate between iPD patients and healthy controls [3], whereas other authors found an overlap between normal and iPD values in their results [4, 5]. A recent study using 3-dimensional 7.0 T and T2*-weighted gradient-echo sequences could definitively visualize anatomical alterations occurring in the SN of iPD patients, depicting undulated boundaries between the SN and crus cerebri [6]. By using voxel-based morphometry (VBM) , an operator-independent and automated detection of significant volume differences in the whole brain involving voxel-wise statistical analysis of preprocessed structural MR images, gray matter loss of frontal cortical areas could be revealed in advanced iPD patients (see Chap. 3 for a more in-depth review).
Multiple System Atrophy
Multiple system atrophy is an adult-onset, sporadic, progressive neurodegenerative disorder characterized by an increase of alpha-synuclein in oligodendroglia and neuronal loss in multiple areas of the CNS. It is clinically characterized by the variable combination of autonomic failure, parkinsonian symptoms, cerebellar ataxia, and pyramidal signs. Diagnosis during life is often difficult, especially in early stages of the disease, and distinction between MSA-P (MSA with predominant parkinsonism) and iPD can be impossible on clinical grounds alone. Nevertheless, an early differentiation between MSA and iPD is essential because of specific therapeutic needs and higher morbidity and mortality of patients with MSA.
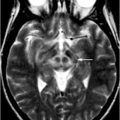
Structural MRI in patients with MSA frequently shows characteristic abnormalities in the striatum, brain stem, and cerebellum. The most striking imaging features using cMRI at 1.5 T include putaminal atrophy, hypointensity of the putamen in T2-weighted sequences, and “slit-like” marginal hyperintensity. In addition, abnormalities such as atrophy of the lower brain stem, middle cerebellar peduncle (MCP), and cerebellum, as well as hyperintensities in the pons, MCP, and cerebellum are found in patients with MSA (see Figs. 7.1 and 7.2). Although putaminal atrophy seems to be quite specific and appears to distinguish between MSA and iPD, T2 putaminal hypointensity and hyperintense putaminal rim may also occur in iPD patients. Infratentorial features including atrophy of the pons, lower brain stem, MCPs, medulla, inferior olives, and cerebellum could favor a diagnosis like MSA-C (MSA with predominant cerebellar ataxia). An interesting pattern occasionally resembling the “hot cross bun” sign. This sign comprises T2 signal hyperintensities within the pons and both MCPs, reflects degeneration of pontocerebellar fibers (Fig. 7.3), whereas the median raphe, transverse pontocerebellar fibers ventral to the tegmentum,and anterior and anterolateral contours of the pons show no signal changes. Highly indicating for MSA, this impressive pattern may also be rarely found in nonneurodegenerative parkinsonism [7] and even in patients with spinocerebellar ataxia (SCA) [8].
Fig. 7.3
Axial T2-weighted MR image in a patient with MSA-P demonstrating the “hot cross bun” sign (arrow) in the basis pontis. (© M. Schocke, K. Seppi. Department of Radiology, Department of Neurology. Innsbruck Medical University)
When comparing MSA-P with MSA-C, the structural and signal changes at 1.5 T mentioned above appear more often and earlier in MSA-P than in MSA-C; on the other hand, infratentorial abnormalities seem to appear more often and earlier in MSA-C than in MSA-P. Overall, putaminal and infratentorial findings detected by MRI at 1.5 T demonstrate high specificity for distinguishing MSA from iPD and healthy controls, while specificity of the putaminal changes is inadequate to differentiate MSA from other forms of aPS. Especially in the early course of the disease, sensitivity of the above-mentioned findings is suboptimal and inconsistent in the literature. Sensitivity of signal alterations can be somewhat improved by modifying technical aspects such as spatial resolution by using thinner slices or modifying relaxation contrast by using T2*-weighted gradient-echo sequences.
By applying VBM in patients with MSA, basal ganglia and further infratentorial structures show volume loss, and atrophy is even detectable in several cortical regions. Interestingly, callosal thickness declines over time more pronounced in MSA patients, showing a marked loss of volume mainly in the isthmus. An MCP width, using a cutoff value of 8 mm, is shown to be significantly smaller in patients with MSA compared with iPD patients and healthy controls. Furthermore, the area of the pons measured on midsagittal T1-weighted MR images is smaller in patients with MSA-P than in those with iPD or control subjects. By using voxel-based relaxometry (VBR) , signal abnormalities can be demonstrated in the cerebellum and brain stem reflecting infratentorial brain atrophy in MSA-C. Using magnetic resonance volumetry, significant reductions in whole brain, striatal, brain stem, and cerebellar volumes are seen in MSA.
Progressive Supranuclear Palsy
Progressive supranuclear palsy is clinically characterized by poorly levodopa-responsive parkinsonism with supranuclear vertical gaze palsy, postural instability, and falling early in the disease course. The parkinsonian variant of PSP (PSP-P) initially may closely mimic iPD with preserved levodopa responsiveness and a lack of characteristic features, like early falls or vertical gaze palsy. The pathological hallmarks of PSP are tau-positive neuronal inclusions and cell loss particularly in the SN, globus pallidus (GP), pons, and subthalamic nucleus.
Common findings on cMRI in patients with PSP include atrophy of the midbrain with enlargement of the third ventricle and tegmental atrophy, as well as T2 signal increase in the midbrain and the inferior olives, and atrophy of frontal and temporal lobes. Putaminal tissue loss, atrophy of the superior cerebellar peduncle (SCP), and the mammillary bodies are also commonly detected. Furthermore, the following indirect parameters of midbrain atrophy may assist in the differential diagnosis of PSP: shortened anteroposterior midbrain diameter, dilatation of the third ventricle, and abnormal superior profile of the midbrain, depicting a flat or concave contour versus convex aspect in healthy people. On midsagittal MR images, these features can create a specific architecture referred to as the “penguin” silhouette or the “hummingbird” sign, with the shape of the midbrain tegmentum resembling the bird’s head and the pons resembling the bird’s body (see Fig. 7.1c). In axial sections, the reduced anteroposterior midbrain diameter with a selective atrophy of the midbrain tegmentum and with a relative sparing of midbrain tectum and cerebellar peduncles can form the so-called “morning glory flower sign” of “Mickey mouse sign.” Values with 14 mm and lower appear to be quite specific for PSP compared with healthy controls, iPD patients, and MSA-P patients. This metric has been suggested to separate adequately between PSP and non-PSP [9], but recent studies could not confirm these postulated results, presenting overlapping values [10–12]. Another helpful imaging-dependent tool for the differentiation between PSP and non-PSP is the planimetric measurement of the pontine and midbrain area, as well as the width of SCPs and MCPs. The MR parkinsonism index (MRPI) is calculated as the product of the ratio of pons area to midbrain area in midsagittal expanse multiplied by the ratio of the width of MCPs and SCPs ([area pons/area midbrain] × [width MCP/width SCP]) [10]. Both a decreased midbrain-to-pontine area ratio (m/p-ratio) as well as an increased MRPI seem to be helpful in distinguishing PSP from MSA, iPD, and controls, achieving diagnostic accuracy values ranging between 80 and 100 %. By comparing the diagnostic accuracy of the MRPI and the m/p-ratio, the MRPI seems to better differentiate PSP from MSA-P, whereas the m/p-ratio is a better discriminator between PSP and iPD [13].
By applying VBM in patients with PSP, gray matter loss is pronounced in frontotemporal cortical areas including the prefrontal cortex and the insular region, whereas white matter loss is found in the midbrain, comprising cerebral peduncles and central midbrain structures. One study tested the clinical utility of the VBM results as a guide for the differential diagnosis of PSP from iPD and controls by allocating the subject to either PSP or “non-PSP,” on the basis of the presence or absence of the midbrain tissue loss. A sensitivity of 83 % and a specificity of 79 %was achieved for discrimination between the two disorders [14].
Corticobasal Degeneration
Corticobasal degeneration (CBD) is an adult-onset, tau-positive, progressive parkinsonian syndrome. Its clinical appearance as CBS presents strikingly asymmetric features and additional signs and symptoms referable to both cerebral cortex and basal ganglia. The most prominent clinical features in patients with CBS are apraxia, cortical sensory loss, and involuntary movements, which have been referred to as alien hand; extrapyramidal signs may consist in parkinsonian symptoms or dystonia.
In patients with CBD, only few studies have investigated the role of cMRI, depicting cortical atrophy and hyperintense signal changes in the motor cortex or subcortical white matter on T2-weighted images. Furthermore, significantly greater T2-weighted signal hypointensity in the putamen and the GP are common. Although mostly described as frontoparietal and asymmetric, cortical atrophy may also affect other parts of the brain and may even occur in a symmetric pattern. Koyama et al. [15] were able to demonstrate atrophy in the corpus callosum and bulk loss in the cerebral peduncles with ipsilateral pattern of atrophy to the dominant atrophic cerebral hemisphere, whereas signal intensity changes in the cerebral peduncles are absent. Increased T2-weighted lenticular signal hypointensity, ventricular enlargement, and asymmetric cortical atrophy have been suggested as supportive MRI diagnostic findings in patients with CBD, although none of these MRI abnormalities are specific for the disease. A summary of typical MRI patterns for the differential diagnosis of neurodegenerative parkinsonism using 1.5 T are shown in Tables 7.1 and 7.2.
Table 7.1
Signal and structural changes in MSA and PSP using cMRI at 1.5 T
MSA-P | PSP |
|---|---|
Supratentorial changes and abnormalities | |
Putaminal atrophy | Putaminal atrophy |
Putaminal hypointensity | Atrophy of frontal and temporal lobe |
“Slit-like” marginal hyperintensity (putaminal hyperintense rim) | |
Infratentorial changes and abnormalities | |
Atrophy and/or hyperintensities of lower brain stem, MCP, and cerebellum | Atrophy and/or hyperintensity of the midbrain • Shortened anteroposterior midbrain diameter < 14 mm (eventually Mickey mouse sign) • Abnormal superior profile of the midbrain (flat or concave contour) • “Hummingbird” sign or “penguin” silhouette |
Atrophy and/or hyperintensity in the pons (possible “hot cross bun” sign) | |
Enlargement of the third ventricle | |
Atrophy and/or hyperintensity of SCP | |
Table 7.2
Characteristic MRI patterns for the differential diagnosis of neurodegenerative parkinsonism using 1.5 T
iPD | MSA (-P) | PSP | |
|---|---|---|---|
cMRI | |||
Normal | + + | − | − |
Putaminal atrophy | − | + + | + + |
Putaminal hyperintense rim | + | + + | + |
Putaminal hypointensity | − | + + | − |
Atrophy of pons and vermis cerebellaris | − | + + | + |
Signal changes in the pons (hot cross bun sign) or MCPs | − | + + | − |
Midbrain atrophy (Mickey Mouse sign and penguin silhouette in PSP patients) | − | − | + + |
MRI planimetry | |||
Decreased anteroposterior midbrain diameter | − | + | + + |
Decreased ratio of midbrain and pons area | − | + | + + + |
Abnormal MRPI ( > 15 in patients with PSP) | + | − | + + + |
DWI | |||
Increased putaminal diffusivity | − | + + + | + + |
Increased diffusivity of SCP | − | − | + + + |
Structural MRI in DLB and PD Dementia
Dementia with Lewy bodies and PD with dementia (PDD) are considered two manifestations of a clinical and pathological spectrum. DLB and PDD are differentiated from other dementia subtypes by the presence of Lewy body pathology, which is commonly detectable in neocortical and limbic areas as well as in brain stem nuclei. DLB and PDD have a similar clinical phenotype, presenting a considerable overlap of symptoms. Features include spontaneous motor parkinsonism, recurrent visual hallucinations, and fluctuating subcortical and cortical neuropsychological deficits with prominent attention dysfunction and impairment of executive function, visuospatial function, and aspects of language and memory retrieval. The separation between DLB and PDD is based on the duration of motor symptoms relative to the development of cognitive impairment, using a simple 1-year rule: onset of dementia within 1 year of parkinsonism favors DLB, whereas more than 12 months of parkinsonism before dementia onset points toward PDD. However, in clinical routine, differential diagnosis of DLB and PDD and other dementia subtypes such as Alzheimer disease (AD) can still be challenging.
MRI routine sequences of patients with DLB and PDD often show whole brain atrophy with a diffuse pattern of gray matter atrophy in the temporal, parietal, middle, and inferior frontal gyri and the occipital lobes. A robust MR finding in DLB and PDD is a relative preservation of the medial temporal lobe when compared with AD (Fig. 7.4). Moreover, the absence of medial temporal atrophy is highly specific for separating DLB/PDD from AD with insufficient sensitivity, but no conventional MR features could be established to distinguish DLB and PDD. In addition, sometimes gray matter loss may be identified around the third ventricle, representing the hypothalamus. These findings were supported by a prospective MRI study with pathological verification [16]; the neuropathological correlates of medial temporal atrophy include senile plaques and neurofibrillary tangles, but not Lewy body-associated pathology.
Fig. 7.4
Coronary MR image in a patient with dementia with Lewy bodies (disease duration 1.5 years) showing relative preservation of the medial temporal lobe (a), and coronary MR image in a patient with Alzheimer disease (disease duration 2 years) depicting marked atrophy of medial temporal lobe and hippocampus formation (b). (© M. Schocke, K. Seppi. Department of Radiology, Department of Neurology. Innsbruck Medical University)
In summary, DLB and PDD share similar patterns of MRI changes, showing structural preservation of the medial temporal lobe, one of the main distinguishing criteria compared with AD. This imaging feature could be a diagnostic marker for the differentiation of DLB and AD and is indeed part of the consensus criteria for the clinical diagnosis of DLB.
Structural MR Changes in Secondary Parkinsonism
Structural lesions causing symptomatic parkinsonism include space-occupying masses in the region of the basal ganglia and brain stem and strategic microvascular or macrovascular lesions, as well as normal pressure hydrocephalus (NPH) or medication-induced parkinsonism. Furthermore, rare diseases such as Huntington disease (HD), Wilson disease, or NBIA syndromes (neurodegeneration with brain iron accumulation) can cause parkinsonism (Table 7.3). Because of similar clinical presentations, these syndromes require diagnostic work-up including evaluation of structural imaging .
Table 7.3
MRI findings for differential diagnosis in symptomatic parkinsonism
Entity | Typical MRI findings (may vary) |
|---|---|
1. Vascular parkinsonism | Lacunar infarctions in the basal ganglia, frontal lobe infarctions, subcortical microangiopathic lesions with diffuse periventricular signal alterations |
2. Normal pressure hydrocephalus | Enlargement of lateral cerebral ventricles, ballooning of anterior horn of lateral ventricle, periventricular T2 signal alterations |
3. Toxic-induced parkinsonism | |
3.1 Manganese | Hyperintensities in the GP, increasing signals in T1-weighted sequences in the striatum and SN |
3.2 Ephedrone (methcathinone) | Increased bilateral and symmetric T1-signal intensity in the GP and hyperintensities in the SN, no signal abnormalities on T2-weighted images |
3.3 Carbon monoxide | Transient bilateral symmetric lesions in the GP with hyperintensities in T2-weighted images |
3.4 Cyanide | Symmetric hyperintense signal changes in the GP, putamen, caudate nucleus, and white matter areas in T2-weighted images and FLAIR-sequences, lesions in the basal ganglia displaying T1 signal increase with contrast enhancement |
3.5 Methanol | T2 signal increase and T1 signal decrease in the area of the putamen |
4 Huntongton disease (Westphal variant) | Progressive bilateral atrophy of the striatum and caudate nucleus with enlarged anterior horn of lateral ventricle; in the later course, widespread atrophy throughout the cortex; extend of white matter loss is relatively greater and earlier detectable |
5 Wilson disease | Atrophy of the midbrain, brain stem, and cerebellum; marked T2 hypointensity in the GP, symmetric T2 hyperintensity in the striatum, lateral thalamus, white matter, and dorsal brain stem; “face of the giant panda”: T2-weighted axial MRI with normal signal at the red nuclei (eyes) and lateral aspects of the SN (ears) with signal increase at the tegmentum and hypointense superior colliculi < div class='tao-gold-member'>
Only gold members can continue reading. Log In or Register to continue
Related posts:Stay updated, free articles. Join our Telegram channel
Full access? Get Clinical Tree
 Get Clinical Tree app for offline access

|