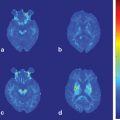
Fig. 14.1
Axial Fluid Attenuated Inversion Recovery (FLAIR) MRI in a patient with Myoclonic Epilepsy with Ragged Red Fibers (MERRF)
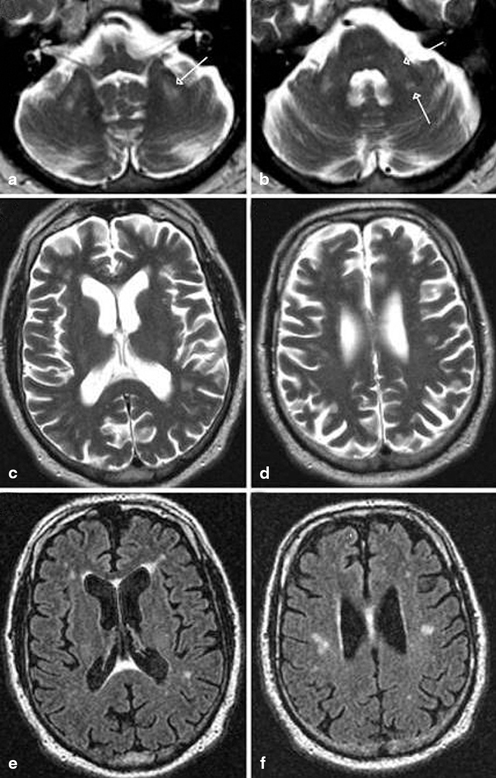
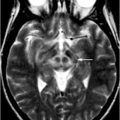
Fig. 14.2
MRI findings associated with FXTAS. a–d T2-weighted MRI; e, f FLAIR MRI. a Hyperintense sign in the deep white matter surrounding the dentate nucleus. b Hyperintense sign in the MCP that is both mild (anterior arrow in b) and moderate (posterior arrow in b) in severity. c–f Moderate cortical volume loss and mild increase of the lateral ventricles; nonspecific increased signal intensity in frontal and parietal white matter, most conspicuous on matching FLAIR images (e, f). (With kind permission from John Wiley and Sons: Movement Disorders (2007) 22: 2018–2030; Berry-Kravis E et al.; Fig. 1)
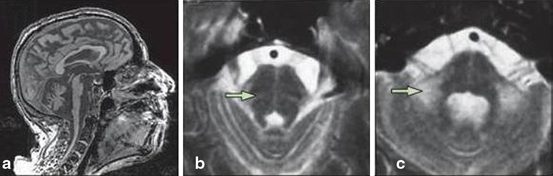
Fig. 14.3
MSA-C. a Severe atrophy of the cerebellum and brainstem, with characteristic flattening of the pons. b, c Hyperintense signal changes in the pons, and in the MCP on T2-weighted images. (Reprinted from The Lancet Neurology, Vol 9, Thomas Klockgether, Sporadic ataxia with adult onset: classification and diagnostic criteria, Pages 94–104, Copyright (2010), with permission from Elsevier)
Multiple recent studies in progressive ataxias have used different neuroimaging techniques to uncover their pathophysiology and to search for possible surrogate markers of disease onset and progression. This chapter will focus on the most common progressive degenerative ataxias, hereditary and sporadic. We will describe general findings of visual MRI analysis that might assist in the diagnosis of specific ataxic syndromes. Second, we will address recent neuroimaging findings and their contribution in the understanding of progressive ataxias.
Spinocerebellar Ataxias (SCAs)
The spinocerebellar ataxias comprise a large and heterogeneous group of autosomal dominant ataxias. There are at least 28 subtypes identified. They lead to degeneration of the cerebellum and its tracts, but also of the brainstem, basal ganglia, cortex, and peripheral nervous system [7]. Although multiple studies have described various MRI findings in SCAs, no specific pattern of atrophy or sign is pathognomonic of a particular sporadic ataxia [8–10]. MRI findings correlate poorly with disease severity, with some asymptomatic carriers showing mild atrophy while mildly symptomatic patients may have normal imaging results [9]. Image processing methods have, however, produced interesting results that increased our understanding of the progression of some of the SCAs and their clinical correlations.
Studying Brain Morphometry
Manual volumetry demonstrated a differential pattern of atrophy when comparing SCA1, SCA3, and SCA6. Cerebellar atrophy was more pronounced in SCA6 and SCA1 than SCA3, while pontine atrophy was more severe in SCA1 and SCA3. Duration of disease correlated with ventral pontine atrophy in SCA3, and with cerebellar atrophy in SCA3 and SCA6 [11]. In addition to the cerebellum and brainstem, Murata et al. evaluated the dentate nucleus, red nucleus, and globus pallidus in SCA6 [12] and SCA3 [13]. They used a graded semiquantitative approach to evaluate cortical atrophy. In SCA6, they observed atrophy of the cerebellum, vermis, pons, MCP, and red nucleus [12]. In SCA3, they showed a more widespread compromise with atrophy of the brainstem, cerebellum, frontal, temporal and occipital lobes, superior cerebellar peduncle (SCP), MCP, and globus pallidus. Pontine and midbrain atrophy in SCA3 were age-dependent while decreased globus pallidus diameter and the degree of temporal and occipital lobe atrophy correlated with duration of illness. Fourteen SCA3 patients (45.2 %) had high signal intensity in the transverse pontine fibers [13]. In SCA1, ataxia correlated with brainstem atrophy, while in SCA3 it correlated with brainstem and cerebellar atrophy [14].
CAG repeat size and age play an important role in disease progression in SCA3 [15, 16]; moreover, the progression of the cerebral involvement is not uniform. While the atrophy of the pontine base and the cerebellum significantly correlated with age, midbrain and pontine tegmentum atrophy did not show progression in a longitudinal study [17]. Pontine tegmentum atrophy seems to occur much earlier than in the pontine base, which remained in the control range long after symptom onset [18]. In addition, SCA3 patients with dystonia had smaller thalamic volumes than those without [19].
A morphometric study in SCA2 used a semiquantitative score system to grade atrophy in infratentorial and supratentorial structures [20]. All patients presented a typical olivopontocerebellar atrophy pattern and frontal lobe atrophy. The parietal, temporal, and occipital lobes were also involved in a small percentage of patients. Interestingly, while there was no correlation between the infratentorial atrophy and clinical measures, supratentorial atrophy correlated with disease duration [21]. In a more recent study, the manually demarcated raw volumes of the cerebellum and pons in SCA2 correlated with the functional staging and disease duration, but not with CAG repeat size [21].
The primary brain target of neurodegeneration in SCA7 appears to be the brainstem, not the cerebellum. The pontine volume in SCA7 is significantly smaller than in SCA3 and SCA6, and pontine atrophy is present regardless of the degree of cerebellar atrophy, clinical severity, and duration of disease (Fig. 14.4) [22]. Spinal cord atrophy has only been evaluated in SCA3 and SCA6, and it is present only in the former [23].
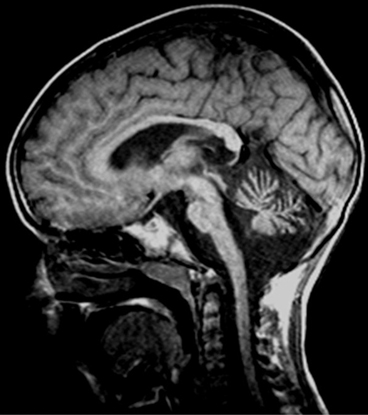
Fig. 14.4
T1-weighted sagittal MRI in SCA7: observe brainstem and pontine atrophy
While previously cited studies were based on preselected regions of interest (ROIs), voxel-based morphometry (VBM) allows for an unbiased evaluation of the entire brain and establishing important clinical correlations. For instance, SCA1 showed a symmetric loss of the gray matter (GM) in the rostral cerebellar vermis and the paramedian portion of the cerebellar lobes when compared to healthy controls. White matter was decreased in the peridentate region and MCPs. The cerebellar and brainstem GM and WM volume loss correlated with disease duration, the International Cooperative Ataxia Rating Scale and the Inherited Ataxia Clinical Scale scores [24]. In SCA2, VBM demonstrated a significant atrophy in several cerebellar and brainstem areas, as well as the left inferior parietal lobule, the corticospinal tracts and the thalamus. Performance on the peg-board version of the Tower of London (coordination) correlated with the anterior cerebellum, while the computerized version (working memory and executive function) correlated with the posterior cerebellum. Authors concluded that neuropsychological tests requiring motor coordination may not be adequate to evaluate patients with SCAs [25].
A comprehensive study performed in SCA3 showed significant GM atrophy in the cortex, subcortex, cerebellum, and brainstem [26]. WM atrophy was restricted to the cerebellum. Age, CAG-repeat length, and disease duration predicted GM density in several ROIs, with age and repeat length being the most important. Interestingly, a longitudinal evaluation, after a 12-month interval, did not reveal significant progression, possibly due to a ceiling effect. In SCA7, VBM showed widespread decrease in GM involving the cerebellar cortex, insula, precentral and postcentral gyri, superior, inferior, and medial frontal gyri, inferior parietal lobule, parahippocampal gyrus, middle occipital gyrus, cuneus, precuneus, and lingual gyrus [27]. SCA17 patients had GM volume reduction in the posterior lobe of the cerebellum bilaterally that correlated with the length of expanded CAG repeats [28]. Atrophy was also observed in the caudate nucleus, postcentral gyrus, and cingulate gyrus. In a longitudinal analysis with an 18-month interval between MRIs, progression of GM atrophy in SCA17 was detected in the cerebellum, globus pallidus, middle temporal gyrus, inferior frontal gyrus, parahippocampus, cingulate gyrus, and precuneus. The progression of the motor symptoms correlated with the progression of the cerebellar atrophy , while the progression of the neuropsychiatric symptoms correlated with GM reduction in cortical areas [29].
Several VBM studies have compared different SCAs in an attempt to establish disease biomarkers and to differentiate patterns of atrophy among them. The findings showed that SCA1 and SCA2 share a similar pattern of atrophy [30, 31]. In SCA1, the volume of the brainstem inversely correlated with the Inherited Ataxia Clinical Scale score; the cerebellar volume correlated with disease duration in both SCA1 and SCA2 [31]. When compared to SCA3, SCA1 presented GM atrophy in clusters within the cerebellar hemispheres and left inferior frontal gyrus; SCA2 revealed clusters of atrophy in several hemispheric cerebellar areas and vermis [30]. WM atrophy was more pronounced in SCA1 and SCA2 than SCA3 (Fig. 14.5). Only SCA1 showed a correlation between the International Cooperative Ataxia Rating Scale score and atrophy in the cerebellum. Importantly, all SCAs demonstrated atrophy in supratentorial regions [30]. When compared to controls, SCA6 yielded GM loss restricted to the cerebellum and vermis, while SCA1 and SCA3 showed GM atrophy in the cerebellum, vermis, brainstem, caudate nucleus, putamen, and temporal lobes [32]. WM loss was present in the brainstem, pons, MCPs, cerebellar hemispheres, and midbrain in SCA1 and SCA3, but no WM changes were evident in SCA6 [33].
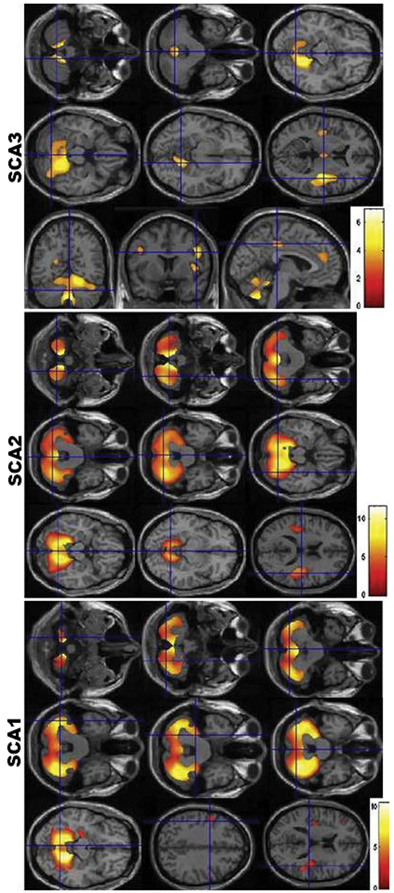
Fig. 14.5
Voxel-based morphometry findings in SCA1, SCA2, and SCA3. Observe the similarities between the pattern of atrophy between SCA1 and SCA2, and the differential atrophy in SCA3. (Reprinted from Parkinsonism & Related Disorders, Vol 17, Gaurav Goel et al, Gray matter volume deficits in spinocerebellar ataxia: An optimized voxel-based morphometric study, pages 521–527, Copyright (2011), with permission from Elsevier)
Diffusion Tensor Imaging (DTI)
There are few studies using DTI in the SCAs. DTI analysis was not able to differentiate SCA1 from SCA2, however it still demonstrated important clinical-imaging correlations [34]. In SCA1 and SCA2, fractional anisotropy (FA) was reduced in the corticospinal tract, transverse pontine fibers, SCP, MCP, and cerebellar WM; increased mean diffusivity (MD) was described in the same areas in SCA2, but only in the MCP and cerebellar WM in SCA1. Different ROIs correlated to either MD or FA in each SCA, however, only the MCP correlated with FA and MD in both diseases. In general, changes were more pronounced in SCA2. Another study confirmed the above results in SCA1 and SCA2, but also uncovered differences in MD and FA in the inferior cerebellar peduncles, medial and lateral lemnisci, spinothalamic tracts, and corpus callosum [35]. Group analysis of DTI data using tract-based spatial statistics (TBSS) showed correlation with disease severity in SCA1 and SCA2. Solodkin et al. [36] demonstrated that mean FA levels in the SCP in six SCA1 patients increased with disease duration and inversely correlated with scores on the Scale for the Assessment and Rating of Ataxia (SARA), possibly establishing FA as a marker of disease progression in SCA1. In SCA7 a widespread WM compromise is present, and some symptom evolution may correlate with WM integrity, since there was a significant negative correlation between disease duration and FA values in the callosal body, optic radiations, and corticospinal tract [27].
Magnetic Resonance Spectroscopy (MRS)
Proton MRS is also a valid tool in the evaluation of neurodegenerative ataxias , but due to the different methodologies applied in each study, the small number of patients included and the multiple ROIs chosen, it is difficult to compare and interpret results. A detailed metabolic assessment in SCA1 showed that the strongest biomarkers in separating patients from controls were total N-acetylaspartate (NAA) , myoinositol (mI), glutamate/glutamine (Glx), and total creatine (Cr) in the cerebellar hemispheres and NAA, mI and Glx in the pons. The NAA/mI ratio in both regions presented 100 % specificity and sensitivity [37]. NAA, Cr, mI, and NAA/mI ratio were the best MRS predictors to distinguish between SCA1, SCA2, SCA6, and MSA-cerebellar variant (MSA-C) with at least 90 % accuracy [38]. Both of these studies demonstrate the utility of using metabolites as surrogate end-points in clinical studies.
Contrasting SCA2 to SCA6, NAA/Cr and Cho/Cr were lower in SCA2 than SCA6 using short echo time (TE); and using long TE, NAA/Cr was lower and Cho/Cr higher in SCA2. Lactate peaks were also present in SCA2, but not SCA6. These findings suggest a distinct pattern of cellular degeneration in both SCAs [39]. Another study compared SCA2 with MSA-C and it also demonstrated lactate peaks in SCA2, but not MSA-C [40]. SCA1 and SCA2 patients presented decreased absolute NAA values in the brainstem and cerebellum [31], while another study failed to show statistical difference in NAA/Cr in SCA6 compared to controls [41]. In SCA3, MRS in the deep cerebral WM showed decreased levels of NAA/Cr, suggestive of a more widespread neurodegeneration [42]. Yabe et al. [43] performed [31P]-MRS in the calf muscle of eight male patients with SCA3 and 11 healthy males before, during, and after a 4-minute plantar flexion exercise and demonstrated a reduction in maximum rate of mitochondrial ATP production over the course of 2 years.
Nuclear Imaging
The use of nuclear imaging in ataxia has provided both confirmatory findings to those of MRI in addition to the identification of altered metabolic patterns in presymptomatic individuals and differential metabolic patterns within the SCAs [44–48].
Dopamine transporter imaging using [11C]d-threo-methylphenidate ([11C]dMP) in SCA1, SCA2, SCA3, and SCA6 has revealed reduced striatal [11C]dMP binding potential in SCA2 and SCA3, but not in SCA1 and SCA6. The decrease were similar to those observed in idiopathic Parkinson disease (iPD) . Interestingly, features of parkinsonism have been described in SCA2 and SCA3, even though none of the patients studied presented parkinsonian signs on their neurologic exam [44]. Similar findings were observed in SCA2 subjects, without clear parkinsonism but with dystonia using single photon emission computed tomography (SPECT) to assess the presynaptic dopamine reuptake site with 12β-carboxymethyl-3β-(4-iodophenyl)-tropane (β-CIT) and the postsynaptic dopamine D2 receptors with 123I-iodobenzamide (IBZM) [49]. Both were abnormal in SCA2 demonstrating impaired striatal dopaminergic transmission. In SCA3, impairment of presynaptic dopamine function occurs at an early stage, prior to symptom onset. (99m)Tc-TRODAT-1 brain SPECT used to assess uptake values in bilateral striatal areas in asymptomatic SCA3 gene carriers showed decreased uptake values when compared to the control group [50].
An 18F-deoxyglucose positron emission tomography (FDG) study comparing seven asymptomatic SCA3 patients and controls showed subclinical changes of FDG uptake in the cerebellar hemispheres, brainstem, and occipital, parietal, and temporal cortices in SCA3, suggesting preclinical disease activity [51]. Discriminant function analysis found that cerebellar FDG uptake ratios were able to correctly identify controls and symptomatic SCA3 with a sensitivity and specificity of 100 % and differentiate asymptomatic from symptomatic patients in 14 out of 15 subjects [51].
While considered by most to be clinically a predominant cerebellar syndrome, a study using (99m)Tc-TRODAT-1 SPECT in SCA6 showed a variable degree of striatal dopaminergic impairment. It should be noted, however, that some of the patients included had mild parkinsonism [52]. FDG in SCA6 also showed decreased cerebral glucose utilization in cortical areas and basal ganglia [53].
Friedreich’s Ataxia (FRDA)
Friedreich’s ataxia is the most common autosomal recessive ataxia and is characterized by ataxia, head titubation, distal amyotrophy, and areflexia, Babinski sign, decreased joint position sense and vibratory sensation, cardiac involvement, and diabetes [54]. In most cases it is caused by a homozygous GAA intronic expansion at the frataxin gene (9q13) [54]. Prior to genetic testing becoming widely available, MRI findings provided initial clues to the clinical diagnosis of FRDA due to the major atrophy observed in the cervical spinal cord and a relatively normal cerebellum [55]. However, especially in patients with late-onset FRDA, cerebellar atrophy is not uncommon (Fig. 14.6) [56, 57]. A volumetric study measuring the cross-sectional area of the SCP found a 60 % reduction in the area in FRDA compared to controls. More importantly, SCP cross-sectional area inversely correlated with the Friedreich’s Ataxia Rating Scale scores and disease duration, and directly correlated with the age of onset [58].
Fig. 14.6
a–h Sagittal T1-weighted imaging; i Axial T2-weighted imaging. a Early-onset FRDA 1-year disease duration. b Early-onset FRDA, 10-year disease duration. c Early-onset FRDA, 20-year disease duration. Note a pattern of progressive atrophy of the cerebellum and spinal cord. d AT: evident cerebellar atrophy. e AOA1: striking cerebellar atrophy. f AOA2: clear cerebellar atrophy. g AVED: moderate cerebellar atrophy. h ARSACS: noticeable cerebellar atrophy. i ARSACS: linear bilateral hypointensities in the pons. (With kind permission from Springer Science + Business Media: Neurogenetics (2010) 11:1–12; Anheim M et al.; Fig. 2.)
Although GM atrophy has been concordant in most studies using different neuroimaging techniques (dorsal medulla, cerebellar hemispheres, the rostral vermis, dentate nucleus), WM involvement is discrepant [59–61]. França et al. [59] studied cerebral involvement by means of VBM and reported WM loss in the posterior cingulate gyrus, middle frontal gyrus and paracentral lobule, as well as inferomedial portions of cerebellar hemispheres and rostral vermis, while in another VBM study the WM loss was restricted to the posterior fossa [60]. França et al. corroborated their findings of WM changes with single voxel MRS acquired over the superior–posterior region of the right hemisphere at the level of the corpus callosum. They found a significant reduction of NAA/Cr in FRDA compared to controls. Two studies utilizing DTI confirmed the involvement of the WM in FRDA in areas outside the cerebellum and brainstem, though the particular regions identified were different among the studies [62, 63].
Ataxia Telangiectasia (AT)
Ataxia Telangiectasia is the second most common autosomal recessive ataxia [64]. The onset is usually before age 5, and is characterized by progressive cerebellar ataxia, oculomotor apraxia , teleangiectasia, choreoathetosis, high risk of malignancy, recurrent sinopulmonary infections due to immunoglobulin deficiencies and enhanced sensitivity to ionizing radioactivity [64, 65]. At symptom onset, the MRI may be normal but as disease progresses there is considerable cerebellar atrophy (see Fig. 14.6) [66–68]. Cerebral capillary telangiectasias are best seen on postcontrast T1-weighted images or T2*-weighted gradient-echo images and cases with multiple brain telangiectasias in the brain and brainstem have been identified [69, 70]. There are few neuroimaging studies in AT. In a study using DWI and apparent diffusion coefficient (ADC) maps, authors calculate trace ADC values in 16 ROIs. ADC values of the cerebellar WM and cortex differentiated patients from controls with 100 % certainty. The cut-off ADC value of 0.699 mm2/s in the middle cerebellar cortex yielded 100 % sensitivity and specificity [71]. Contrary to other cerebellar ataxias that usually show reduced NAA levels on MRS, cases with AT show an increase in cerebellar Cho levels, suggesting an ongoing process of cellular degeneration and membrane breakdown [70].
Fragile-X-Associated Tremor/Ataxia Syndrome (FXTAS)
Fragile-X-associated tremor/ataxia syndrome is caused by a CGG expansion (55–200 repeats; premutation range) of the fragile X mental retardation 1 (FMR1) gene. FXTAS is clinically characterized by action tremor, cerebellar ataxia, cognitive and psychiatric symptoms . The primary MRI findings consist of atrophy of the cerebral hemispheres, brainstem, and cerebellum, along with increased T2 signal intensity in the WM of the MCP and the WM surrounding the dentate nuclei (see Fig. 14.2) [72]. Other findings include increased T2 or FLAIR signal in periventricular and deep WM regions of the cerebral hemispheres and corpus callosum [72]. A VBM study compared three groups: symptomatic premutation carriers (PFX+), asymptomatic premutation carriers (PFX−) and controls [73]. When compared to healthy controls, PFX+ had significant GM reduction in mostly the frontal lobes, but also temporal, parietal, and occipital lobes, cerebellum, and thalamus. The bilateral posterior superior/middle temporal gyri also showed increased GM in the PFX+ group. A comparison of PFX+ and PFX− showed GM reductions in the cerebellum, dorsomedial prefrontal cortex, and precuneus in the PFX+ group. Other findings included significant neuroimaging and clinical correlations such as: GM loss in the left amygdala and increased levels of obsessive–compulsiveness and depression; decreased GM in the left inferior frontal cortex and anterior cingulate cortex and poor working memory performance; clinical severity and a reduction of vermal GM [73]. Female patients with FXTAS present a similar pattern of cerebral and cerebellar involvement, though to a lesser degree [74]. Significant WM compromise is also present in FXTAS. Patients with FXTAS showed decreased FA in several WM tracts, mostly the MCP, SCP, cerebral peduncle, fornix, and stria terminalis. Axial and radial diffusivities were increased in the MCP of asymptomatic premutation carriers [75].
Prefrontal cortex impairment seems to be responsible for the cognitive dysfunction in FXTAS. Functional MRI (fMRI) performed during a verbal working memory task in symptomatic and asymptomatic carriers exhibited reduced activation in the right ventral inferior frontal cortex and left premotor/dorsal inferior frontal cortex when compared to controls. Symptomatic carriers showed decreased activation of the right premotor/dorsal inferior frontal cortex. There was also a negative correlation between the right ventral inferior frontal cortex activity and the levels of FMR1 mRNA after excluding the effect of disease severity [76].
Autosomal Recessive Spastic Ataxia of Charlevoix–Saguenay (ARSACS)
Autosomal Recessive Spastic Ataxia of Charlevoix–Saguenay is a neurodegenerative disease that encompasses early onset spasticity, cerebellar ataxia, distal amyotrophy, peripheral neuropathy, skeletal deformities, and retinal hypermyelination [65]. It is caused by mutations in the SACS gene. MRI shows early atrophy of the superior vermis and progressive atrophy of the cerebellar hemispheres and the spinal cord (see Fig. 14.6) [66]. A linear hypointensity on T2-weighted images and FLAIR may be present in the pons [66, 77]. This area has been shown to be the pontocerebellar fibers, using diffusion tensor color encoded MRI maps, whereas the pyramidal tracts were thin and not in their usual location [78]. Recently, hypointense lesions in the MCP were described in T2-weighted and FLAIR images [79].
Other Autosomal Recessive Ataxias
Multiple Systems Atrophy
Multisystem Atrophy is a neurodegenerative disease clinically characterized by a variable combination of autonomic, cerebellar, parkinsonian, and pyramidal signs [81]. The distinctive neuropathological feature is glial cytoplasmic inclusions in oligodendroglial cells [1]. Clinically, MSA is usually divided in two subtypes: one with a predominant parkinsonism (MSA-P) and another with predominant cerebellar findings (MSA-C). Routine MRI is the most important diagnostic test in MSA and the introduction of different sequences and imaging analyses have improved the diagnosis and may lead to potential surrogate biomarkers [81]. Most imaging studies of MSA typically focus on differentiating the various atypical parkinsonisms from idiopathic PD [82–88]. Since this is beyond the scope of this chapter, we will concentrate on MSA-C.
The most common MRI findings are a hyperintense rim at the lateral edge of the dorsolateral putamen and the “hot cross bun” sign (see Fig. 14.3) [1, 89]. However, the latter has been described in other ataxias, including SCA2, SCA3, SCA7, and SCA8 [90, 91]. Significant infratentorial atrophy is also noted.
Studies comparing MSA-P to MSA-C have demonstrated a similar pattern of cerebral compromise, however, with a differential degree of atrophy within the involved areas [92–95]. A VBM and voxel-based relaxometry study comparing MSA-C and MSA-P showed differences only in the infratentorial ROIs, which were more severe in MSA-C than in MSA-P [92]. Conversely, comparing to controls, Wang et al. [94] found an increase in ADC values in the MCP and cerebellum; a reduction in FA in the pyramidal tract, MCP, and WM of the cerebellum in both MSA-C and MSA-P. This confirmed a previous study that found increased ADC values at the MCP and pons in MSA-C [96]. In addition, isotropic diffusion-weighted image (DWI) values were decreased in the cerebellar cortex and deep cerebellar nuclei in MSA-C and increased in the basal ganglia in MSA-P [94]. Pellecchia et al. [93] used DWI images and measured the diffusion Trace(D) brain maps. They demonstrated that in MSA-P Trace(D) values were significantly increased in the putamen, while in MSA-C Trace(D) values were significantly higher in the cerebellar WM and MCP.
< div class='tao-gold-member'>
Only gold members can continue reading. Log In or Register to continue
Related posts:
 Neuroimaging in Essential Tremor
 Diffusion Magnetic Resonance Imaging and Its Applications in Movement Disorders
 Imaging in Huntington’s Disease and Other Choreas
 Neuroimaging of Dystonia
 Functional MRI in Idiopathic Parkinson Disease and Parkinsonism
 Structural MRI in Idiopathic Parkinson Disease and Parkinsonism
Stay updated, free articles. Join our Telegram channel

Full access? Get Clinical Tree


