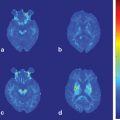
Fig. 13.1
Metabolic network abnormalities in early Huntington’s disease, and [18F]-FDG PET study [79]
Using [11C]-PK11195 and raclopride PET in ten premanifest and nine symptomatic HD gene carriers, decreased raclopride binding and increased PK binding was observed for both groups in the hypothalamus, implicating the hypothalamus in disorders of weight maintenance, circadian rhythms, and behavior seen in HD [82].
In a study using magnetic resonance (MR) and PET ([11C]-PK11195 and raclopride), reduced D2 and D3 binding was observed in sensorimotor striatum, associative striatum, stria terminalis bed nucleus, amygdala, and hypothalamus in asymptomatic carriers, with further reductions in symptomatic subjects for the SN, globus pallidus, limbic striatum, cingulate, and insula [83]. Microglial activation was increased in areas of premanifest carriers in a similar distribution to reduced dopamine receptor binding, whereas symptomatic subjects also had activated microglia in the globus pallidus, limbic striatum, and anterior prefrontal cortex. Activated microglia in the striatum and regions associated with cognition correlated to sooner predicted onset, raising the possibility that microglia activation may be a biomarker of use in conjunction with early cognitive assessment.
Pavese et al. [84] used raclopride to demonstrate decreased cortical binding in 62.5 % of symptomatic HD subjects and 54.5 % of premanifest carriers, particularly in the temporal and frontal areas. Symptomatic HD subjects with reductions in binding fared worse on executive function and attention testing than those with normal cortical binding. Conversely, D2 receptor binding as assayed by [11C] FLB 457 was not significantly altered compared with controls in the thalamus and cortex of early-to-middle-stage HD subjects in a PET study by Esmaeilzadeh et al. [85], whereas the striatum was reduced as expected.
Single Photon Emission Computed Tomography
Single photon emission computed tomography (SPECT) allows the combination of a radiotracer and ligand to be localized to a region relevant to the chosen ligand [44]. The gamma-emitting tracer 99-technetium hexamethylpropylene amineoxime (99-Tc HMPAO) is absorbed by cerebral tissues in a perfusion-dependent fashion, allowing ascertainment of regional blood flow. SPECT demonstrated the greatest reduction in blood flow compared with controls in the caudate, which was affected in this regard more than the putamen despite greater volume loss in putaminal regions [86]. In 10 of 29 total subjects with symptomatic HD less than 6 years, SPECT revealed reduction of cortical perfusion without atrophy on MRI, with overall cortical perfusion correlating to functional abilities and disease duration [87]. For all subjects, prefrontal blood flow was closely related to cognitive performance and motor cortical areas likewise demonstrated a relationship to movement disability and functional activities of daily living scores. Perfusion to the basal ganglia was significantly reduced in all subjects. Leslie et al. [88] used [123I] epidepride to examine 21 presymptomatic to severe subjects, noting that striatum/occiput and striatum/whole-brain uptake ratios suggested reduction of uptake in moderate and severe disease but not in asymptomatic or early HD. In seven HD subjects asked to solve mazes, blood flow was increased in all areas except the caudate, with reductions during activity compared with rest in the striatum and in the orbital cortex in particular [89]. Gamez et al. [90] used [123I] FP-CIT, the ligand selective for the presynaptic dopamine transporter used in the DAT scan for Parkinson’s disease, and observed semiquantitative reduction in 4 of 12 HD subjects, primarily in the putamen. More substantial reductions in ligand uptake correlated to worse UHDRS scores.
Ultrasonography
Ultrasonography involves the transmission of sound waves through a chosen area, which are then analyzed on the basis of their rate and intensity of return to indicate the relative density of structures in question. In a cohort of 45 HD patients, 18 had hyperechogenicity in at least one basal ganglia region, with 12 having changes in the SN, 6 in the caudate head, and 3 in the lentiform nucleus [91]. CAG length and clinical performance correlated with hyperechogenicity in the SN (SN+). Deckel and Cohen [92] used transcranial Doppler ultrasonography in nine gene-positive subjects to assess blood flow velocity during cognitive tasks, finding increased flow in the anterior cerebral artery distribution but not in the middle cerebral artery during out loud verbal fluency tests compared with controls. Blood flow in the anterior cerebral artery (ACA) distribution was able to predict control versus mild or moderate HD. It is not yet established if ultrasound will be a useful biomarker for therapeutic trials.
Imaging in Other Disorders with Prominent Chorea
Chorea-acanthocytosis
Chorea-acanthocytosis (ChAc), or neuroacanthocytosis , is one of several clinically related syndromes characterized by abnormal erythrocytes (acanthocytes) and multiple movement disorders , notably chorea [93]. Other clinical features include lip/tongue biting, tics, dysarthria and dysphagia, amyotrophy, neuropathy, and parkinsonism . As the second most common hereditary choreiform disorder, it is important for the differential diagnosis for the movement disorder clinician evaluating chorea. In a case report of a patient originally thought to have HD, CT scanning revealed caudate atrophy, underscoring the radiographic similarity between the two conditions [94]. Other authors also report misdiagnosis, with reference to caudate atrophy on MRI and chorea prompting diagnosis of HD [95]. Neuroacanthocytosis has been misdiagnosed as schizophrenia and Tourette’s syndrome in a pair of monozygotic twins, who demonstrated caudate atrophy and reduced PET glucose uptake in the striatum, particularly on the right [96]. Striatal dopamine and hypothalamic serotonin binding on SPECT was similar to controls. In 13 subjects with ChAc, substantial reduction in MRI volume was observed in the putamen and particularly the caudate in a dorsal/ventral gradient [97]. These changes had no relationship to duration of illness, suggesting that they may precede expression of phenotype. In a PET/MRI evaluation of three ChAc patients, PET demonstrated reduced blood flow and oxygen metabolism in the putamen and caudate relative to controls, with mild reductions in blood flow also noted in the bilateral frontal, left temporal, left parietal, and bilateral thalamic regions [98]. The frontal and temporal lobes demonstrated reductions in oxygenation, whereas MR demonstrated increased signal intensity on T2 in the caudate and putamen with corresponding decreased signal on T1. Cortical atrophy on MRI in ChAc has been described, as has white matter signal increase on T2 images in cerebral periventricular areas, lentiform nuclei, thalamus, cerebral peduncles, and corpus callosum [99]. A report of two ChAc siblings detailed striatal changes as in other literature and cerebellar atrophy [100]. On susceptibility-weighted imaging, an MRI sequence that can highlight iron deposition, abnormal dark paramagnetic signal was observed in the bilateral striatum, with striped regions in the lateral pallidum that were not present on gradient-echo sequences [101]. The role of iron metabolism dysfunction in this setting is currently unclear.
Wilson’s Disease
Wilson’s disease (WD) is an autosomal-recessive disorder of copper metabolism due to a defect in the copper-transporting ATPase ATP7B, with resultant failure to excrete copper [93]. Copper accumulates in the blood and overwhelms excretion capacity, eventually depositing in the liver, kidney, bones, and brain with progressive dysfunction. WD has been associated with a wide variety of abnormal movements, including chorea, dystonia, myoclonus, tremor, and parkinsonism [102, 103]. In a report on 45 WD cases, chorea was noted in 13.3 % of subjects [104].
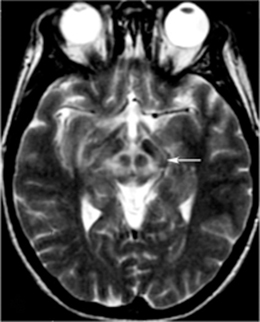
Early reports using MRI showed T1/T2 hypointensity in the lentiform nuclei and T1 hypointensity in the thalamus with cerebral atrophy [105], as well as the “face of the panda” sign, characterized by high signal in the tegmentum save for the red nucleus (Fig. 13.2) [106–108]. In particular, the putamen appears to be frequently abnormal in WD, with numerous reports describing abnormalities [109, 110]. Prayer et al. [111] saw MRI findings in 22 of 38 subjects, reporting T2 hyperintensity in caudate, thalamic, and lenticular nuclei as well as brain stem regions and white matter, although little was seen on T1 imaging. Hydrocephalus ex vacuo was also noted, with no correlation between severity of MR abnormalities and clinical severity. In an evaluation of 25 WD patients, MR was abnormal in 22, with lesions most frequently in the putamen (86 %) [112]. Other affected gray matter areas included the thalamus (54 %), caudate (45 %), and pallidum (41 %), especially the outer rim of the putamen and ventral thalamic nuclei. Lesions were widespread in the brain stem and also seen in the tectum, tegmentum, SN, red nuclei, pons, and superior/middle cerebellar peduncles. Notably, atrophy was observed in a majority of patients (82 %), with substantial cortical white matter changes (59 %). Severity of signal intensity change correlated to total duration of disease and length of untreated disease. In a study of 100 WD patients, 93 of whom were symptomatic, atrophy in the cerebrum (70 %), cerebellum (52 %), and brain stem (66 %) was notable, with signal changes most commonly in the putamen followed by the caudate, thalamus, midbrain, pons, cerebral white matter, cortex, medulla, and cerebellum [113]. Observed also were pallidal hypointensity (34 %), “face of the panda” sign (12 %), T1 hyperintensity (6 %), central pontine myelinosis (7 %), and claustral hyperintensity (4 %). Midbrain diameter in symptomatic WD is significantly reduced compared with controls and WD subjects without neurological symptoms [114]. White matter abnormalities have been described in numerous areas, notably in the corticospinal tracts, dentatorubrothalamic tracts, and pontocerebellar tracts have been described [115, 116]. Aikath et al. [117] reported a genetically confirmed WD subject with diffuse white matter disease and resistance to pharmacotherapy. A 12-year-old WD subject demonstrated significant improvement in white matter changes while treated and imaged over a 5-year period [118]. In a study of 81 patients, 42 % had white matter changes on FLAIR, with almost one-quarter with corpus callosal lesions in the splenium [119]. In an MRI analysis of 56 WD patients compared with 44 relatively young subjects with extrapyramidal disorders (including HD), the most typical findings were tectal plate and pontine hyperintensities (75 and 62.5 %), collective basal ganglia, thalamus, and brainstem signal change (55.3 %), and the “panda” sign (14.3 %) [120].
Of note, treatment appears to have some effect on imaging in WD. MR abnormalities before and after initiation of penicilliamine chelation therapy have been compared, with reduction in hyperintensities of the thalamus, brainstem, and basal ganglia over 5–24 months reported by Roh et al. [121]. Neurological symptoms also improved, although brain atrophy, when present, was unchanged by treatment over this interval. Penicillamine treatment also improves D2 receptor binding on [11C] raclopride PET and [123I] iodobenzamide SPECT in the caudate and putamen, corresponding to T2 hyperintensity improvement on MR in these regions observed over an initial 4-month treatment period [122]. Others have reported clinical improvement in tremor after penicillamine treatment with corresponding reduction in lesion burden in thalamic and red nuclear regions [123]. A study of 18 neurological WD subjects comparing longitudinal MR changes for penicillamine and zinc treatment groups showed a tendency toward radiographic worsening over time in the zinc group without clinical correlate, with no clinical difference over time between the two groups [124]. Follow-up PET after treatment in three patients revealed improved glucose utilization in two and increased striatal D2 receptor binding in three patients, correlating to clinical improvement. As such, there is evidence that WD has a dynamic phase in which functional and radiographic improvement can be identified after treatment. However, reports of clinical decompensation after initiation of penicillamine treatment also exist, given its ability to transiently increase exposure of tissues to copper. Huang and Chu [125] reported a 28-year-old subject who developed parkinsonism and dystonia after treatment for 2 weeks, with corresponding development of T2 hyperintensities in the thalamus, basal ganglia, pons, and midbrain. Slow clinical and radiographic improvement followed after change to zinc therapy. A 20-year-old patient demonstrated improvement on FGD PET measures in the striatum and cortex with accompanying clinical improvement over 14 months after initiation of chelation therapy [126]. Liver transplant, the definitive treatment for WD, elicited improvement in ataxia and tremor over several months, with T2 hyperintensities in the thalami and red nuclei regressing as well [127].
Other Imaging Modalities in WD
Severity of neurological disease correlated to striatal glucose consumption on PET as well as MR abnormalities in 18 WD subjects, although no relationship was found with D2 receptor binding [128]. β-CIT SPECT has shown significant loss of dopamine transporter binding in the striatum, suggestive of presynaptic nigrostriatal damage [129]. MRS demonstrated no differences in NAA/Cho, NAA/Cr, and Cho/CR ratios in comparing WD with controls [130]. SPECT demonstrated perfusion reduction in superior frontal, prefrontal, parietal, and occipital cortices as well as the caudate and putamen for 19 of 25 WD subjects, 12 of whom had neurological symptoms; 10 of those with neurological symptoms had abnormal SPECT scans [131]. MRS in 12 heterozygous carriers, three of whom had low ceruloplasmin and one with low serum copper, showed higher Glx/Cr and Lip/Cr ratios in the pallidum and thalamus compared with controls, leading to speculation that heterozygotes may accumulate copper [132]. In a SPECT study of the globus pallidus, NAA/Cr ratios seen as low before treatment increased significantly after 1 year of treatment [133].
Diffusion-weighted MRI over 18 months demonstrated a change from restricted diffusion to elevated diffusion in the putamen and caudate, suggestive of a progression from cytotoxic edema to necrosis and demyelination [134]. A case involving sudden onset of right-sided hemichorea revealed hyperintense lesions in the striatum, thalamus, and midbrain bilaterally, with DWI-positive lesions in the subthalamic nuclei bilaterally, more so on the left, with slightly increased apparent diffusion coefficient (ADC) values [135]. After 2 years of treatment, elevated DWI signals largely disappeared. Decreases in diffusion signal in the putamen have been detected in WD subjects without T2 lesions or neurological symptoms, with substantial increases once symptoms emerge in the putamen, pallidum, and subcortical white matter corresponding to new lesions on T2 [136]. ADC signal was noted as high in the putamen, pallidum, white matter, and mesencephalon in symptomatic but not asymptomatic subjects, where some without neurological deficits in fact had decreased ADC signal. More substantial diffusion signal correlated to symptom severity. Similar to DWI, ADC values in the literature have been observed to be variable, suggesting the disease trajectory may involve multiple pathogenic mechanisms over time [137].
Transcranial sonography demonstrated lenticular hyperechogenicity in symptomatic and asymptomatic subjects, with the area of change correlating to clinical severity [138]. Thalamic hyperechogenicity, lateral ventrical width, and third ventricle width also correlated to intensity of symptoms. Hyperechogenicity of the SN noted in 10 of 21 WD subjects did not correlate to disease severity. Only 12 of 19 subjects with lenticular hyperechogenicity had corresponding lesions on MRI. Oder et al.[139] correlated MR findings and clinical features, observing associations between parkinsonism /cognitive impairment and dilation of the third ventricle, ataxia/tremor with thalamic lesions, and chorea/dyskinesia, dysarthria, and personality disturbances with lesions in the putamen and pallidum.
Conclusions and Future Directions
Recent advances in imaging have clarified regional changes in choreic disorders, notably symptomatic and presymptomatic HD, with promise to further demarcate stages of the disease and its evolution over time. For HD, anatomic changes as well as functional alterations have become clearer, though limitations in knowledge regarding specific molecular mechanisms of HD pathogenesis currently represent a major challenge for future advances. The ability to identify sensitive and specific molecular signatures for successive stages of HD, if in fact stages of progression involve variations in the function or quantity of certain biomolecules, would represent a major advance in tracking the disease. Moreover, knowledge and quantification/localization of such biomarkers would likely boost design and development of therapeutic agents tailored for different disease stages or specific molecular defects. Going forward, future clinical trials will likely draw on these increasingly sophisticated imaging modalities to measure efficacy of interventions, representing yet another dimension to the revolutionary role imaging has already started to play in our understanding of neurodegenerative disorders.
References
1.
Terrence CF, Delaney JF, Alberts MC. Computed tomography for Huntington’s disease. Neuroradiology. 1977;13(4):173–5.PubMed
2.
Stober T, Wussow W, Schimrigk K. Bicaudate diameter—the most specific and simple CT parameter in the diagnosis of Huntington’s disease. Neuroradiology. 1984;26(1):25–8.PubMed
3.
Sharma P, Savy L, Britton J, Taylor R, Howick A, Patton M. Huntington’s disease: a molecular genetic and CT comparison. J Neurol Neurosurg Psychiatry. 1996;60(2):206–8.PubMed
4.
Culjkovic B, Stojkovic O, Vojvodic N, Svetel M, Rakic L, Romac S, Kostic V. Correlation between triplet repeat expansion and computed tomography measures of caudate nuclei atrophy in Huntington’s disease. J Neurol. 1999;246(11):1090–3.PubMed
5.
Aylward EH, LI Q, Stine OC, Ranan N, Sherr M, Barta PE, Bylsma FW, Pearlson GD, Ross CA. Longitudinal change in basal ganglia volume in patients with Huntington’s disease. Neurology. 1997;48(2):394–9.PubMed
6.
Rosas HD, Goodman J, Chen YI, Jenkins BG, Kennedy DN, Makris N, Patti M, Seidman LJ, Beal MF, Koroshetz WJ. Striatal volume loss in HD as measured by MRI and the influence of CAG repeat. Neurology. 2001;57(6):1025–8.PubMed
7.
Backman L, Robins-Wahlin TB, Lundin A, Ginovart N, Farde L. Cognitive deficits in Huntington’s disease are predicted by dopaminergic PET markers and brain volumes. Brain. 1997;120(Pt 12):2207–17.PubMed
8.
Aylward EH, Anderson NB, Bylsma FW, Wagster MV, Barta PE, Sherr M, Feeney J, Davis A, Rosenblatt A, Pearlson GD, Ross CA. Frontal lobe volume in patients with Huntington’s disease. Neurology. 1998;50(1):252–8.PubMed
10.
Kassubek J, Juengling FD, Kioschies T, Henkel K, Karitzky J, Kramer B, Ecker D, Andrich J, Saft C, Kraus P, Aschoff AJ, Ludolph AC, Landwehrmeyer GB. Topography of cerebral atrophy in early Huntington’s disease: a voxel-based morphometric study. J Neurol Neurosurg Psychiatry. 2004;75(2):213–20.PubMed
11.
Kassubek J, Landwehrmeyer GB, Ecker D, Juengling FD, Muche R, Schuller S, Weindl A, Peinemann A. Global cerebral atrophy in early stages of Huntington’s disease; quantitative MRI study. Neuroreport. 2004;15(2):363–5.PubMed
12.
Douaud G, Guara V, Ribiero MJ, Lethimonnier F, Maroy R, Verny C, Krystkowiak P, Damier P, Bachoud-Levi AC, Hantraye P, Remy P. Distribution of grey matter atrophy in Huntington disease patients: a combined ROI-based and voxel-based morphometric based study. Neuroimage. 2006;32(4):1562–75.PubMed
13.
Ruocco HH, Bonilha L, Li LM, Lopes-Cendes I, Cendes F. Longitudinal Analysis of regional grey matter loss in Huntington’s disease: effects of the length of the expanded CAG repeat. J Neurol Neurosurg Psychiatry. 2008;79(2):130–5.PubMed
14.
Rosas HD, Salat DH, Lee SY, Zaleta AK, Pappu V, Fischl B, Greve D, Hevelone N, Hersch SM. Cerebral cortex and the clinical expression of Huntington’s disease; complexity and heterogeneity. Brain. 2008;131(Pt 4):1057–68.PubMed
15.
Fennema-Notestine C, Archibald SL, Jacobson MW, Corey-Bloom J, Paulsen JS, Peavy GM, Gamst AC, Hamilton JM, Salmon DP, Jernigan TL. In vivo evidence of cerebellar atrophy and cerebral white matter loss in Huntington’s disease. Neurology. 2004;63(6):989–95.PubMed
16.
Kassubek J, Juengling FD, Ecker D, Landwehrmeyer GB. Thalamic atrophy in Huntington’s disease co-varies with cognitive performance: a morphometric MRI analysis. Cereb Cortex. 2005;15(6):846–53.PubMed
17.
Thieben MJ, Duggins AJ, Good CD, Gomes L, Mahant N, Richards F, McCusker E, Frackowiak RS. The distribution of structural neuropathology in preclinical Huntington’s disease. Brain. 2002;125(Pt 8):1815–28.PubMed
18.
Ciarmiello A, Cannella M, Lastoria S, Simonelli M, Frati L, Rubinsztein DC, Squiteri F. Brain white-matter volume loss and glucose hypometabolism precede the clinical symptoms of Huntington’s disease. J Nucl Med. 2006;47(2):215–22.PubMed
19.
Jurgens CK, van de Wiel L, van Es AC, Grimbergen YM, Witjes-Ane MN, van der Grond J, Middelkoop HA, Roos RA. Basal ganglia volume and clinical correlates in ‘preclinical’ Huntington’s disease. Neurology. 2008;255(11):1785–91.
20.
Henley SM, Wild EJ, Hobbs NZ, Frost C, MacManus DG, Barker RA, Fox NC, Tabrizi SJ. Whole-brain atrophy as a measure of progression in premanifest and early Huntington’s disease. Mov Disord. 2009;24(6):932–6.PubMed
< div class='tao-gold-member'>
Only gold members can continue reading. Log In or Register to continue
Related posts:

Stay updated, free articles. Join our Telegram channel

Full access? Get Clinical Tree


