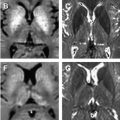
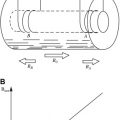
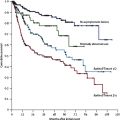
This article provides an overview of relaxation times and their application to normal brain and brain and cord affected by multiple sclerosis. The goal is to provide readers with an intuitive understanding of what influences relaxation times, how relaxation times can be accurately measured, and how they provide specific information about the pathology of MS. The article summarizes significant results from relaxation time studies in the normal human brain and cord and from people who have multiple sclerosis. It also reports on studies that have compared relaxation time results with results from other MR techniques.
Overview
Relaxation is arguably the most important concept in MRI because it is the basis of and provides most of the contrast visible on conventional MRI, which plays a key role in the diagnosis and management of multiple sclerosis (MS). Many investigators have attempted to measure relaxation times in MS with the goal of obtaining more specific and accurate information about the disease. Although there has been significant progress in this area, relaxation time measurement is not yet a widely used tool for the investigation of MS pathology. Recent results suggest that relaxation time measurements can provide specific information about MS that cannot be obtained by other in vivo techniques.
This article provides an overview of relaxation times and their application to normal and MS brain and cord. The goal is to provide readers with an intuitive understanding of what influences relaxation times, how relaxation times can be accurately measured, and how they provide specific information about the pathology of MS. The article is organized into six sections. First, three relaxation times—T1, T2, and T2∗—are introduced, initially in the context of their behavior in simple water solutions and subsequently in central nervous system (CNS) tissue, where MR relaxation is much more complicated. The next section covers methods for accurate measurement and analysis of relaxation times in brain, highlighting the fact that CNS tissue is inhomogeneous and that this inhomogeneity can be planned for in the methodology. The article summarizes significant results from relaxation time studies in the normal human brain and cord and from people who have MS. Finally the article reports on studies that have compared relaxation time results with results from other MR techniques, including diffusion tensor imaging (DTI) and magnetization transfer imaging.
Although this article focuses primarily on T1, T2, and T2∗ relaxation times, susceptibility-weighted imaging (SWI), a T2∗ weighted technique is discussed. This article does not cover all relaxation time measurements (eg, T1ρ and T2ρ) because few MS studies have used these measurements.
T1, T2, and T2∗ relaxation times
Nuclear Magnetic Resonance
The phenomenon of nuclear magnetic resonance (NMR) enables us to obtain exquisite images from hydrogen nuclei in the brain. Hydrogen nuclei, or protons, from tissue behave like tiny magnets when placed in the magnetic field of an MRI scanner. In equilibrium, more protons are aligned parallel to the field than anti-parallel to the field, which results in a net magnetization vector along the magnetic field. If the net magnetization vector of the protons is tilted away from the MRI scanner field direction, it precesses about the direction of the magnetic field (like a top or gyroscope) at the resonance frequency, or Larmor frequency, ω o . ω o , which is determined by the Larmor equation, ω o = γB, where γ , the gyromagnetic ratio, depends on the nucleus and B is the magnetic field. For a 1.5-T magnet, the Larmor frequency for protons is 64 MHz. The magnetization vector is tilted out of equilibrium by applying external magnetic fields that oscillate at the Larmor frequency. The precessing magnetization produces a signal that can be picked up by a receiver coil and is used to create the MR image. The return of the net magnetization vector of the protons back to equilibrium is characterized by relaxation times T1, T2, and T2∗.
Relaxation Times
T1, the spin–lattice relaxation time (or longitudinal relaxation time), characterizes the return of the magnetization vector to align along the magnetic field direction. T2, the spin–spin relaxation time (or transverse relaxation time), describes the irreversible decay of the MR signal in the transverse plane, whereas T2∗ characterizes the actual measured decay of the MR signal. The T1 process involves an exchange of energy between the protons and the rest of the sample, or lattice, whereas T2 processes conserve energy. The next section provides a mechanistic description of T1 and T2 processes; readers who prefer a more intuitive picture of relaxation in tissue may skip to the following section.
T1 and T2 Processes
For a simple spin system consisting of a molecule with a single proton site, T1 and T2 are understood quantitatively in terms of fluctuating magnetic fields produced by adjacent protons undergoing molecular motions. Recall that protons behave like small magnets. When protons are located on molecules that reorient rapidly because of molecular tumbling and translational diffusion, they produce oscillating magnetic fields. Molecular motions, which are driven by the inherent kinetic energy of the molecules, are characterized by a correlation time, τ c , the time required for the molecule to undergo reorientation. The fluctuating magnetic fields caused by these molecular motions cause relaxation. The dependence of T1 and T2 on the correlation time of molecular motions and Larmor frequency is quantitatively expressed in equations 1 and 2 . The constant, K, is related to the strength of the interactions between adjacent protons.
1 T 1 = K ( τ c 1 + ( ω o τ c ) 2 + 4 τ c 1 + ( 2 ω o τ c ) 2 )
1 T 2 = K ( 3 2 τ c + 5 / 2 τ c 1 + ( ω o τ c ) 2 + τ c 1 + ( 2 ω o τ c ) 2 )
Stay updated, free articles. Join our Telegram channel

Full access? Get Clinical Tree


