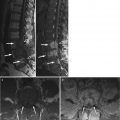
Fig. 9.1
Fatty marrow conversion after radiotherapy.
Sagittal T1-weighted image (a) of the lumbosacral spine of a 68-year-old man with a history of radiation therapy to the pelvis for prostate cancer shows typical hyperintense fatty marrow in the sacrum and L5, conforming to the radiation portals. Low signal intensity of the rest of the spine is due to red marrow regeneration after chemotherapy. On the STIR image (b), radiated fatty marrow is hypointense to red marrow. On the out-of-phase image (c), there is no signal dropout of the irradiated fatty marrow, whereas red marrow in the rest of the spine shows significant signal loss. The in-phase image (d) is shown for comparison
With lower radiation doses (usually lower than 3,600 cGy), red marrow regeneration may occur within the radiation field [9]. This red marrow reconversion has been reported to occur from under a year to up to 23 years after treatment [3, 7, 9, 10]. Hematopoietic marrow reconversion in the irradiated spine often occurs in a band-like pattern, with red marrow appearing in the periphery of the vertebral bodies. This band-like pattern of reconversion is more frequently observed in children than in adults [3, 10].
Key Points
Effect of radiation therapy on normal bone marrow
Cellular death occurs within days after initiation of therapy
Fatty marrow appears within 2 weeks and is strictly limited to the radiation portals
Red marrow reconversion occurs with doses lower than 3,600 cGy, months to many years after radiation therapy
9.2.2 Effect of Chemotherapy and Hematopoietic Growth Factors
The first few days after initiation of chemotherapy, bone marrow becomes necrotic and edematous, and its signal intensity on T1-weighted images drops; on STIR images, the marrow signal intensity increases, and on DCE-MRI, there is decreased bone marrow perfusion. These changes are followed by a short period of fatty marrow conversion. Three to four weeks into treatment, T1 signal intensity of the bone marrow drops again, as red marrow reappears in the central skeleton during the phase of hematopoietic recovery [11] (Fig. 9.2).
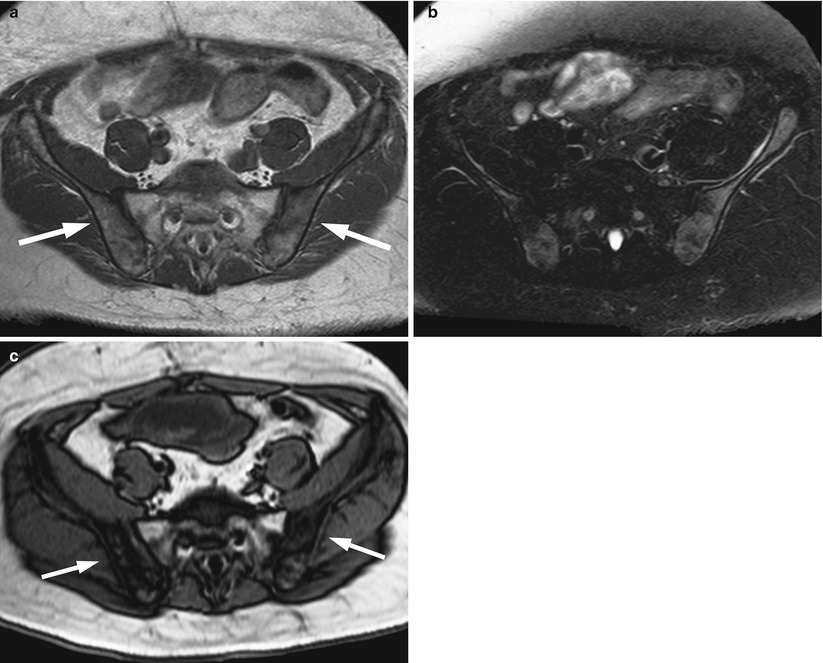
Fig. 9.2
Red marrow reconversion following chemotherapy.
Axial T1-weighted image (a) of the pelvis of a 41-year-old man with rectal cancer treated with chemoradiotherapy shows low-intensity marrow in the iliac bones (arrows). Fatty marrow is present in the irradiated sacrum. On the T2 fat-suppressed image (b), the marrow of the iliac bones appears hyperintense. The out-of-phase image (c) shows significant signal loss in the iliac bones consistent with red marrow reconversion
Granulocyte colony-stimulating factor (G-CSF), granulocyte macrophage colony-stimulating factor (GM-CSF), and erythropoietin are hematopoietic growth factors, increasingly used as an adjunct to chemotherapy treatment for various malignancies. G-CSF and GM-CSF induce proliferation and dedifferentiation of neutrophil precursor cells and enhance the function of mature granulocytes. This reduces the degree of chemotherapy-induced neutropenia and the number of related febrile episodes, leading to increased tolerance to high-dose chemotherapy and shorter hospitalization times [12]. Erythropoietin stimulates red blood cell production and is used to treat anemia related to various conditions including chemotherapy.
There have been several reports on the MRI appearance of bone marrow after administration of hematopoietic growth factors both in cancer patients and in healthy peripheral stem cell donors [13–17]. In a study of patients with musculoskeletal malignancies receiving chemotherapy with G-CSF, 40 % showed MRI changes consistent with red marrow reconversion [17]. Red marrow reconversion occurs about 2 weeks after the start of the first course of G-CSF, and it follows a sharp increase in the levels of neutrophils. It is most often observed in the pelvis and proximal femora, which are the last sites to undergo physiologic age-related red to yellow marrow conversion [13, 17].
Red marrow reconversion related to the administration of hematopoietic growth factors most often manifests with a diffuse rather than a focal MRI pattern (Fig. 9.3). On T1-weighted images, both patterns of red marrow reconversion may be quite similar in appearance to those of malignant marrow disease. Knowledge of the sites where these physiologic changes are expected to appear and the fact that they are symmetric aids the differential diagnosis of regenerating red marrow versus malignant marrow. Review of different pulse sequences in combination is very helpful for an accurate diagnosis. Chemical-shift and contrast-enhanced images especially should be carefully assessed; a rule of thumb is that normal red marrow shows more than 20 % signal dropout on out-of-phase images and less than 40 % increase in signal intensity on post-contrast T1-weighted images. FDG-PET imaging in patients who are receiving growth factors may show marrow uptake similar to that caused by bone marrow malignancies; however, several studies have shown that, in most patients, bone marrow metabolic activity returns to normal 1 month after discontinuation of G-CSF treatment [18].
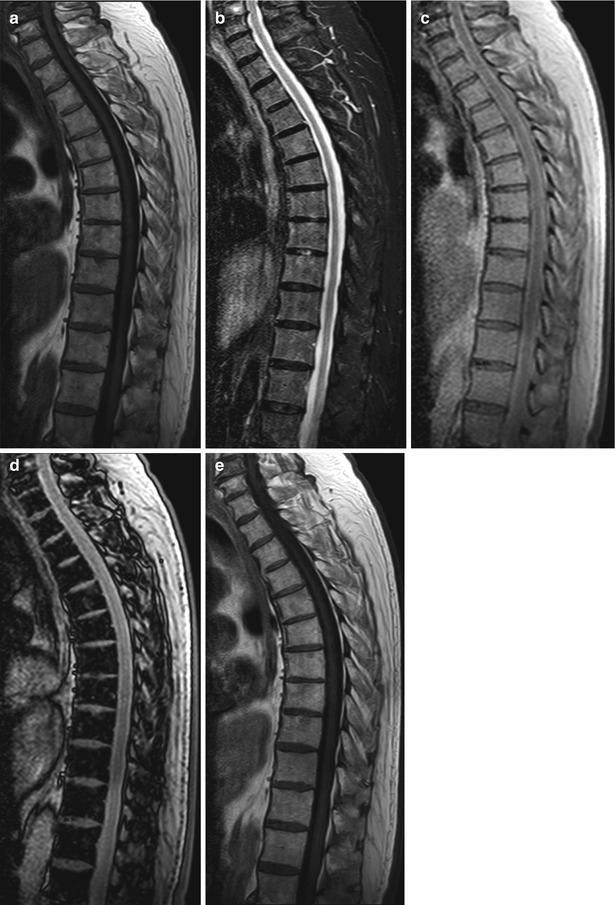
Fig. 9.3
Effect of hematopoietic growth factors on bone marrow.
MR images of the thoracic spine of a 79-year-old man with colon cancer and red marrow reconversion after the administration of hematopoietic growth factors (granulocyte colony-stimulating factor and erythropoietin). Sagittal T1-weighted image (a) shows low for age signal intensity of the bone marrow. No significant hyperintensity is noted on the STIR image (b). Compared to the in-phase image (c), the out-of-phase image (d) shows marked drop of marrow signal intensity. On the post-contrast T1-weighted image (e), there is very mild marrow enhancement. The findings are consistent with red marrow reconversion
Key Points
Effect of hematopoietic growth factors on normal bone marrow
Administration of growth factors causes red marrow reconversion as early as 2 weeks after initiation of treatment
A diffuse rather than focal pattern of red marrow reconversion is more frequent in patients receiving growth factors
Chemical-shift and contrast-enhanced images should be carefully reviewed to exclude a malignant bone marrow pattern
9.2.3 Bone Marrow Transplantation
In the immediate period after bone marrow transplantation (BMT), edema of the bone marrow is observed on MR images (diffuse low T1/high T2 signal). Within 3 months, a characteristic band-like pattern is seen on T1-weighted images of the spine, consisting of a peripheral zone (i.e., along the vertebral endplates) of low-signal-intensity red marrow surrounding a central area of high-signal-intensity fatty marrow [19]. The band-like pattern of red and fatty marrow distribution may be explained by the perfusion of the vertebral bodies. The terminal ramifications of the nutrient artery form a network of capillaries beneath the vertebral endplates; therefore, because of increased vascularity, repopulation of the bone marrow after transplantation is more pronounced in the periphery rather than in the center of the vertebral body. The band-like pattern may persist for months before it converts to a normal adult bone marrow pattern; T1 signal intensity of the bone marrow of transplant patients remains somewhat higher compared to matched-for-age controls, even years after BMT [20, 21].
Key Points
MRI appearance of bone marrow after BMT
Bone marrow edema occurs immediately after BMT
A band-like pattern (red marrow in the periphery and fatty marrow in the center of the vertebral body) is observed on T1-weighted images within 3 months from BMT
9.3 Effect of Treatment on Abnormal Marrow
The effect of treatment on bone marrow malignancies may be assessed with a variety of imaging techniques. Skeletal radiographs show evidence of sclerosis in healing osteolytic lesions, but it may take 3–6 months before such changes become apparent. Skeletal scintigraphy requires almost the same amount of time before it can accurately detect response. The flare phenomenon which consists of increased uptake of the radiopharmaceutical by newly formed bone in healing lesions may mimic active disease; false-positive results may occur in patients with coexisting degenerative disc disease or other benign bone lesions, further complicating the interpretation of bone scans.
Bone metastases have been considered nonmeasurable lesions by standardized response criteria, and until recently, response to therapy could not be quantified on imaging studies. The revised Response Evaluation Criteria in Solid Tumors (RECIST) 1.1 of 2009, however, allowed osteolytic or mixed metastases to be considered as measurable lesions if there is an associated soft-tissue component ≥1 cm; osteoblastic bone lesions remain nonmeasurable [22].
FDG-PET is of value in monitoring the effect of treatment in patients with bone marrow malignancies; it may also provide important prognostic information. When combined with CT or, more recently, with MRI, it provides both anatomic and functional information. In multiple myeloma, a decrease in bone marrow activity on FDG-PET/CT 2–4 months after initiation of treatment is a sign of response to therapy; on the other hand, persistent activity after induction treatment is an adverse prognostic sign which may justify a change in therapy [23]. In patients with bone metastases, a reduction in SUV measurements and an increase in CT attenuation values are signs characteristic of responding lesions. FDG-PET/CT has been found to be an independent predictor of response duration in patients receiving treatment for breast cancer with bone metastases [24, 25].
9.3.1 Conventional MR Imaging
T1-weighted images are best suited for the evaluation of response in patients with focal patterns of bone marrow malignancies; additional sequences should be reviewed, particularly if the uninvolved marrow is predominantly hematopoietic because the hypointense malignant foci may not be discernible from the low-intensity red marrow. Normalization of signal intensity on T1-weighted and STIR images is a sign of MRI response to therapy. However, even in responding patients, bone marrow lesions may not resolve on posttreatment MR images. In multiple myeloma patients, for example, it has been shown that focal lesions may persist on MR images for as long as 58 months after treatment, even in clinical complete responders [26].
A good response to treatment is easily diagnosed when there is a decrease in the number or size of focal lesions. A fatty rim displayed with high signal on T1-weighted images (fatty halo sign or T1 halo sign) may appear in the periphery of responding lesions (Fig. 9.4). If, however, a focal lesion remains unchanged on T1-weighted images, tumor activity cannot be readily assessed. The signal characteristics of the lesion on other MRI sequences may then provide useful information on the effect of therapy. A high-signal-intensity rim at the periphery of a focal lesion on STIR images is a sign of aggressive disease, and its disappearance after therapy is a sign of response [25]. A marked increase in the signal intensity of focal malignant lesions on posttreatment STIR images suggests an increase in water content possibly due to tumor necrosis in responding patients (Fig. 9.5). On contrast-enhanced images, absence of enhancement or delayed, peripheral-only, enhancement of a focal lesion indicates good response to treatment [27, 28] (Figs. 9.5, 9.6 and 9.7). Non-responding lesions continue to enhance early and completely. However, contrast-enhanced findings should be interpreted with caution since myelomatous focal lesions with decreased enhancement on posttreatment MRI studies have occasionally been found to have viable tumor cells at histology [29]. On the other hand, in pediatric patients with treated bone marrow malignant lesions, MRI has shown persistent lesion enhancement in spite of negative biopsies for tumor [30].
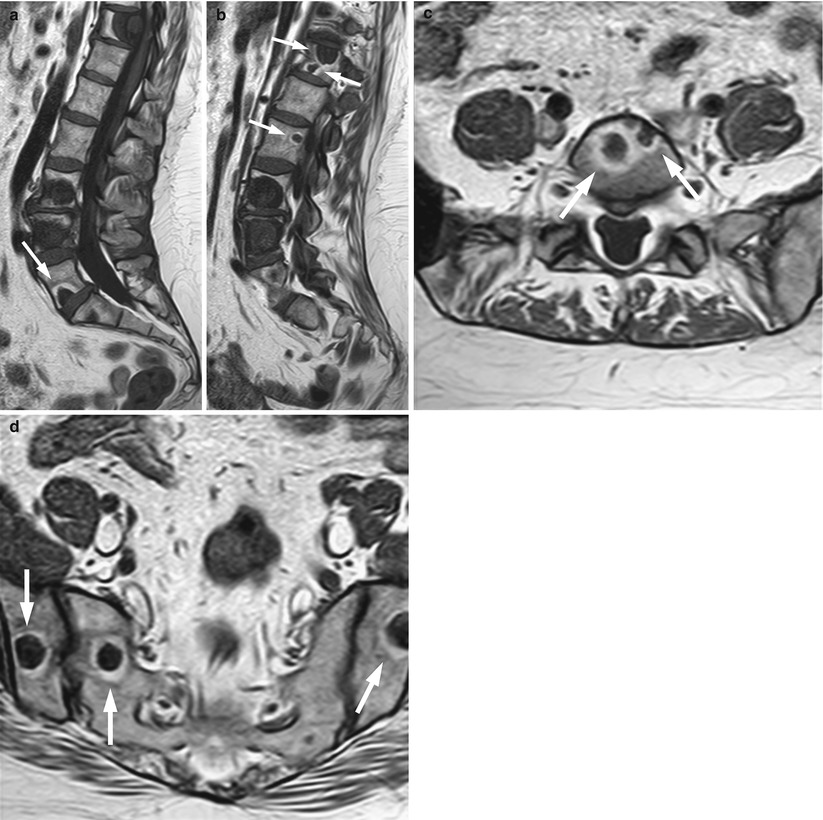
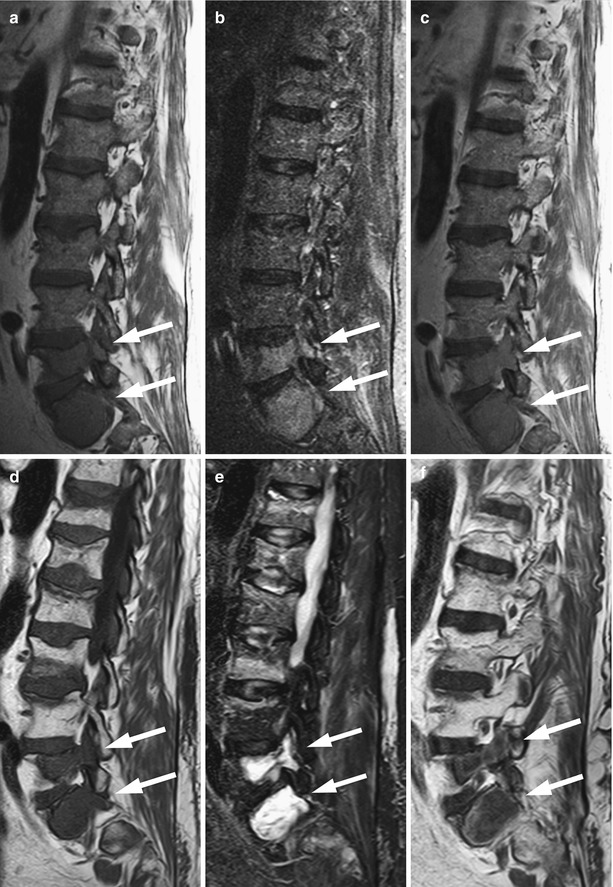
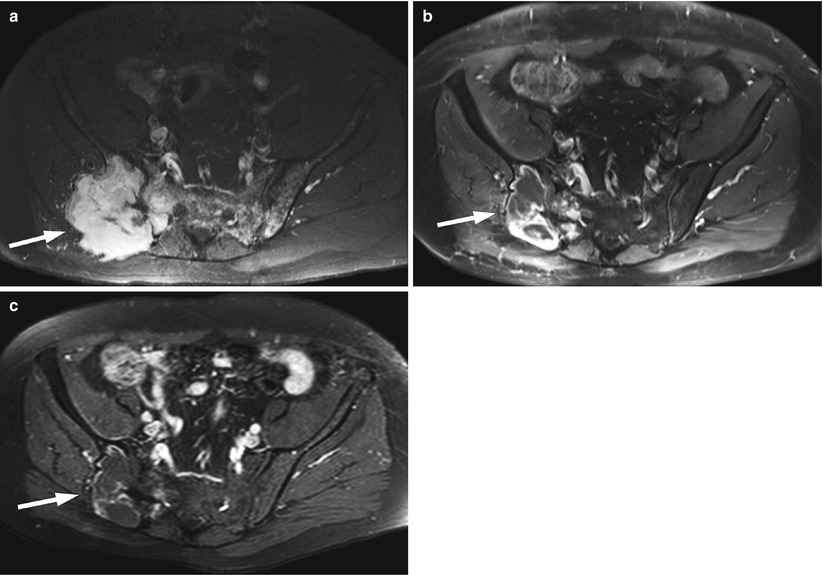
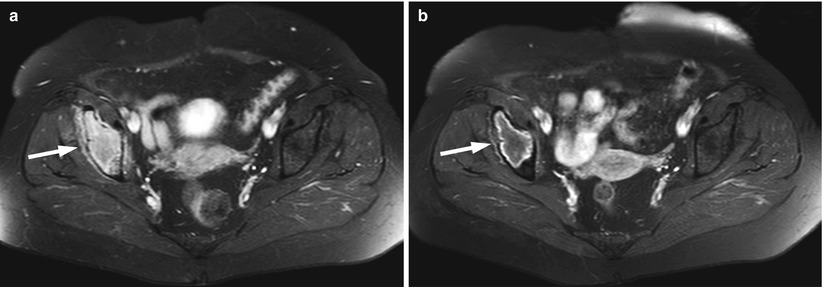
Fig. 9.4
Treatment response of bone metastases: Fatty halo sign (T1 halo sign).
Sagittal T1-weighted images of the lumbosacral spine (a, b) and axial T1-weighted images at L5 (c) and at the level of the sacroiliac joints (d) of a 46-year-old woman who received treatment for metastatic breast cancer show multiple bone metastases surrounded by a fatty rim of high signal intensity, indicating response (arrows)
Fig. 9.5
Focal pattern: MRI signs of response to treatment.
MR images of a 62-year-old man with lymphoma and bone marrow involvement, before (a–c) and after (d–f) treatment with chemotherapy and irradiation of the spine. At the time of the second MRI, the patient had achieved a complete response by standardized response criteria for malignant lymphoma. Sagittal T1-weighted image (a) shows two focal hypointense lesions at L5 and S1 (arrows). The lesions are mildly hyperintense on STIR (b), and they display homogeneous enhancement on the post-contrast T1-weighted image (c) (arrows). On the posttreatment T1-weighted image (d), the lesions are more hypointense (arrows). They are markedly hyperintense on STIR (e) and they show peripheral-only enhancement on the post-contrast T1-weighted image (f) (arrows). The findings are consistent with necrotic, treated lesions. Also note interval development of multiple osteoporotic vertebral fractures with typical band-like signal abnormality along the depressed endplates, related to both irradiation and steroid treatment
Fig. 9.6
Focal pattern: MRI signs of response to treatment.
Axial fat-suppressed contrast-enhanced T1-weighted images of the pelvis of a 61-year-old man with multiple myeloma before treatment (a), at 6 months after diagnosis following completion of chemotherapy (b) and at 12 months after diagnosis following local irradiation (c). The pretreatment image shows a focal lesion at the right iliac bone and right sacral alum, associated with a large extraosseous soft-tissue mass (arrow). The lesion displays marked homogeneous contrast enhancement. Also note multiple small enhancing myelomatous foci at the sacrum and left iliac bone. After chemotherapy, there is a decrease in the size of the lesion which now shows mainly peripheral enhancement (arrow in b). Note resolution of left iliac bone and sacral lesions. After radiotherapy (c), the lesion has further decreased in size and the peripheral enhancement is less perceptible (arrow)
Fig. 9.7
Focal pattern: MRI signs of response to treatment.
Axial fat-suppressed contrast-enhanced T1-weighted images of the pelvis of a 66-year-old woman with a myelomatous lesion of the right iliac bone before (a) and after (b) chemotherapy. On the pretreatment image, the tumor enhances homogeneously (arrow). On the post-contrast image, there is peripheral-only enhancement of the iliac bone lesion (arrow). At the time of the second MRI, the patient had achieved a complete response to treatment by standardized clinical criteria
Key Points
Focal malignant patterns: MRI findings of response
Appearance of a fatty rim on T1-weighted images (fatty halo sign or T1 halo sign)
Resolution of hyperintense rim on STIR
Absence of enhancement or delayed peripheral enhancement on post-contrast T1-weighted images
Decrease in size or number of lesions
Key Points
On T1-weighted images, malignant focal marrow lesions may persist after treatment even in good responders
Review of other sequences is necessary to evaluate activity
A diffuse MR pattern in a patient with a bone marrow malignancy who achieves a partial response to treatment changes to a focal or variegated pattern on T1-weighted images, because fatty marrow reappears in the spine and increases gradually as tumor regresses (Figs. 9.8 and 9.9). In complete responders, a diffuse abnormal marrow pattern may revert to normal [28] (Fig. 9.10). Three to four weeks into treatment with chemotherapy, the bone marrow may become hypointense on T1-weighted images, because of hematopoietic recovery; this effect of chemotherapy is enhanced by the concomitant administration of hematopoietic growth factors. Red marrow reconstitution is distinguished from a persistent diffuse malignant pattern with the aid of additional MR sequences; normal red marrow will generally show only mild increase in signal intensity on STIR images, more than 20 % loss of signal intensity on out-of-phase images and less than 40 % enhancement on post-contrast T1-weighted images.
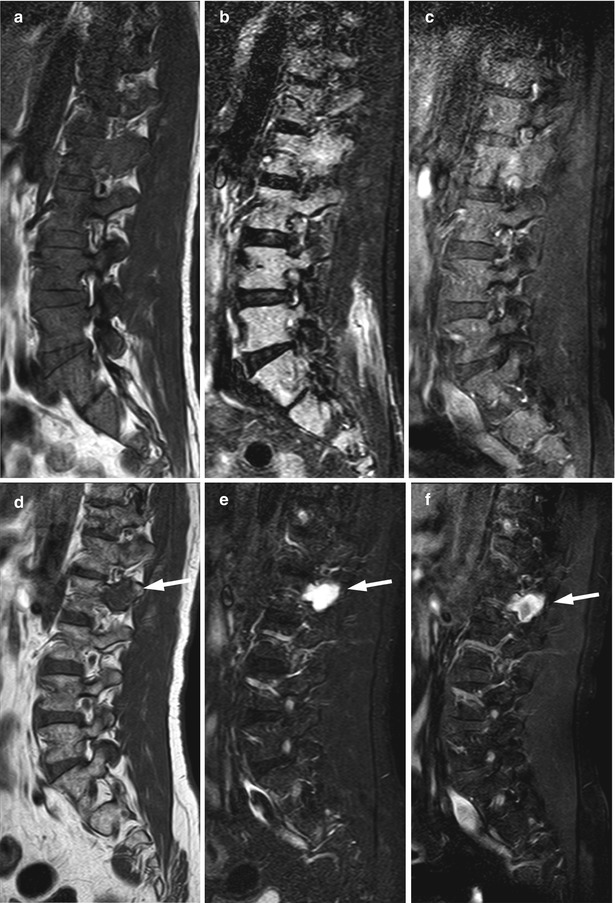
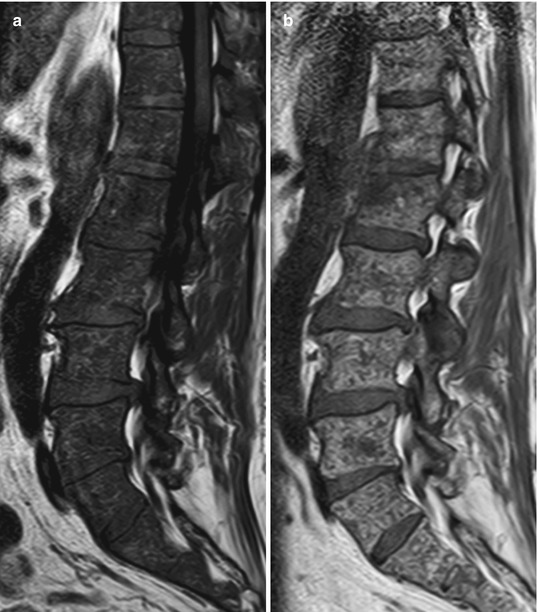
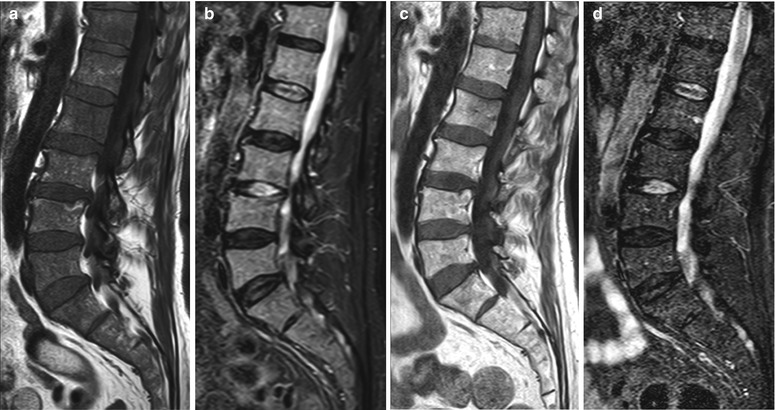
Fig. 9.8
Diffuse pattern: MRI signs of response to treatment.
Pretreatment (a–c) and posttreatment (d–f) images of the lumbosacral spine of a 52-year-old man with multiple myeloma. The pretreatment diffuse MR pattern converted to a focal pattern. At the time of the second MRI, the patient had achieved a complete response by standardized clinical criteria. On the pretreatment images, bone marrow is diffusely hypointense on the T1-weighted image (a) and markedly hyperintense on STIR (b). Moderate enhancement is noted on the post-contrast fat-suppressed T1-weighted image (c). Posttreatment T1-weighted (d), STIR (e), and fat-suppressed contrast-enhanced T1-weighted (f) images show reinstitution of normal fatty marrow in the spine. However, a focal lesion persists at L2 (arrows). The markedly hyperintense signal of the lesion on the STIR image and its predominantly peripheral contrast enhancement indicate response to treatment
Fig. 9.9
Diffuse pattern: MRI signs of response to treatment.
Sagittal T1-weighted image (a) of the lumbosacral spine of a 78-year-old man with multiple myeloma and a diffuse pattern of marrow involvement shows diffusely hypointense marrow (marrow signal intensity lower than that of intervertebral discs). T1-weighted image after treatment (b) shows variegated pattern of the spine with interval appearance of multiple small foci of normal fatty marrow, indicative of response to therapy
Fig. 9.10
Diffuse pattern: MRI findings of response to treatment.
Pretreatment (a, b) and posttreatment (c, d) MR images of the lumbosacral spine of a 71-year-old man with multiple myeloma and complete response to treatment by standardized clinical criteria. Diffuse pattern of abnormal marrow before treatment is hypointense on the T1-weighted image (a) and hyperintense on STIR (b). There is reinstitution of normal hyperintense fatty marrow signal on the posttreatment T1-weighted image (c) as well as normalization of signal on the posttreatment STIR image (d)
Key Points
Diffuse malignant patterns: MRI findings of response
Conversion to a normal bone marrow pattern
Conversion to a focal or variegated pattern
9.3.2 Advanced MRI Techniques
Dynamic contrast-enhanced MRI (DCE-MRI) studies provide valuable qualitative and quantitative information regarding treatment response in patients with bone marrow malignancies. Various perfusion parameters have been used by different investigators. In a small number of patients with hematologic malignancies who were treated with chemotherapy, the maximum percentage of contrast enhancement derived from DCE-MRI decreased 2–6 months after therapy in all patients who responded to treatment [31]. In another study, DCE-MRI in post-stem cell transplant myeloma patients with good response to treatment showed a 75 % decrease in slope wash-in value (a perfusion parameter reflecting tissue vascularization, perfusion, and capillary permeability); this correlated well with the current International Myeloma Working Group (IMWG) response criteria for myeloma [32]. The close correlation of laboratory indices of disease activity with this DCE parameter suggests that DCE-MRI may reliably assess the effect of treatment. Lin et al. reported that the change in maximal percentage of bone marrow enhancement (BMEmax) and the timing of maximal enhancement of focal lesions on DCE-MRI may actually detect disease progression in myeloma patients who have been classified as good responders; more specifically, a posttreatment BMEmax of more than 96.8 % and persistent early enhancement of focal lesions were found to identify poor responders even among patients who were clinically classified as good responders [33].
Related posts:


Stay updated, free articles. Join our Telegram channel

Full access? Get Clinical Tree


