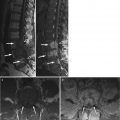
Fig. 6.1
Hypointense diffuse pattern, osteolytic metastases.
Sagittal T1-weighted image of the lumbosacral spine of a 43-year-old woman with breast cancer and lytic bone metastases shows diffusely hypointense marrow with signal heterogeneity
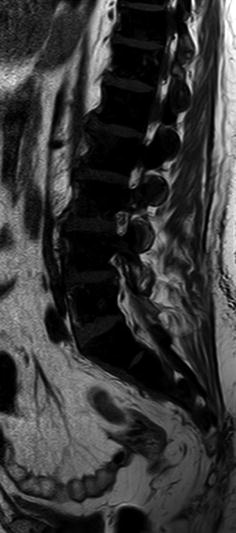
Fig. 6.2
Signal void diffuse pattern, osteoblastic metastases.
Sagittal T1-weighted image of the lumbosacral spine of a 60-year-old man with prostate cancer shows signal void diffuse pattern due to very low-signal osteoblastic metastases completely replacing the bone marrow
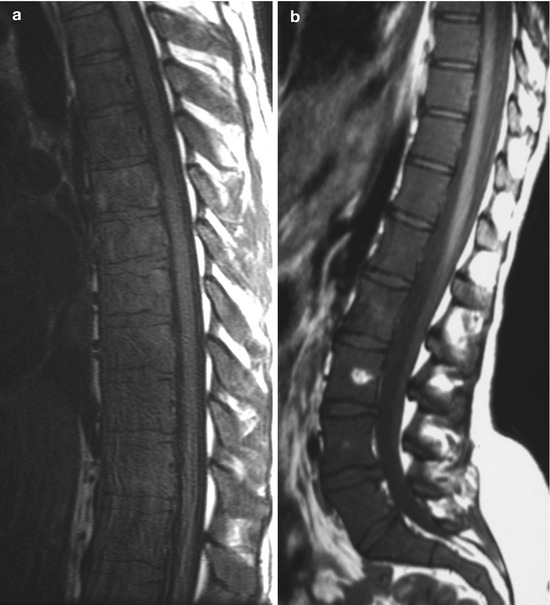
Fig. 6.3
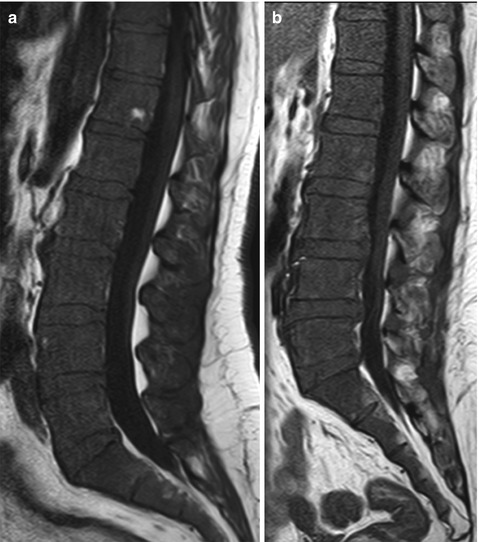
Hypointense diffuse pattern, metastatic small round cell tumors.
Sagittal T1-weighted images of the spine of a 38-year-old man with small cell lung cancer (a) and a 22-year-old woman with neuroblastoma (b) show diffuse low signal intensity of bone marrow due to metastases. Hyperintense focus at L3 in (b) represents small hemangioma, spared by the diffuse malignant process
A diffuse pattern of metastatic bone disease appears hypointense on T1-weighted images and hyperintense on STIR and shows contrast enhancement (Fig. 6.4). Diffuse metastatic disease must be differentiated from hyperplastic red marrow, as both may appear isointense to the intervertebral discs on T1-weighted images. Marrow that is hypointense to disc (hyperintense disc sign) strongly favors metastatic disease over red marrow reconversion (Fig. 6.5). Signal heterogeneity on T1-weighted images is more characteristic of metastatic disease. Other sequences must be carefully reviewed to reach a confident diagnosis. On STIR, the signal intensity of malignant marrow increases to varying degrees depending on the percentage of bone marrow malignant infiltration. It must be noted that, in such cases, as there is no normal marrow for comparison, hyperintensity on STIR images may be hard to appreciate. On chemical-shift out-of-phase images, a more than 20 % signal drop is strongly suggestive of hyperplastic red marrow. On contrast-enhanced images of diffuse marrow metastatic disease, the relationship between marrow signal and disc signal reverts, and the discs become hypointense to the enhancing marrow; a more than 40 % increase in signal intensity on post-contrast images is consistent with metastatic marrow. On quantitative DWI, ADC values of diffusely infiltrated marrow are higher than those of normal red marrow. Although results vary among studies depending on pulse sequence type and b-values used, a threshold of 0.655 × 10⁻³ mm2/s has been proposed to separate normal from malignant marrow with sensitivity and specificity values of 90 % and 93 %, respectively [1].
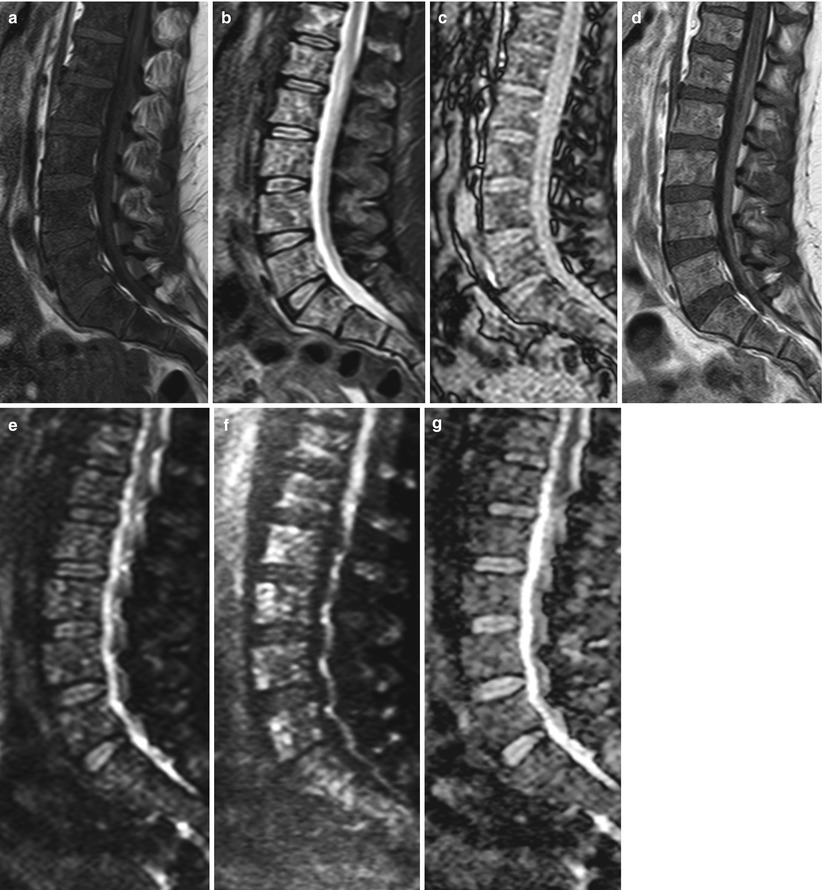
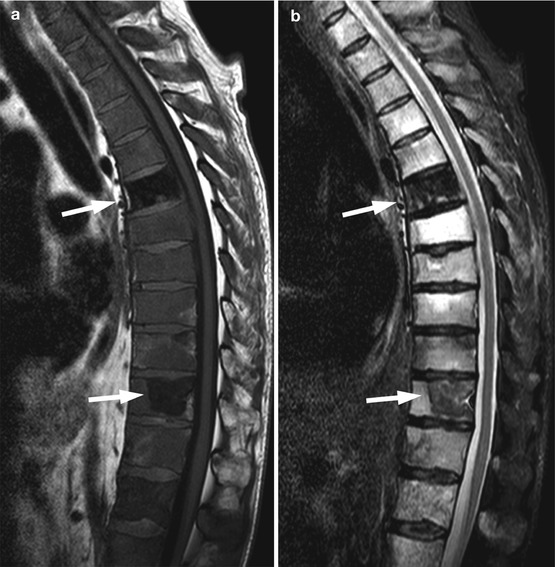

Fig. 6.4
Hypointense diffuse pattern, metastatic disease.
Sagittal T1-weighted (a), STIR (b), out-of-phase (c), post-contrast T1-weighted (d), diffusion-weighted with b-value 0 (e), and b-value 750 (f) images and ADC map (g) of the lumbosacral spine of a 49-year-old woman with breast cancer and diffuse bone metastases. Abnormal marrow is diffusely hypointense (lower signal compared to intervertebral discs) with heterogeneity on the T1-weighted image and hyperintense with heterogeneity on STIR. There is no loss of signal intensity on the out-of-phase image. On the post-contrast image, the malignant marrow enhances and becomes hyperintense to the discs. On the high b-value diffusion-weighted image, metastatic disease manifests with diffuse heterogeneous hyperintense signal. Mean ADC value of the five lumbar vertebrae is 0.839 × 10⁻³ mm2/s. Also noted on the contrast-enhanced image is meningeal enhancement in keeping with leptomeningeal carcinomatosis

Fig. 6.5
Hypointense diffuse malignant pattern, value of hyperintense disc sign.
Sagittal T1-weighted image (a) of the thoracic spine of a 65-year-old man with prostate cancer shows two very hypointense focal osteoblastic metastases (arrows). The rest of the marrow shows diffuse hypointensity with lower signal compared to the intervertebral discs (hyperintense disc sign) due to osteolytic metastases. On STIR (b), the osteolytic metastases become markedly hyperintense while the osteoblastic metastases (arrows) show a mild increase in signal intensity
The diffuse pattern of metastatic bone disease is diagnosed on MR images of the axial skeleton. In patients with advanced bone metastatic disease, red marrow reconversion may occur in the peripheral skeleton, in response to an increased need for hematopoiesis; red marrow may then be visualized in the periphery, at sites occupied by fatty marrow in the healthy adult. In such cases, the diffuse pattern of bone metastases may eventually extend to involve the peripheral skeleton. Metastatic involvement of the epiphyses and apophyses is, however, very rare and when present, indicates extreme tumor burden (Fig. 6.6).
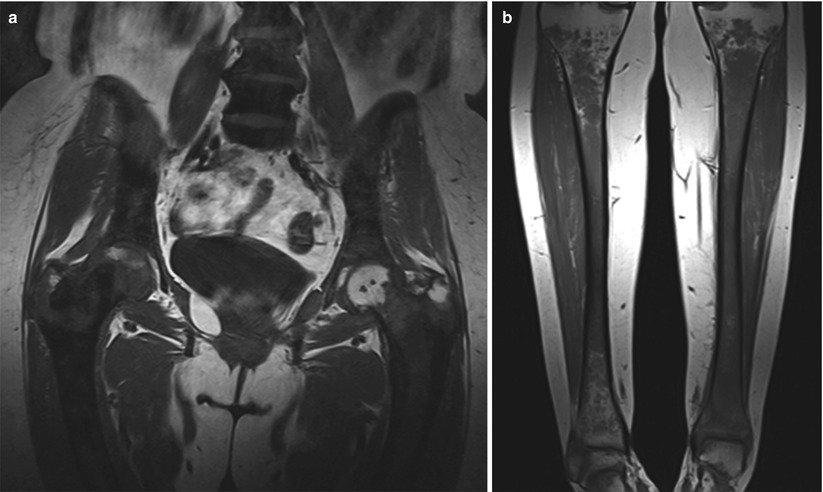

Fig. 6.6
Diffuse malignant pattern, peripheral skeleton involvement.
Coronal T1-weighted images of the hips (a) and tibiae (b) of a 58-year-old woman with breast cancer and diffuse bone metastases involving the peripheral skeleton. Tumor burden is very high with abnormal low signal extending to the femoral and tibial epiphyses, more pronounced in the right proximal femur and left distal tibia
6.2 Multiple Myeloma: Diffuse Pattern
A diffuse MRI pattern of multiple myeloma is less frequent than a focal pattern, according to most studies. It is associated with increased tumor burden and a poorer prognosis [2]. Myeloma patients with a diffuse MRI pattern of involvement have higher ISS stage, more severe anemia and hypercalcemia, and significantly higher values of β 2 -microglobulin and bone marrow plasmacytosis [3, 4]. Median survival for patients with diffuse marrow involvement is only 24 months versus 51 months and 52 months for patients with focal and variegated myeloma patterns, respectively [4]. More recently, it was shown that high-risk cytogenetic abnormalities, a most adverse prognostic factor for this disease, are more frequent in myeloma patients with a diffuse MRI pattern (50 %) than in those with focal or variegated patterns (31 %) [5]. Furthermore, it has been shown that 80 % of myeloma patients with a diffuse MRI pattern have moderate or high-grade angiogenesis on bone marrow biopsy versus 66 % of those with a normal and 41 % of patients with a focal MRI pattern [6]. Diffuse marrow involvement was found to be an adverse prognostic factor, regardless of ISS stage or plasma cell infiltration, even in patients treated with novel antiangiogenic agents.
Key Point
A diffuse MRI pattern of involvement in multiple myeloma patients is associated with higher tumor burden, increased angiogenesis, high-risk cytogenetics, and shorter median survival
A diffuse pattern of myelomatous involvement of the bone marrow is diagnosed when low signal intensity marrow (iso- or hypointense to intervertebral discs or muscle) is observed on T1-weighted images, without any intervening normal appearing marrow. Pattern assignment is based on T1-weighted images of the spine (Fig. 6.7). Diffuse involvement of the bone marrow may be hard to detect, if the percentage of bone marrow plasmacytosis is lower than 20 % [7] (Fig. 6.8). In our experience, this percentage may be even higher (Fig. 6.9). In these cases (patients with a normal conventional MRI study and low to moderate bone marrow plasmacytosis), advanced MRI techniques, such as DCE-MRI and DWI, may detect abnormal changes at the microvascular and cellular level, respectively (see below). A diffuse pattern is less frequently associated with extraosseous soft tissue, compared to the focal pattern.
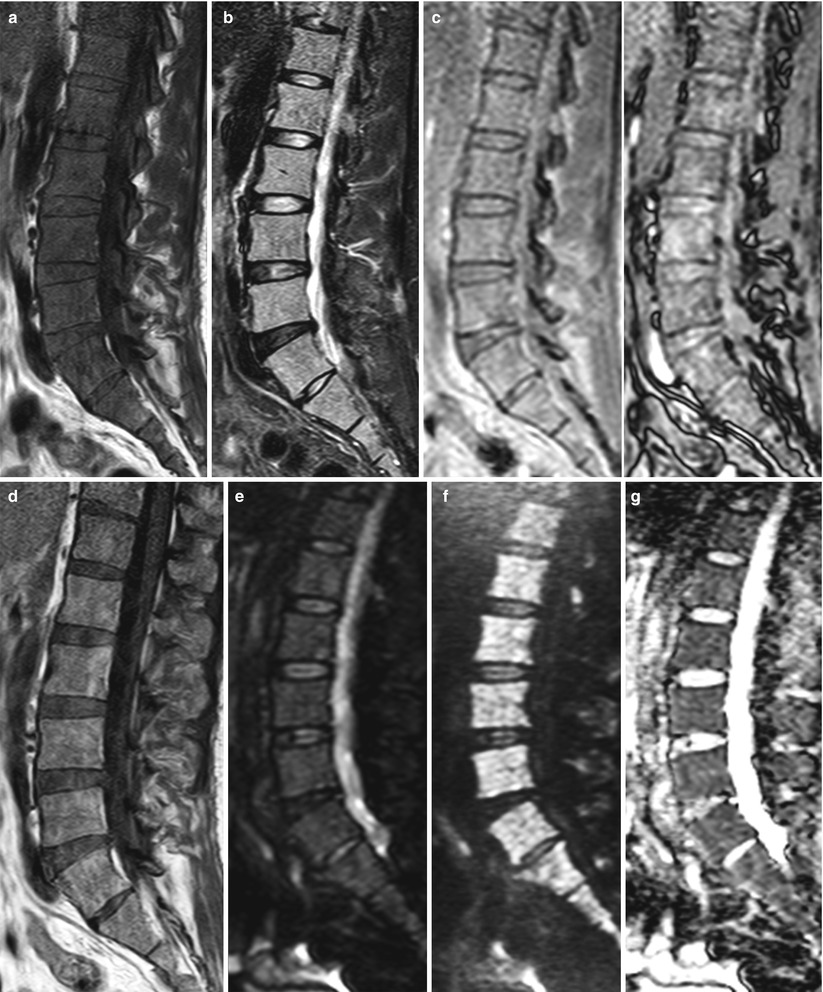
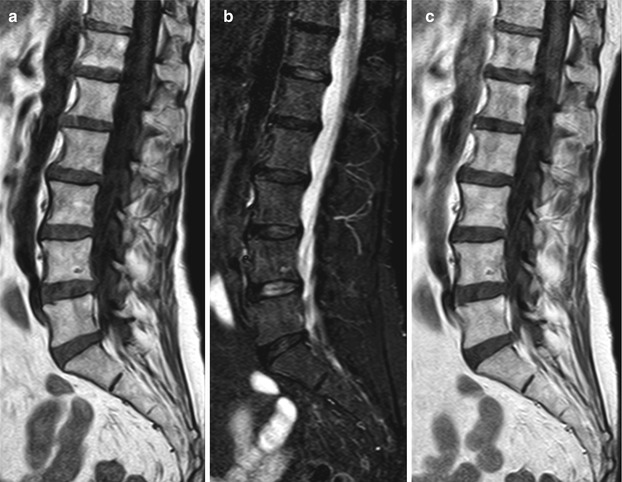
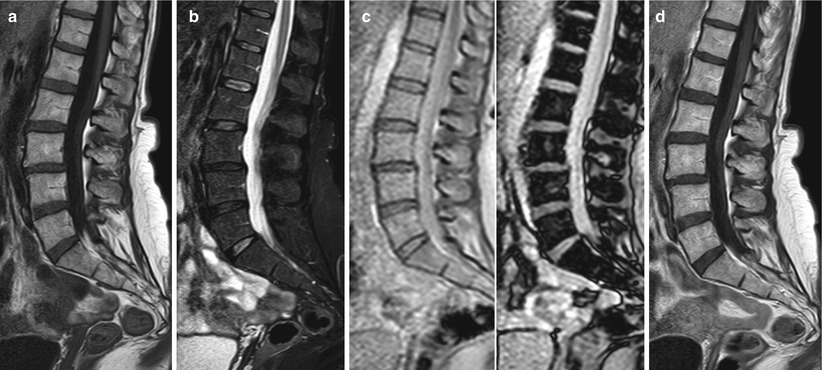

Fig. 6.7
Multiple myeloma, diffuse pattern.
Sagittal T1-weighted (a), STIR (b), in-phase (left) and out-of-phase (right) (c), post-contrast T1-weighted (d), and diffusion-weighted with b-value 0 (e) and b-value 750 (f) images and ADC map (g) of the lumbosacral spine of a 52-year-old man with multiple myeloma and diffuse marrow involvement. On the T1-weighted image, marrow signal intensity is low, equal to lower than that of the intervertebral discs. On STIR, diffuse hyperintensity of the marrow is noted. There is no signal dropout on the out-of-phase image. Diffuse contrast uptake is observed on the post-contrast T1-weighted image. The marrow is diffusely hyperintense on the high b-value image. Mean ADC value of the five lumbar vertebrae is 0.917 × 10⁻³ mm2/s

Fig. 6.8
Low bone marrow plasmacytosis, normal pattern.
Sagittal T1-weighted (a), STIR (b), and T1-weighted contrast-enhanced (c) images of the lumbosacral spine of a 72-year-old woman with asymptomatic multiple myeloma and 12 % bone marrow plasmacytosis. There is no obvious signal abnormality on the T1-weighted and STIR images. No perceptible contrast uptake is noted on the enhanced image

Fig. 6.9
Moderate bone marrow plasmacytosis, normal pattern.
Sagittal T1-weighted (a), STIR (b), in-phase (left) and out-of-phase (right) (c), and post-contrast T1-weighted (d) images of the lumbosacral spine of a 58-year-old woman with multiple myeloma and 40 % bone marrow plasmacytosis. There is no obvious signal abnormality on the T1-weighted and STIR images. Marked signal dropout is noted on the out-of-phase image (with the exception of areas of focal fat along basivertebral vessels and at the spinous process of L3). On the enhanced image, there is no perceptible contrast uptake
On T1-weighted images, the diffuse pattern of multiple myeloma, is usually homogeneous, unlike diffuse patterns observed in metastatic disease and lymphoma where heterogeneity of the diffusely involved marrow is often present (Fig. 6.10). On STIR images, the marrow may appear more heterogeneous than on T1-weighted images, with diffuse signal increase and presence of even more hyperintense discrete areas (Fig. 6.11). On out-of-phase images, there is absence of—or less than 20 %—signal loss. In patients with pronounced bone marrow plasmacytosis, signal intensity may be higher on out-of-phase compared to in-phase images (Fig. 6.12).
