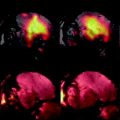
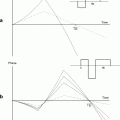
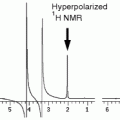
Fig. 1.
Illustration of the experimental setup for the lung MR imaging studies using hyperpolarized gas with free breathing. The top picture shows the homemade mask positioned on the head of the animal (C57BL/6 mouse). The head mask is connected to a balloon filled with gas. The bottom picture represents the animal, with the mask, positioned in the NMR rf coil. The balloon is connected to the mask once the animal is positioned within the magnet.
3.1.2 Free Breathing and Acquisition of Ventilation Images
1.
Extract HP 3He from the storage cell to a 60-mL syringe. Transfer the 3He gas from the syringe to the latex balloon. Attach the balloon to the mask positioned on the head of the animal. Allow the animal to breathe spontaneously the gas from the balloon (Fig. 1).
2.
Launch the MRI sequence. Following MR acquisition (typically 20 s time), disconnect the balloon from the head mask and allow the animal to recover.
3.
This protocol can be repeated to investigate bronchoconstrictive effects of methacholine. Trigger intravenous injection of methacholine solution (10 μg/mL) using infusion syringe pump (6 mL/h for rat).
4.
Repeat Steps 1 and 2 as many times as required by the follow-up imaging protocol.
3.1.3 Imaging Parameters
MRI field strength is equal to 2 T (optimal magnetic field strength for HP gases ventilation imaging in small animals). To acquire 3He signal at very short echo, a radial-sampling imaging sequence is used.
Repetition time (TR) = 5 ms; TE = 40 μs; field of view (FOV) = 80 mm; number of radial directions (NA) = 200; number of sampled points (NS) = 128; number of experiments (NEX) = 20; no slice thickness; flip angle = 12°; total acquisition time = 20 s.
3.1.4 Reconstruction Parameters
Image reconstruction is performed using a gridding algorithm (regridding of radially acquired samples onto a Cartesian grid). Reconstruction oversampling factor = 2; sampling density compensation using the Jacobian of the transformation; Kaiser–Bessel kernel parameters: shape factor a = 2.8, window width L = 3.0; final reconstruction matrix 256 × 256 (see Note 3).
3.1.5 Expected Results
The expected results for ventilation imaging under spontaneous breathing conditions are the visualization of ventilated airspaces at tidal volumes. The Cine reconstruction algorithm generates images of ventilation at different phases of the breathing cycle (Fig. 2). Images of ventilation and gas arrival maps can be monitored during slow intravenous injection of methacholine. With increasing injected dose of methacholine, ventilation defects and delayed gas arrival time in the airspaces can be observed (Fig. 3).
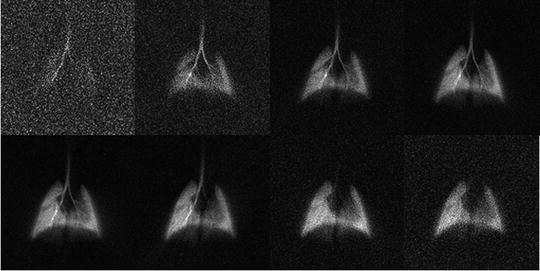
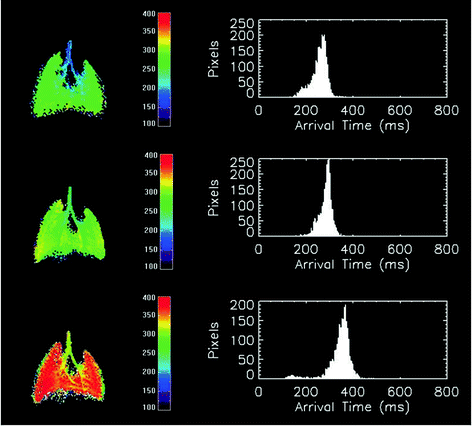

Fig. 2.
Examples of lung ventilation images obtained under free-breathing conditions. The images represent the intrapulmonary distribution of polarized 3He for different time windows of the breathing cycle of the animal. In this example, images correspond to consecutive 100-ms time windows. Images are reconstructed using a retrospective Cine algorithm. The total acquisition time is 20 s.

Fig. 3.
Examples of parametric ventilation maps obtained in a rat using the 3He free-breathing protocol. Parametric maps represent the local arrival time values in milliseconds. The arrival time is defined as the time delay between the arrival of gas into the trachea and the arrival of gas in a given pixel. The corresponding histogram for arrival time value is shown on the right. From top to bottom, the images correspond to the data acquisition before intravenous injection of methacholine, 11 and 21 min after the start of the injection of methacholine (10 μg/mL, 6 mL/h injection rate), respectively.
3.2 Lung Proton MR Imaging in LPS Model of Lung Inflammation
3.2.1 Administration of LPS
1.
Dissolve 1 mg/kg of LPS in 0.2 mL of saline.
2.
Anesthetize the rat (injection of ketamine/xylazine) (see Note 2).
3.
Wait until the animal loses its toe pinch reflex and position it supine on the board with the head tilted up (see Note 4).
4.
Intubate the animal with a 26-gauge flexible polyethylene catheter attached to the 1-mL syringe (see Note 5) into a trachea (it is recommended to verify the length of the catheter first) and instill 0.2 mL of the solution (Fig. 4).
5.
In order to have a homogeneous distribution of the suspension in the lungs, provoke hyperventilation by using a ventilator (see Note 6).
6.
Allow the animal to recover maintaining its temperature on a heating pad.
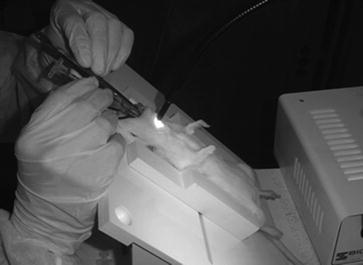
Fig. 4.
Example of instillation setup. For instillation of agents, position a rat supine with the head tilted up. Intubate rats perorally with a 26-gauge flexible polyethylene catheter into the trachea. Inject 0.2 mL of solution.
3.2.2 Imaging Parameters
Two different approaches can be used: the first one uses a gradient echo imaging sequence which permits to obtain a high contrast between dark-appearing lung parenchyma and the expected inflammation hallmark; the second, based on a radial ultra-short echo time sequence, is less sensitive to motion and blurring artifacts occurring in the thoracic cavity during respiration, and thus can provide more accurate assessment of image borders. The optimal sequence parameters at 4.7 T are as follows:
Gradient echo imaging: TR = 5.6 ms, TE = 2.7 ms; bandwidth = 100 kHz, flip angle = 15°, FOV = 6 × 6 cm2, matrix size = 256 × 128, and slice thickness = 1.5 mm. A single slice with 60 averages is acquired, resulting in an acquisition time of 75 s (55). To cover the entire lung volume, use 12–28 consecutive axial slices.
Radial ultra-short echo time imaging: TR = 80 ms, TE = 450 μs; bandwidth = 64 kHz, flip angle = 20°, FOV 6 × 6 cm2, 400 radials/image, 128 samples/view, slice thickness = 1.5 mm. A multi-slice acquisition with four averages is applied. Neither cardiac nor respiratory gating is used. The total acquisition time is equal to 4 min with an acquisition covering 12 contiguous axial slices.
3.2.3 Optimal Imaging Times
To observe an inflammation hallmark, the optimal imaging time is 48 h after LPS exposure (34, 49). However, the inflammation can be detected at its earlier stage (6 h after the challenge) as well as at later time points (up to 72–144 h after the challenge), reflecting pleura and mucus hypersecretion, respectively (34, 59). The protocol scheme is presented in Fig. 5.
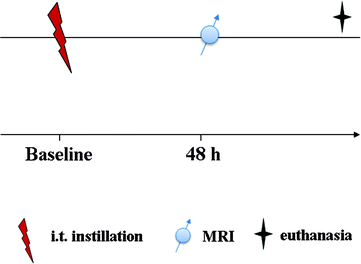

Fig. 5.
Scheme of the experimental protocol.
3.2.4 Expected Results
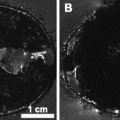
The expected result is a hyperintense signal visualized on the T 1-weighted images. The observed signal is usually characterized by two components: one, of higher intensity, is attributed to the edema; the second patchy-like appearance, with a less intense signal, represents an evidence of mucus secretion (Fig. 6).
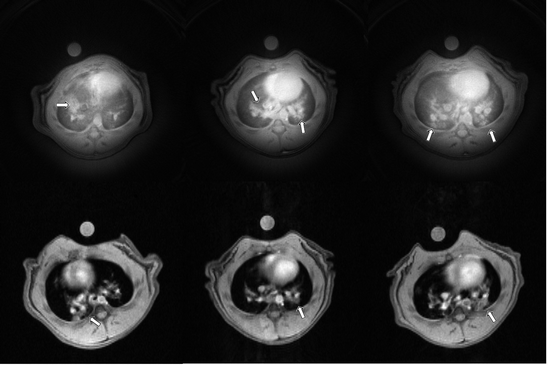

Fig. 6.
Exemplary images of thorax in the axial plane 48 h after LPS instillation acquired using the radial UTE (top) and the gradient echo imaging sequence (bottom). The arrows indicate signal from inflammation.
3.2.5 Application in Pharmacology
The exposure to the endotoxin LPS is a well-established model of acute inflammation in rodents and similar to that observed in human COPD. The proposed protocols have the potential to provide easy implementation and accurate and non-invasive means of monitoring the effect of anti-inflammatory drugs in the experimental research of lung inflammation (31).
4 Notes
1.
The homemade mask was realized as follows. The barrel of a standard plastic syringe was cut to the appropriate length to cover the head of the animal. The tip of the syringe barrel was sectioned to fit the nose of the animal. A hole was drilled in the screw cap of a plastic vial. This screw cap was then glued to the tip of the barrel of the syringe. This mask was positioned on the head of the animal. The body of the plastic vial was sectioned. The balloon (later on filled with polarized helium) was tied on the body of the plastic vial. Before launching the 3He MR acquisition, the plastic vial attached to the helium-filled balloon is screwed on the animal mask.
2.
Ketamine–xylazine cocktail is a preferred anesthesia over pentobarbital in ventilation studies because it induces less cardio-respiratory depression. Standard dose for intraperitoneal injection in rat and mouse is 3–9 mL/kg body weight of a mixture of 1 mL ketamine (100 mg/mL), 1 mL xylazine (20 mg/mL), and 5 mL saline.
Alternatively, isoflurane inhalation can be used to anesthetize animals during MR acquisitions (proton studies).
3.
Reconstruction of MR images acquired with radial k-space sampling requires dedicated reconstruction algorithms (regridding, i.e., interpolation of radially sampled data onto a Cartesian grid or filtered back-projection). MR manufacturers might provide such software in their reconstruction package. However, it is likely that off-line dedicated reconstruction software will be needed. In our studies, we use a set of homemade programs developed under IDL software (Research Systems Inc., Boulder, CO).
4.
Hold the rat’s head tight on to the board by a loop string or rubber which passes under the upper incisors.
5.
or intubation, put out the rat’s tongue and open the rat’s mouth 2 cm wide using smooth blunt forceps. While inserting the catheter, lighten the larynx from the exterior using a light source.
6.
Ventilate the rat at a frequency of 60 breaths per minute for approximately 1 min.
Acknowledgments
Magdalena Zurek acknowledges a fellowship from the European Network PHELINET (MRTN-CT-2006-36002).
References
1.
2.
3.
4.
MacFall, J. R., Charles, H. C., Black, R. D., Middleton, H., Swartz, J. C., Saam, B., Driehuys, B., Erickson, C., Happer, W., Cates, G. D., Johnson, G. A., and Ravin, C. E. (1996) Human lung air spaces: potential for MR imaging with hyperpolarized He-3. Radiology 200, 553–558.PubMed
Stay updated, free articles. Join our Telegram channel

Full access? Get Clinical Tree


