Fig. 13.1
Distribution of foci with reduced gray matter density in chronic schizophrenia vs. healthy controls (Shepherd et al. 2012)
13.2.2 Causes of Volume Changes in Schizophrenia
There is ongoing discussion as to whether volume changes in schizophrenia are caused by early developmental insults (genetic or environmental) and remain static over time or are caused by a progressive loss due to the disease process. This question is best addressed by investigating subjects at genetic risk (i.e., unaffected first-degree relatives), individuals in the putatively prodromal state of the illness, and patients over the course of several years of illness.
First, we review studies on unaffected relatives of patients bearing familial liability to the disorder (familial high-risk (FHR) individuals). In the VBM meta-analysis by Chan et al. (2011), eight studies comparing first-degree relatives of patients and FES patients with control subjects were included with a total of 566 relatives. They found significantly reduced gray matter in the bilateral anterior cingulate gyrus (Brodmann area [BA] 32/24), right insula (BA 13), left amygdala, left subcallosal gyrus (BA 34), and left inferior frontal gyrus (BA 47) in FHR individuals relative to the healthy control group. Of these regions, the left amygdala, subcallosal gyrus, and inferior frontal gyrus were also smaller in the FHR as compared to the FES group (see Fig. 13.2).
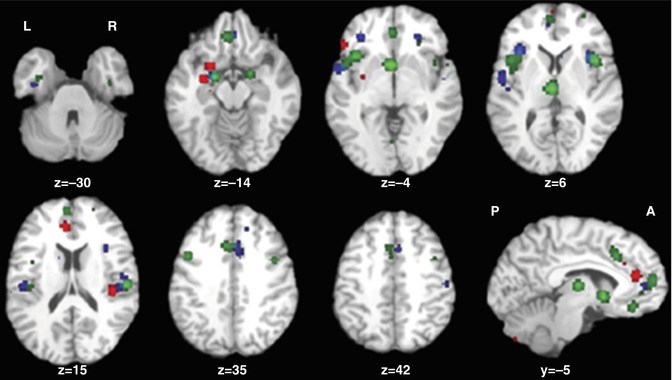
Fig. 13.2
Gray matter volume reductions in high-risk group (red), first-episode group (blue), and chronic patients (green) compared with healthy subjects (Chan et al. 2011)
In a similar meta-analysis, 16 VBM studies involving 733 FHR subjects (relatives of patients with schizophrenia), 563 healthy controls, and 474 patients were analyzed using the signed differential mapping (SDM) technique (Palaniyappan et al. 2012). A significant gray matter reduction in the lentiform nucleus, amygdala/parahippocampal gyrus, and medial prefrontal cortex was found in association with the genetic diathesis. Gray matter reduction in bilateral insula, inferior frontal gyrus, superior temporal gyrus, and the anterior cingulate was present in association with the disease expression. The neuroanatomical changes associated with the genetic diathesis to develop schizophrenia appear to be somewhat different in this meta-analysis from those contributing to the clinical expression of the illness. A notable feature of this analysis is that most VBM studies (five out of nine) do not find structural differences in FHR individuals when compared to healthy controls. This suggests that the anatomical correlates of genetic diathesis are either weak or inconsistently identified using the VBM approach. Some support to the latter notion comes from a head-to-head comparison of VBM approach and surface-based morphometric approaches (Palaniyappan and Liddle 2012), which suggests that subtle surface anatomical changes that may be important for the pathophysiology of schizophrenia may be missed when using VBM.
These two VBM meta-analytic results (Palaniyappan et al. 2012; Chan et al. 2011) are consistent with Fusar-Poli et al. (2011a, b, 2012a, b) who undertook two meta-analyses of the VBM studies on the genetic diathesis of schizophrenia. The left parahippocampal gyrus emerged as the most significant locus with gray matter reduction in FHR compared to controls (Fusar-Poli et al. 2011a, b, 2012a, b). In addition, the anterior cingulate cortex was found to be linked to genetic diathesis (Fusar-Poli et al. 2011a, b, 2012a, b).
13.2.3 Structural Changes in Subjects at Ultrahigh Risk for Schizophrenia
Studies using voxel-based morphometry (VBM) aim to identify neuroanatomical correlates of increased vulnerability to schizophrenia and to predict consecutive transition to the full-blown disorder. MRI findings, mostly from cross-sectional studies, have reported structural abnormalities in the prepsychotic phase resembling those that have been described in patients with schizophrenia. Specifically, studies in UHR samples have shown that abnormalities in frontal, temporal, and limbic regions may predate illness onset (Borgwardt et al. 2007; Meisenzahl et al. 2008; Pantelis et al. 2003). However, as these individual studies have used different methodological approaches, relatively small sample sizes, and have produced divergent findings, they are insufficient for the characterization of brain regions associated with increased vulnerability to schizophrenia. Furthermore, other factors such as short-term use of antipsychotic medication, differences in ascertainment strategies for the UHR syndrome, and the fact that the syndrome is a dynamic condition with symptoms varying considerably over time may modulate findings. To adequately address such confounding factors and to examine the neurobiological predictors of transition from the high-risk state to the full-blown disorder, Fusar-Poli et al. (2011a, b) have conducted an activation likelihood estimation (ALE) meta-analysis of 19 VBM studies of UHR subjects. When comparing subjects at increased risk for schizophrenia (clinical risk and familial risk) to healthy controls, the authors found that at-risk subjects showed reduced gray matter volume in the temporal (right superior temporal gyrus), parietal (left precuneus), and limbic regions (bilateral parahippocampal/hippocampal regions, bilateral anterior cingulate) and in the prefrontal cortex bilaterally (left medial frontal gyrus, right middle frontal gyrus). As none of the at-risk subjects were psychotic, these findings could be interpreted as neuroanatomical correlates of an increased risk for schizophrenia. Structural alterations in these regions have been found in psychotic disorders (Tan et al. 2009; Boyer et al. 2007; Baiano et al. 2007; Sun et al. 2009; Cavanna and Trimble 2006) and all of the above named regions have also been found to be abnormal in fMRI studies of high-risk subjects (Fusar-Poli et al. 2007), indicating there may be a shared pathophysiological mechanism of functional and structural abnormalities in the high-risk group. However, clinical and familial risks of schizophrenia are not directly comparable, as different transition rates in the two groups suggest (20–40 % risk over 2 years for UHR cohorts vs. 5–9 % lifetime risk in FHR cohorts (Cannon et al. 2008; Knowles and Sharma 2004; Yung et al. 2003)). Thus, UHR subjects showed reduced gray matter in the bilateral anterior cingulate and increased gray matter in the left hippocampus and insula and the right superior temporal gyrus when compared to FHR subjects (Fusar-Poli et al. 2011a, b). These differences in gray matter changes may reflect the differential influences of genetic vs. psychopathological factors in the prepsychotic phase possibly underlying the differential rates of transition. A potential neurobiological predictor of schizophrenia transitions may be represented by gray matter reductions in the right inferior frontal gyrus and superior temporal gyrus, which are present in UHR subjects who go on to make a transition but not in those who don’t (Fusar-Poli et al. 2011a). These findings suggest that although structural abnormalities identified by VBM studies show similar results in at-risk subjects and subjects with schizophrenia, they may be differentially associated with risk of transition.
We will next address the question as to whether the volume alterations seen in manifest schizophrenia patients are static or progress over the course of illness. Four ROI volumetric reviews assessed the temporal evolution of the reported brain alterations (Hulshoff-Pol and Kahn 2008). The most comprehensive of these (Olabi et al. 2011) found a significantly greater degree of change over time in whole brain gray matter (d = −0.520), frontal lobe (d = −0.340), and left caudate (d = −0.336) in people with schizophrenia, though no progressive changes were reported in temporal, parietal, or occipital lobe gray matter, hippocampus, amygdala, or cerebellum over a range of 1–10 years. Significant progressive volume increases were reported in bilateral lateral ventricles (d = 0.530), with a trend toward significance for the third ventricle (d = 0.180) (Olabi et al. 2011). The difference between patients and control subjects in annualized percentage volume change was −0.07 % for the whole-brain volume and −0.59 % for the whole-brain gray matter (Olabi et al. 2011). An additional meta-analysis has assessed progressive changes in ventricular volume, reporting moderate- to high-quality evidence for increased lateral ventricular volume over time (g = 0.449), with no significant difference if the baseline measurement was in FES (g = 0.491) or CS (g = 0.407) (Kempton et al. 2010). Inter-scan duration ranged similarly between 1 and 10 years. In summary, there is clear evidence for progressive local (and global) volume losses across time in patients over and above these seen in healthy control subjects.
Three voxel-based meta-analyses performed subtraction analyses between the significant voxels identified in FES and CS cross-sectionally (Chan et al. 2011; Ellison-Wright et al. 2008) and largely support many of the distinctions identified by indirect comparisons across illness duration. While both groups showed alterations in the inferior frontal lobe, cingulate gyri, insula, and cerebellum (Fig. 13.3), differential changes were also reported. Relative to FES, CS were characterized by reduced GM in the medial frontal lobe, DLPFC, postcentral gyrus, uncus, temporal lobe gyri (inferior, middle, fusiform), and parahippocampus. Relative to CS, FES were characterized by reductions in the basal ganglia (caudate and putamen), temporal lobe gyri (superior and transverse), amygdala, and precentral gyrus.
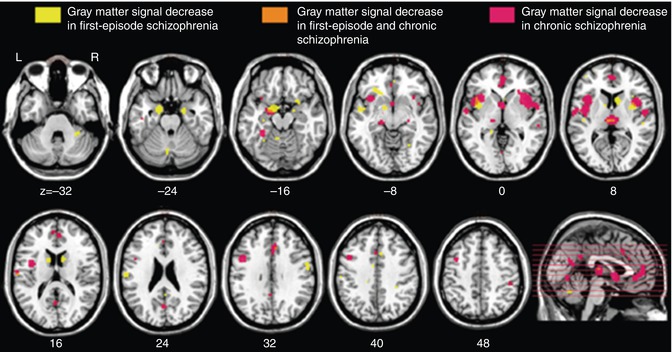
Fig. 13.3
Regional overlap of gray matter changes in first-episode and chronic schizophrenia (Ellison-Wright et al. 2008)
In summary, there are structural volume losses in localized brain areas in patients with schizophrenia that are already present in subjects at increased clinical and familial risk for schizophrenia as well as in patients with a first psychotic episode. Brain abnormalities at first presentation include similar regions as in the risk groups, but additional fronto-striatal-temporal pathology emerges. Finally, when the chronic stage of the illness has been reached, the gray matter volume reduction has progressed further not only within the same regions but also involving more prefrontal cortical and thalamic loci. This corticothalamic pathology maps the neurochemical circuitry systems implicated in schizophrenia, namely, corticothalamic loop systems, regulated through a complex interplay of glutamate, c-aminobutyric acid, and dopamine neurotransmission. The changes across groups of subjects (UHR, FHR, FEP, and CS) and course of time are not associated with a unique and clear-cut clinical picture, thus reflecting heterogeneous etiology and clinical course of the disorder. Most likely, the changes are not linear over time and may fluctuate with phylogenesis and the course of disease. To conclude, volume changes both are of neurodevelopmental origin and progress further in the course of illness, with some, but not all, anatomical regions overlapping over time.
13.2.4 Volume Changes in Schizophrenia and in Other “Functional Psychoses”
Before we address the question of whether volume changes are unique to schizophrenia or are also present in the other “functional psychoses” such as bipolar disorder (BD) and major depressive disorder (MDD), we have to keep in mind that the three disorders, schizophrenia, BD, and MDD, are most likely not separate disease entities but mere clinical conventions. They share many symptoms; diagnoses can switch in the course of illness; they share a number of genetic and environmental risk factors; all three lead to cognitive deficits, particularly in the chronic, severe patients; and some atypical antipsychotics are efficient in acute- and long-term treatment in all three disorders. We therefore can expect some overlap in structural changes across the three disorders. It is of note that there are no meta-analyses and no original structural MRI studies, where the three disorders are compared directly, so we will consider only the comparison of two disorders at a time.
There are three meta-analyses comparing the findings of schizophrenia and BD (Ellison-Wright and Bullmore 2010; Yu et al. 2010; Bora et al. 2011). Since in the schizophrenia studies male subjects predominate, as compared to BD samples, and the brains of women and men are different, Bora et al. (2012a) controlled for gender effect. They found gray matter differences between gender-balanced schizophrenia and BD patients only in the right dorsomedial frontal cortex and left dorsolateral prefrontal cortex (smaller in schizophrenia; see Fig. 13.4). If the samples are not controlled for gender, the differences become more apparent (Ellison-Wright and Bullmore 2010; Yu et al. 2010; see Fig. 13.5).
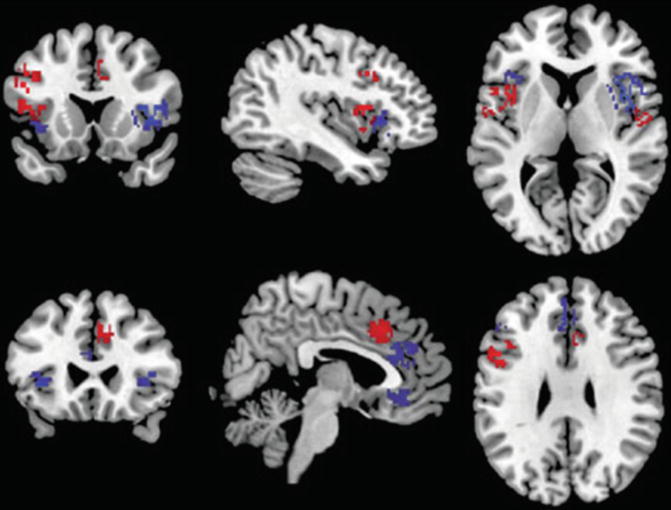
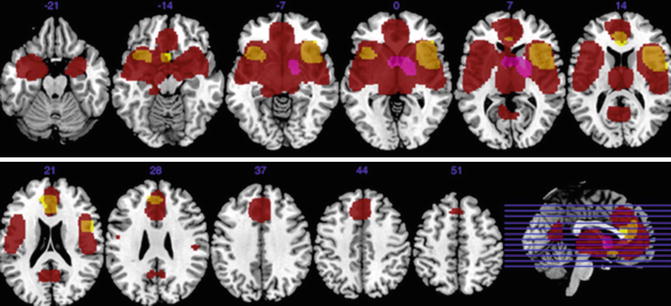
Fig. 13.4
Gray matter reductions in bipolar disorder (blue) and gender-balanced samples of schizophrenia (red) (Bora et al. 2011)
Fig 13.5
Gray matter decreases in subjects with bipolar disorder relative to controls (yellow). Regions of gray matter decreases (red) and increases (purple) in subjects with schizophrenia relative to controls (Ellison-Wright and Bullmore 2010)
There is no meta-analysis comparing schizophrenia and MDD directly, because there are no original studies comparing these groups. In the two VBM meta-analysis with MDD vs. control subjects (Du et al. 2012; Bora et al. 2012b), consistent gray matter reductions in MDD patients were identified in the bilateral subgenual anterior cingulate cortex (ACC) in both studies. Additionally only in the Du et al. meta-analysis (2012) were there differences in the right middle and inferior frontal gyrus, right hippocampus, and left thalamus. These areas are also affected in schizophrenia and BD, but probably to a lesser extent. Direct comparisons between the three disorders are urgently needed. We would hypothesize that the affected regions roughly overlap and correlate with disease severity (functional outcome) and neurocognitive dysfunctions across the three diagnostic groups.
13.2.5 Effects of Antipsychotic Medication on Volume Changes
Medication might alter the natural course of volume changes, i.e., volume differences between patients and controls could be due to neurodevelopmental insults, the natural course of illness, and/or antipsychotics. Although this is of great importance, it is only very rarely addressed in MR imaging studies, because of the difficulty in controlling for medication. Thus, the available data is extremely limited, populations are usually small, and findings must be interpreted with caution. Four reviews have qualitatively compared the structural integrity of various brain regions in treatment-naive patients, following short-term treatment administration and after long-term treatment (Moncrieff and Leo 2010; Navari and Dazzan 2009; Scherk and Falkai 2006; Smieskova et al. 2009). Notably, these reviews are of lower quality, predominantly because they report highly inconsistent data, often from insufficiently controlled studies or studies with small samples, and they use heterogeneous outcome measures or drug exposures. Furthermore, these reviews are presented in a narrative format that is susceptible to reporting bias and unable to be qualitatively assessed according to GRADE criteria. The available evidence is particularly conflicting for comparisons across medicated and unmedicated patients in early psychosis. Most consistent evidence supports increased basal ganglia volume following treatment with typical antipsychotics. However, atypical medications have been associated with both increases and reductions of basal ganglia volume, and other inconsistent findings of increased and decreased subcortical regions (including the hippocampus) have been reported for patients receiving typical antipsychotics. In long-term antipsychotic-medicated patients, effects of switching neuroleptics have been examined longitudinally. Switching from typical to atypical medication reduced basal ganglia and thalamus volume, but no difference was reported in ventricular or whole brain volume. Some evidence pointed to other antipsychotic class-specific changes, for example, longitudinal changes following typical antipsychotic administration but not following atypical administration. Nonetheless, over time, the differences between the two types of medication become less clear (Smieskova et al. 2009). Linear associations reported between reductions of regional brain volume and increasing antipsychotic exposures could represent a modulatory effect of the medication on brain structure but could also reflect a more severe course of illness requiring higher cumulative medication doses (Navari and Dazzan 2009). Two more recent original studies that had not been included in the above meta-analyses also reported conflicting results, with one study showing volume increases (van Haren et al. 2011) and the other decreases (Ho et al. 2011).
For first-episode patients, a voxel-based meta-analysis (Fusar-Poli et al. 2011a, b) compared medication-naive patients with healthy controls and reported GM reductions of superior temporal and insular cortices and cerebellum. However, another voxel-based meta-analysis explicitly considered the effect of medication status in FES (Leung et al. 2011), where reductions in insula, anterior cingulate cortex, middle and inferior frontal and precentral gyri, uncus/amygdala, and superior temporal gyrus were found in both medicated and unmedicated FES patients compared to healthy controls. Medicated FES patients were additionally characterized by reductions in the superior frontal gyri, inferior temporal gyrus, PCC, claustrum, cerebellum, and caudate. Additional reductions in unmedicated FES patients were located in medial frontal gyri, thalamus, and parahippocampus.
In summary, the evidence of antipsychotic medication on MRI volume changes is unclear. Volume increases and decreases probably interact in a complicated way with the individual course of illness. In general, it is yet not clear what kind of volume changes, decreases or increases, are potentially “good” or “bad” for the individual patient.
13.3 White Matter Changes Through the Course of Schizophrenia
13.3.1 White Matter Changes in Chronic Schizophrenia
White matter structure and integrity can be investigated with diffusion tensor imaging (DTI) and VBM using magnetic resonance imaging. Investigations in schizophrenia have identified compromised white matter integrity (Kubicki et al. 2007). Ellison-Wright and Bullmore (2009) conducted an ALE analysis of fractional anisotropy changes identified by DTI and identified two large clusters of reductions in patients with schizophrenia compared to controls, in the deep frontal and deep temporal white matter. In an ALE analysis of whole brain VBM studies, two small clusters of reduced white matter in the frontal lobe, including left medial frontal gyrus and right dorsolateral prefrontal cortex, as well as small clusters of reduced white matter in the left and right internal capsule were identified (Di et al. 2009). A comparison between VBM and fractional anisotropy analyses in white matter using SDM meta-analysis suggested that fractional anisotropy may be more sensitive to identifying changes in white matter (Bora et al. 2011). The VBM comparisons identified white matter reductions in temporal white matter including the internal capsule, a finding that was mirrored and extended to the genu of the corpus callosum and medial frontal regions bilaterally (Bora et al. 2011). Evidence from a recent meta-analysis of longitudinal volumetric studies in chronic schizophrenia suggests that these white matter changes show a progressive course over a follow-up period between 1 and 10 years and that this progress affects the frontal, temporal, and parietal white matter volume (Olabi et al. 2011).
13.3.2 Diffusion Tensor Imaging (DTI) in Patients with First-Episode Schizophrenia
There are subtle anomalies of white matter brain morphology in patients with schizophrenia which are already present at the onset of the disease, i.e., in first-episode patients, but have also been found in patients in their first episode of BD (Kempton et al. 2008; Pfeifer et al. 2008). A recent meta-analysis aimed to compare gray and white matter volume reductions, as detected by MRI, in first-episode patients with schizophrenia or BD to address the question of neuroanatomical specificity of these changes (De Peri et al. 2012). When first-episode BD and schizophrenia patients were conjunctly compared with healthy controls, a significant reduction of gray and white matter volume was found in the first-episode patients. The meta-analysis of studies comparing patients with first-episode schizophrenia and BD to healthy controls separately revealed gray matter volume deficits to be more prominent in first-episode schizophrenia patients, whereas white matter volume reduction was more pronounced in first-episode bipolar patients. However, as sample sizes were notably larger in the case of first-episode schizophrenia as compared to first-episode BD, it remains unclear whether this difference may be attributable to differences in statistical power between the meta-analyses of schizophrenia or BD and healthy controls.
Studies investigating white matter integrity as inferred by DTI mainly report abnormalities in the frontal, frontotemporal, and fronto-limbic connections, with tracts including the superior longitudinal fasciculus (Federspiel et al. 2006; Karlsgodt et al. 2009, 2008; Pérez-Iglesias et al. 2010), uncinate fasciculus (Kawashima et al. 2009; Luck et al. 2011; Price et al. 2008), and corpus callosum (Cheung et al. 2008; Dekker et al. 2010; Federspiel et al. 2006; Pérez-Iglesias et al. 2010). These anomalies seem to be associated with the exposure to antipsychotic medication and duration of treatment (Peters et al. 2008; Szeszko et al. 2008; White et al. 2011). However, all DTI studies of antipsychotic-naive patients with first-episode schizophrenia, to date, have reported widespread as opposed to localized FA changes, suggestive of extensive structural disconnectivity associated with illness onset, before the initiation of antipsychotic treatment (Cheung et al. 2008, 2011; Pérez-Iglesias et al. 2010).
13.3.3 Diffusion Tensor Imaging (DTI) in Ultrahigh-Risk Subjects
Schizophrenia has been found to involve cortico-cortical disconnectivity, both in terms of functional connectivity between different brain regions (McGuire and Frith 1996) and in terms of neuroanatomical alterations underlying the functional changes, particularly in white matter tracts connecting the frontal and temporal lobes (Ellison-Wright and Bullmore 2009). In line with the neurodevelopmental hypothesis of schizophrenia, reduced white matter volume and integrity have also been found in early and subclinical stages of the disorder, i.e., in first-episode patients (Gasparotti et al. 2009) and subjects at ultrahigh risk (Carletti et al. 2012). Most DTI studies comparing UHR subjects to healthy controls identified white matter abnormalities in the frontal (Bloemen et al. 2010; Karlsgodt et al. 2009; Peters et al. 2009) and temporal connections in UHR individuals (Bloemen et al. 2010; Jacobson et al. 2010). A recent multimodal MRI/EEG study, using VBM to identify volumetric changes in a sample of 39 UHR subjects compared to 41 healthy control subjects, found WM volume changes in the right frontal, temporal, and parietal regions that were associated with P300 amplitude in the two groups (Fusar-Poli et al. 2011a, b). Of the 39 UHR subjects, 26 % developed a psychotic illness within the follow-up period of 2 years. The subgroup in whom psychosis subsequently developed had a smaller volume of white matter underlying the left precuneus and the right middle temporal gyrus and increased volume in the white matter underlying the right middle frontal gyrus as compared to those who did not develop psychosis. A second study looking at longitudinal outcome in UHR subjects using DTI also reported temporal WM changes, with both increased (left medial temporal lobe) and decreased (left superior temporal lobe) fractional anisotropy (FA) being found in subjects who converted to psychosis compared to those who did not (Bloemen et al. 2010), indicating that the medial temporal lobe has an important role in the progression from a high-risk state to frank psychosis. Despite the small number of studies using DTI in UHR subjects, these findings of WM alterations in frontal and temporal regions in UHR relative to control subjects suggest that these regions might be indicators of conferred risk of developing schizophrenia. This hypothesis is further supported by a recent study investigating the time course of WM changes by using DTI to study UHR subjects before and after the onset of illness and comparing WM DTI properties of UHR subjects (n = 32) to those of patients with FEP (n = 15) and healthy controls (n = 32) (Carletti et al. 2012). At baseline, FA was lowest in FEP subjects, highest in healthy controls, and intermediate in the UHR group in two clusters. The first cluster comprised voxels in areas corresponding to the splenium and body of the corpus callosum, the left inferior and superior longitudinal fasciculus, and the left inferior fronto-occipital fasciculus. The second cluster included the right external capsule, the retrolenticular part of the right internal capsule, and the right posterior corona radiata. A follow-up scan was performed after 28 months, a period in which eight of the 32 UHR individuals had developed psychosis. As opposed to the findings of both decreased and increased FA in the temporal lobe in the prospective DTI study by Bloemen et al. (2010) mentioned above, this longitudinal analysis revealed a progressive reduction in FA in the left frontal WM in those UHR subjects who developed schizophrenia that was not evident in UHR subjects who did not make a transition. This difference in findings may be due to methodological differences between the two studies (e.g., prospective vs. longitudinal approach, age differences between the UHR samples, potentially confounding effects of medication). In summary, the available data suggest that the UHR stage is associated with WM changes in areas that have also been implicated in FES and chronic schizophrenia. There is now also first evidence that the onset of psychosis in UHR subjects may be associated with a longitudinal progression of abnormalities in the left frontal WM.
13.4 fMRI Findings in Schizophrenia
13.4.1 fMRI in Chronic Schizophrenia
fMRI has been extensively used to study the neurobiological basis of schizophrenia and a wide variety of paradigms has been applied. In the following section, we focus on fMRI findings of working memory (WM), executive functioning, and social cognition, as these are among the domains most severely affected in schizophrenia. We summarize the available evidence from studies across different stages of the illness, focusing on those that did not pool patients in different stages of illness, but studied UHR, FES, and CS samples separately.
13.4.1.1 Working Memory
During WM tasks, several studies found marked differences in neural activation across several modalities of presentation. In a multicentric study, several components (as identified by ICA) differed between healthy subjects and patients with chronic schizophrenia (n = 130 and 115, respectively) (Kim et al. 2009). One component (C23) consisted of the ACC, left prefrontal cortex, and left inferior parietal cortex (see Fig. 13.6). Other areas displaying group differences were the superior and medial frontal cortex, the parahippocampal cortex, and parts of the temporal lobe.
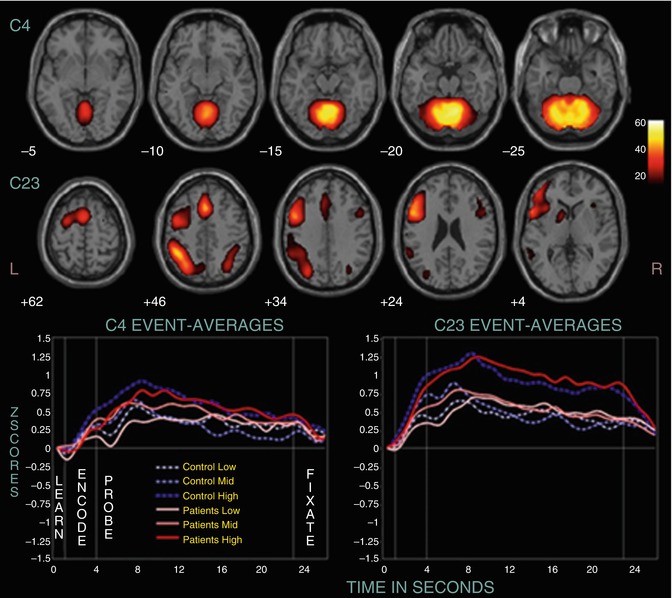
Fig. 13.6
Two positively modulated components (C4 and C23). Displayed are selected slices from each component thresholded at p < 1.0 × 10⁻¹³, FDR, along with their event-related averages (Kim et al. 2009)
In a similar study, differences in temporal profiles of WM-related components were found in subjects with CS and controls (Meda et al. 2009). This was particularly pronounced for left-lateralized networks. In another study, reduced functional connectivity of the left Sylvian-parietal-temporal area and left anterior insula during auditory WM encoding was found in 14 patients with CS compared to healthy controls (Hashimoto et al. 2010). This reduction in functional connectivity was not observed for visual stimuli.
As WM and its underlying neural correlates is the most severely impaired domain in schizophrenia, it has been the target of interventions, e.g., cognitive remediation training. In one such study, the bilateral frontopolar cortex and ACC were found to show signs of plasticity induced by remediation training (Haut et al. 2010) (see Fig. 13.7).
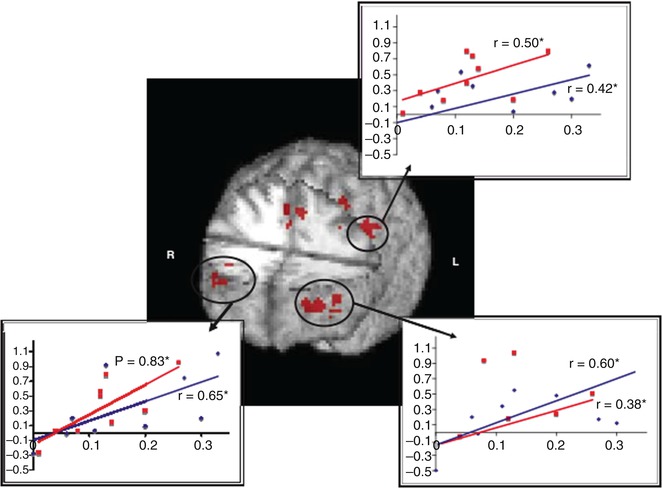
Fig. 13.7
Regions of overlap in the three-way interaction (load by time by group) between both the word and picture WM tasks showing activity increases in bilateral frontopolar regions, anterior cingulate cortex, and left dorsolateral/dorsal prefrontal cortex. Significant correlations between improved behavioral performance (x-axis, percentage of increase) and increased functional activation (y-axis, percentage of signal change) are also shown. Word 2-back is represented in red and picture 2-back in blue (Haut et al. 2010)
To summarize, the available evidence on brain activation dysfunctions in CS during WM suggests a widespread network comprising the ACC as well as lateral prefrontal and parietal areas is affected in patients.
13.4.1.2 Executive Functions
In an exemplary study on executive function, the neural correlates of discrimination of novel or old visual stimuli, four groups were investigated (healthy, UHR, FES, CS; Morey et al. 2005) (see Fig. 13.8). It could be shown that especially the anterior cingulate, as well as additional prefrontal areas, is involved in this task. These areas show decrements in all groups compared to healthy subjects.
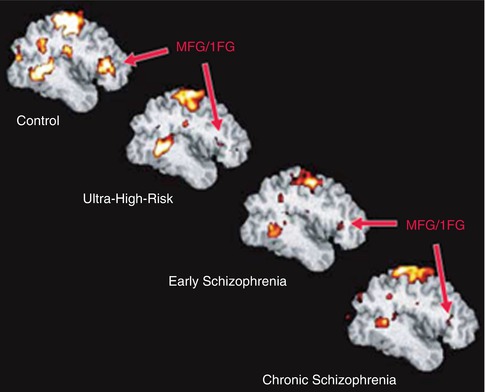
Fig. 13.8
Group-averaged, target-related prefrontal activation in control, ultrahigh-risk, early, and chronic groups. IFG inferior frontal gyrus, MFG middle frontal gyrus (Morey et al. 2005)
To summarize, the available evidence on brain activation dysfunctions in CS during executive function suggests that medial and lateral prefrontal cortices are affected in patients.
13.4.1.3 Social Cognition
In chronic schizophrenia, processing of emotional faces is impaired, and patients already show difficulties in processing neutral faces (Surguladze et al. 2006) (see Fig. 13.9). In a study with 11 chronic patients, compared to healthy controls, face-processing areas such as the fusiform gyrus and the parahippocampal gyrus were hyperactivated in patients while processing neutral faces.
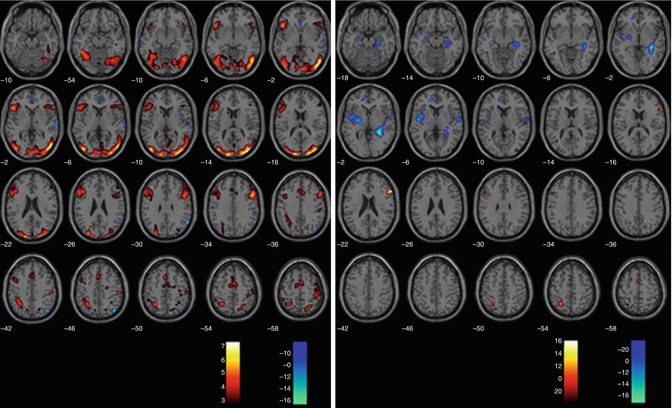
Fig 13.9
Processing of sad vs. neutral faces (SPM2, repeated measures ANOVA, p < 0.005 uncorrected). Illustrated are the contrasts sad > neutral (red/yellow) and neutral > sad (blue/green) in controls on the left and in UHR subjects, respectively, on the right (Seiferth et al. 2008)
In a social appraisal task (Taylor et al. 2011), 22 patients with CS depicted greater activations for social vs. gender judgments of negative faces than healthy subjects. These hyperactivations were found in the ACC, superior medial gyrus, inferior temporal and parietal cortex, as well as precuneus, which were also correlated with poor social cognition and poor social adjustment. As can be seen from these two studies, in CS, face processing is already disturbed for neutral faces and is also characterized by abnormal recruitment of networks involved in social appraisal.
To summarize, the available evidence on brain activation dysfunctions in CS during social cognition suggests that the medial temporal cortex (including the hippocampus) and prefrontal (including ACC) and parietal areas (including the precuneus) are affected in patients.
13.4.2 fMRI in the Ultrahigh-Risk Stage
13.4.2.1 Social Cognition
Although research has highlighted that early social functioning may be associated with an increased risk of developing a psychotic disorder (Malmberg et al. 1998; Cannon et al. 1997


Related posts:

Stay updated, free articles. Join our Telegram channel
Full access? Get Clinical Tree
