Fig. 1
Histology of the thymus. a The thymus of an infant viewed under low-power microscopy shows the lobulated appearance as well as the clear delineation between cortex and medulla. b On higher power, the Hassall’s corpuscles are seen with surrounding thymocytes. Reproduced from http://www.dartmouth.edu/~anatomy/Histo/lab_6/lymphoid/DMS117/popup.html, by permission of Dr. Rand S. Swenson, MD, PhD, Dartmouth Medical School
1.4 Function
The thymus is one of the central lymphoid organs and plays a key role in cellular immunity via the generation of mature, antigen-specific T-cells. Pro-thymocyte precursor cells migrate from the bone marrow into the thymus, which serves as the site of T-cell “education” and maturation. Via highly complex signaling pathways, the thymocytes develop into physiologically useful T-cells that are ideally able to respond to a given foreign pathogen while recognizing and remaining tolerant of normal host cells. Throughout life the thymus serves as the site of T-cell differentiation and maturation, typically beginning this process after the first few months of life and peaking in early/mid childhood. Because we do not require an ever-increasing T-cell immune repertoire, the need for continuous generation of T-cells plateaus, and the thymus begins to undergo a gradual process of atrophy and involution in the second decade of life.
1.5 Anatomy
The thymus is a bilobed organ located in the midline behind the sternum and anterior to the pericardium, heart, and great vessels. The thymus has a soft, pliable texture and drapes over the structures of the mediastinum. On gross inspection, the thymus during infancy is pink due to the rich vascular supply but becomes progressively more yellow due to accumulation of fat. Loose connective tissue surrounds both lobes. Each lobe is composed of multiple lobules, the septations of which extend to the corticomedullary junction, so that the medulla is contiguous throughout each lobe (Safieddine and Keshavjee 2011).
The blood supply to the thymus derives from three principle sources: the superior thymic artery, a branch of the inferior thyroid artery; the lateral thymic artery, a branch of the internal mammary artery; and the posterior thymic arteries, branches from the aorta and brachiocephalic artery (Safieddine and Keshavjee 2011). The veins draining the thymus follow the interlobar septa and fuse along the posterior venous plexus, which in turn drains into the brachiocephalic vein (Safieddine and Keshavjee 2011). Variably, the superior aspect of the thymus may drain into the inferior thyroid vein (Safieddine and Keshavjee 2011). The blood supply of the thymus is shown in Fig. 2.
Fig. 2
Illustration of the arterial blood supply and venous drainage of the thymus. Reproduced from Safieddine and Keshavjee 2011, with permission from Elsevier Limited, Oxford, UK
The thymus weighs approximately 13–15 g at birth, increasing to approximately 25–45 g at puberty when it attains its maximum weight (Safieddine and Keshavjee 2011). Subsequently the thymus begins its gradual involution, with an average weight of approximately 6 g by age 70 (Safieddine and Keshavjee 2011). On cross-sectional imaging, the infant thymus has a quadrilateral shape with convex margins. As the child ages and the thymus involutes, the margins of the thymus become concave and assume the triangular configuration typically seen in adults. The thickness of the left lobe of the thymus can be used as an indicator of thymic enlargement, with a maximum dimension of 18 mm perpendicular to the axis of the aortic arch in patients younger than 20 years of age (Restrepo et al. 2005).
2 Imaging Appearance
The thymus can be evaluated by a variety of imaging modalities including chest radiography (CXR), fluoroscopy, ultrasound, computed tomography (CT), magnetic resonance imaging (MRI), and nuclear medicine.
2.1 Chest Radiography
Familiarity with the wide range of appearances of the normal thymus gland on chest radiography is important for all radiologists. In infants and young children, the thymus can be impressively large on frontal radiographs. The classic “sail” sign, a sharply demarcated pointed base seen most frequently along the right inferior margin of the thymus gland, is actually found in only 5 % of children (Fig. 3a). The wave sign, the smooth undulation of the thymus as it interdigitates along the anterior costal margin, is more frequently seen but is less striking (Fig. 3b). To potentiate the wave sign, decubitus views can be used as a problem-solving tool for determining the etiology of anterior mediastinal mass. In most instances the thymus is seen simply as a smoothly marginated, low-density soft tissue causing widening of the superior mediastinum. This is in contrast to pathologic masses, which commonly have irregular or lobular margins and cause mass effect on adjacent structures, rather than smoothly conforming to the available space in the mediastinum. The thymus becomes less evident on chest radiographs beginning around 2 years of age and typically is not seen in children over 8 years of age (Arthur 2000). In cases of a particularly unusual appearance of the thymus, further evaluation can be obtained with other imaging modalities as described below.
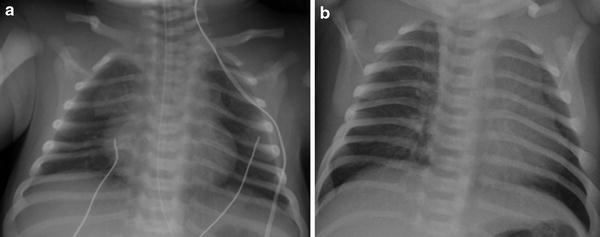
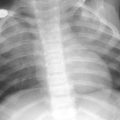
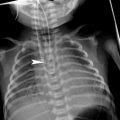
Fig. 3
Sail sign and wave sign. a AP radiograph of the chest in a neonate demonstrating a bilateral sail sign. b AP radiograph in a neonate demonstrating a wave sign along the left thymic border as it interdigitates along the anterior costal margin
2.2 Ultrasound
Ultrasound is a useful tool in the evaluation of the thymus in infants and young children due to its lack of ionizing radiation and its real-time imaging capabilities. Even after the thymus is no longer apparent radiographically, it may still be visible with ultrasound (Adam and Ignotus 1993). A high frequency, linear transducer works best in the neonatal population with lower frequency transducers used in the older age groups. A variety of approaches can be used in the infant including subxyphoid, parasternal, suprasternal, and transcostal windows (Mong et al. 2012). However, as ossification of the manubrium and sternum progresses, a suprasternal approach provides the best acoustic window.
In the neonate and young child, the thymus has a distinctive sonographic signature making it identifiable when present in abnormal locations. The thymus has a heterogeneous, but uniform echotexture, and is predominantly hypoechoic relative to the liver, thyroid, and spleen, with punctate and linear echogenic foci secondary to the fat present (Fig. 4) (Mong et al. 2012; Newman 2011; Kim et al. 2000). As the patient ages, the thymus becomes more homogeneous and echogenic due to increased fat content. It should have a smooth contour due to the capsule surrounding each lobe with no compression of the surrounding structures. During real-time scanning, the thymus should change shape in response to respiratory and cardiac motion reflecting its soft, pliable nature, which further helps to delineate it from a pathologic mediastinal mass.
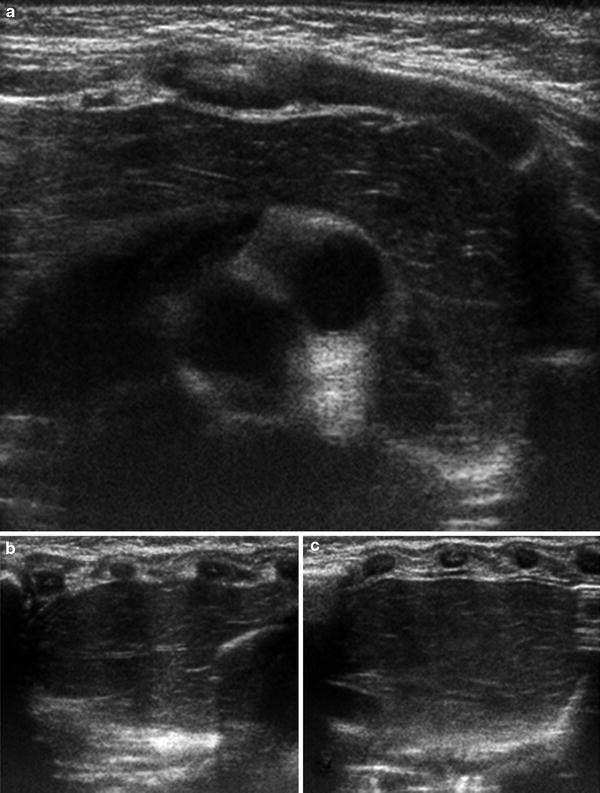
Fig. 4
Normal sonographic appearance of the thymus. Transverse (a) and sagittal ultrasound images of the right (b) and left (c) lobes of the thymus from an infant demonstrating the normal hypoechoic echotexture with scattered echogenic lines due to the interspersed fat. Note on transverse image that the thymus drapes over the mediastinal structures without causing any mass effect. On the sagittal images, the thymus has an undulating contour beneath the ribs, the sonographic equivalent of the wave sign
Particularly in younger children, ultrasound can also be used in the evaluation of thymic masses. Ultrasound can also be used for real-time guidance of biopsies of suspected thymic masses.
2.3 Fluoroscopy
Fluoroscopy is of limited use in the dedicated evaluation of the thymus. However, knowledge of the expected fluoroscopic appearance of the thymus can be useful during routine examinations such as airway fluoroscopy and upper GI examinations. As on chest radiography, the thymus is seen as a soft tissue density in the anterior mediastinum. Its size and shape should vary with respiration, and it should never exert substantial mass effect on any of the mediastinal structures, i.e., displacement of a contrast filled esophagus should not be attributed to a normal thymus.
2.4 Computed Tomography
CT provides excellent visualization of the thymus and thymic pathology. However, given concerns about radiation risk from CT scanning, this modality should be used judiciously in characterizing abnormalities of the thymus. The thymus can typically be seen in the anterior mediastinum on CT imaging throughout childhood, and is still visible in most patients up to the age of 30 years. On CT imaging performed without intravenous contrast administration, the thymus has a homogeneous appearance that, compared to cardiac and chest wall musculature, is hyperdense in infancy and nearly isodense later in childhood (mean Hounsfield Unit values ranging from 80.8 in infancy to 56.4 at 14 years of age) (Sklair-Levy et al. 2000). It demonstrates homogeneous enhancement on post-contrast images. The attenuation of the thymus declines with increasing age as it becomes increasingly replaced with fat (Sklair-Levy et al. 2000).
On cross-sectional imaging, the appearance of the thymus is consistent with its radiographic appearance. The thymus has a quadrilateral configuration with bulging contours in infants and young children, becoming progressively more triangular in shape with concave margins in older children and adolescents (Fig. 5). The relationship of the thymus to its surrounding structures, particularly the presence of compression or invasion in the setting of thymic pathology, is well seen with CT. Internal heterogeneity, calcifications, fat, or abnormal enhancement are also well depicted with CT. For operative planning purposes, the location of the feeding and draining vessels can be delineated on contrast-enhanced CT imaging.
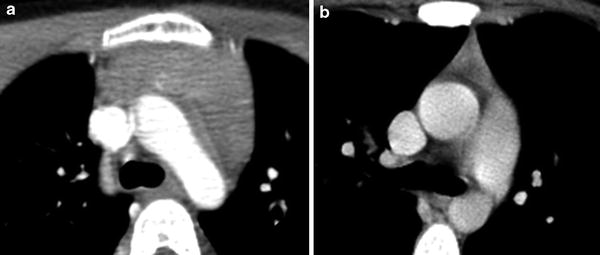
Fig. 5
Age-related changes in normal CT appearance of the thymus. a Axial CT image with contrast in a young child demonstrates the normal quadrilateral configuration of the thymus with bulging contours. b Axial CT image with contrast in a young adult demonstrates the normal triangular configuration that the thymus assumes as it involutes
2.5 Magnetic Resonance Imaging
MRI can be a valuable tool in the evaluation of patients with suspected thymic pathology. However, due to its relatively greater expense, study length, and variable need for sedation, MRI is not typically the initial choice of imaging modality for evaluation of the thymus. The MRI appearance of the thymus varies as it involutes. Prior to fatty infiltration, the signal intensity of the thymus is slightly greater than that of muscle but less than that of fat on T1-weighted images, while on nonfat suppressed FSE-T2 weighted images (Henkelman et al. 1992), the signal intensity is increased relative to muscle, but lower than subcutaneous fat (Fig. 6) (Molina et al. 1990). As the thymus becomes progressively more fatty its signal intensity approaches with that of pure fat (Ackman and Wu 2011; Siegel et al. 1989). As on CT, there is homogeneous enhancement of the normal thymus on post-contrast images. Due to the presence of fat within non-neoplastic thymus, opposed phase imaging has been studied to differentiate between normal thymus/thymic hyperplasia and a solid mass lesion (Inaoka et al. 2007). This imaging technique has not been studied on the thymus of younger (<16 years of age) patient populations. However, it may be of value since small quantities of fat coexisting with nonfatty soft tissue in the same imaging voxel can be detected by opposed phase imaging, and could provide a sensitive means of characterizing normal thymic tissue in younger age groups, where the quantity of thymic fat is less abundant.
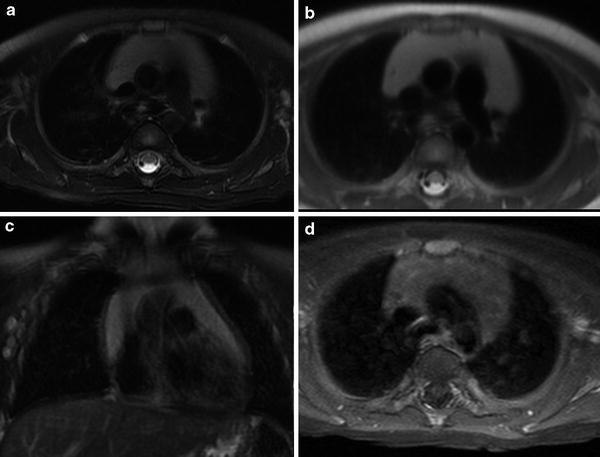
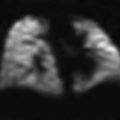
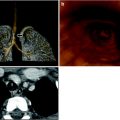
Fig. 6
Normal MRI appearance of the thymus. a Transverse T2-weighted image with fat suppression shows a homogeneously high-signal intensity thymus draping over the mediastinal structures. b Transverse T1-weighted image shows a hyperintense structure that is slightly less intense than the nearby subcutaneous fat. c Coronal T2-weighted image with fat suppression shows an arrowhead configuration of the thymus. d Post-contrast axial T1-weighted image with fat suppression shows homogeneous uptake of gadolinium contrast material within the thymus
Coil selection depends on the child’s size. Both T1- and T2-weighted images in at least two planes should be used for routine evaluation of the thymus. The sagittal plane in particular can nicely demonstrate the anteriorly positioned normal thymus. In order to achieve high-quality MRI images of the thymus, one must keep in mind the proximity of the thymus to the moving heart and lungs. If close scrutiny of the thymus is desired, cardiac gating and breath-hold sequences may be needed. The phase-encoding direction should be in the transverse medial–lateral rather than anterior–posterior direction to prevent motion artifact from interfering in the evaluation of the thymus as shown in Fig. 7.
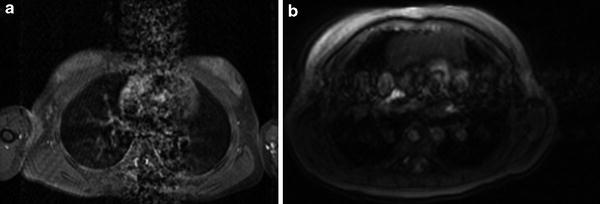
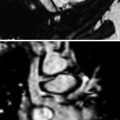
Fig. 7
Extensive motion artifact on MRI. a Axial T2-weighted image of the chest with extensive motion artifact obscuring the thymus. b Axial T2-weighted image in a different patient with the phase-encoding direction switched from the anterior–posterior to the medial–lateral transverse plane allowing better visualization of the thymus
2.6 Nuclear Medicine
i.
F-18 FDG PET—On PET imaging in young patients, the thymus is seen as an FDG-avid, bilobed organ with an arrowhead configuration. The degree of FDG uptake varies greatly between normal individuals, but typically decreases with age. Prior studies have demonstrated uptake in the thymus gland in all patients younger than 12 and in 50 % of patients between 12 and 17 years of age (Connolly and Connolly 2003). Rebound thymic hyperplasia, which is discussed later in this article, can demonstrate FDG avidity independent of patient age. Correlation with cross-sectional imaging, typically CT images acquired as part of integrated PET/CT examinations, can be helpful to differentiate normal from abnormal FDG uptake.
ii.
Other radiopharmaceuticals—In addition to FDG, the normal thymus can take up a variety of radiotracers. Due to the presence of the sodium-iodide symporter, the thymus has normal low-level avidity for radioactive iodine (I-123 and I-131) and uptake in this gland should not be mistaken for ectopic thyroid tissue (Connolly and Connolly 2003). In-111 pentetreotide can also localize to the thymus due to the presence of somatostatin receptors; the number of these receptors declines with age with a corresponding decrease in the avidity of this agent (Connolly and Connolly 2003).
Gallium scintigraphy with 67Ga-citrate enjoyed widespread use for imaging infection and was an effective agent for staging and assessing response in patients with lymphoma (Even-Sapir and Israel 2003). With the increasing use of FDG-PET, gallium scintigraphy is now rarely used. Thymic uptake of gallium has been noted in up to 61 % of children less than 2 years of age, both in patients with lymphoid and nonlymphoid tumors (Connolly and Connolly 2003). As age increases, the degree of gallium uptake in the thymus diminishes, although thymic uptake of gallium may still be seen in adults (Connolly and Connolly 2003). Gallium uptake can also be seen in the setting of thymic hyperplasia and can persist for several years after the inciting event.
3 Congenital and Developmental Anomalies and Variants
The thymus has a variety of normal configurations that should not be mistaken for pathology. Accessory thymic tissue, which is thymic tissue that arises from rests of thymic cells along their path of normal embryological descent, is considered distinct from ectopic thymic tissue which arises in abnormal locations, such as the base of the skull, presumably due to aberrant migration pathways (Tunkel et al. 2001).
A rare congenital variant is the retrocaval thymus which, as the name would suggest, is posterior extension of the thymus behind the superior vena cava (SVC). This variant can displace the SVC laterally and mimic a mediastinal mass or right upper lobe collapse on chest radiographs. Cross-sectional imaging demonstrates the posterior extent of the normal-appearing thymic parenchyma as seen in Fig. 8, helping to distinguish this normal variant from a pathologic posterior mediastinal mass.
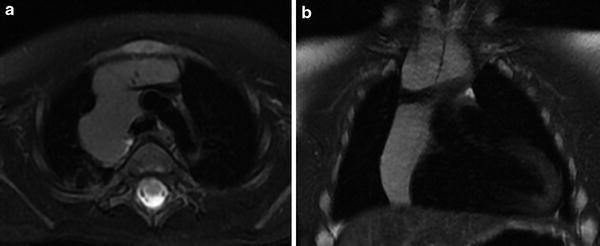
Fig. 8
Retrocaval and suprasternal extension of the thymus. a Axial T2-weighted image with fat suppression shows posterior extension of the normal thymus with splaying of the SVC. b Coronal T2-weighted image in the same patient shows superior extension of the thymus above the clavicles
A much more frequently encountered variant is suprasternal extension of the thymus. In up to 2/3 of infants and young children, the thymus can extend superiorly into the neck to the level of the thyroid gland (Fig. 9). While the normal thymus is not commonly appreciated on routine physical examination, during times of increased intrathoracic pressure the suprasternal extension of the thymus can become more apparent, which may be alarming to parents and clinicians alike given its mass-like appearance (Costa et al. 2010). Ultrasound should be the initial imaging modality of choice in this clinical situation. Not only is ultrasound effective at demonstrating normal ectopic thymic tissue, it is also useful for the detection of other mass lesions in the head and neck. As expected, the sonographic appearance of suprasternal thymic tissue is characteristic of normal thymus. By simply redirecting the transducer, this superiorly positioned tissue can be followed inferiorly and is usually contiguous with the normal thymus located in the anterior-superior mediastinum. In more challenging cases, a limited MRI examination can also be used to demonstrate superior extension of normal thymic tissue.
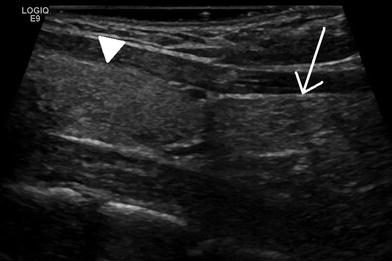
Fig. 9
Normal superior extension of the thymus to the inferior margin of the thyroid. Sagittal ultrasound image of the neck in a 21-year-old female. The thymus (arrow) extends superiorly and abuts the inferior margin of the thyroid gland (arrowhead). The thymus is more echogenic in this young woman than in the infant in Fig. 4 due to the presence of more fat
This normal superior extension of the thymus must be distinguished from accessory cervical thymic tissue which can be found anywhere along the path of thymic descent from the angle of the mandible to the superior mediastinum. It is thought to occur secondary to an arrest in its normal descent or sequestration of a thymic rest during its caudal migration (Kaufman et al. 2001). This is an uncommon entity with a reported incidence of 1:6800 (Bale and Sotelo-Avila 1993) and classically presents as a painless, unilateral mass. This accessory tissue can be solid or cystic. Ultrasound is the primary diagnostic tool in children, with MRI or CT reserved for more difficult or equivocal cases. The aberrant solid thymic tissue will have the same echotexture, CT attenuation, and MRI signal intensity as the normally positioned thymus (Fig. 10). The cystic form arises from a patent thymopharyngeal duct and is typically unilocular and located along the carotid sheath. Depending on its size and location, this entity may be difficult to differentiate from other cystic neck masses and may require histologic sampling for a final diagnosis.
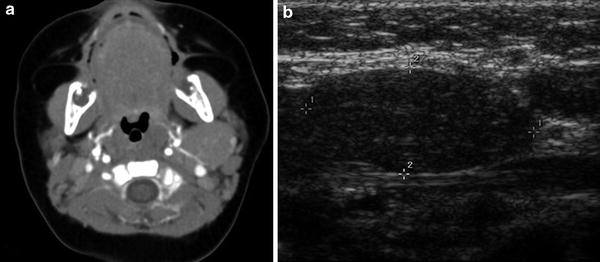
Fig. 10
Ectopic thymic tissue in an infant. a Axial CT image with contrast demonstrates a smoothly marginated, homogeneously enhancing soft tissue mass posterior to the left mandible. b Sagittal ultrasound image in the same patient shows an ovoid mass with the classic echotexture of the thymus
In addition to normal variations in size and location, the thymus may be pathologically hypoplastic, or even aplastic, in the setting of certain immunodeficiency syndromes (Yin et al. 2001). The two most common of these syndromes affecting the thymus are Severe Combined immunodeficiency (SCID) and DiGeorge syndrome. In SCID, the absence of functional T-cells to populate the thymus leads to failed thymic development, with a resultant small dysplastic thymus. DiGeorge syndrome, in contrast, results from a chromosomal deletion that directly affects thymic development from its third and fourth pharyngeal pouch anlagen, with abnormal T-lymphocyte maturation resulting from the absence of the normal thymic environment. As expected, both of these syndromes clinically present with cellular immune dysfunction. In DiGeorge syndrome, other abnormalities include hypocalcemia due to the concomittant maldevelopment of the parathyroid glands (which also arise from the third and fourth pharyngeal pouches). On all imaging modalities, minimal, if any thymic, tissue will be present. This can be most striking on neonatal chest radiographs, where the mediastinal silhouette may adopt an almost adult configuration due to the absence of the expected broad thymic shadow (Fig. 11). The corollary to this observation is that the presence of a normal thymic shadow in a child being evaluated for immunodeficiency virtually excludes SCID and DiGeorge syndrome from the list of considerations (Buckley 2006).
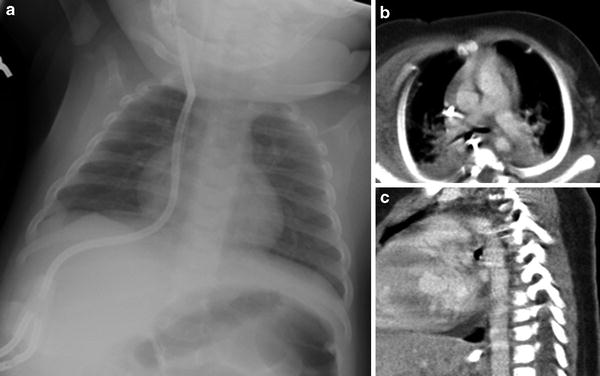
Fig. 11
Aplasia of the thymus in an infant with severe combined immunodeficiency (SCID). a AP chest radiograph shows narrowed mediastinum suggestive of hypoplastic or aplastic thymus. Axial (b) and sagittal (c) CT images with contrast, obtained for evaluation of recurrent pneumonias, confirms the absence of thymic tissue
Another cause for an absent or diminutive thymus on imaging studies is a history of surgery via a median sternotomy approach, most frequently seen in children with congenital heart disease. As a part of this approach, to gain access to the heart, the bulk of the thymus is removed, as seen in Fig. 12. In a study by MacDonald et al., less than a third of patients who had undergone surgery with this type of approach had a thymus that was visible by MRI (MacDonald and Mackenzie 2009).
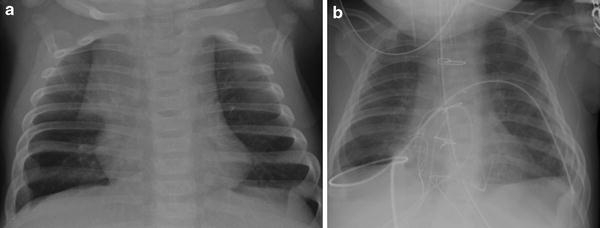
Fig. 12
Surgical resection of the thymus during heart surgery. a Preoperative AP chest radiograph shows a normal-appearing thymus with a sail sign. b Postoperative AP chest radiograph obtained 1 day later shows absence of a thymic silhouette
At the opposite end of the spectrum, rarely congenital thymic hyperplasia can occur, both sporadically and in patients with Beckwith-Weideman syndrome (Balcom et al. 1985). This is distinct from rebound thymic hyperplasia discussed later in this chapter.
4 Benign Thymic Masses
4.1 Thymic Cysts
Thymic cysts can either be congenital or acquired. As described previously, congenital thymic cysts arise from a patent thymopharyngeal duct and reside along the carotid sheath. If large enough, they can be detected in utero on both ultrasound and MRI. These cysts are lined by ciliated epithelium, typically unilocular, and contain simple fluid if drained (Restrepo et al. 2005; Petroze and McGahren 2012; Mortelmans and Hermans 2005). They rarely measure greater than 6 cm (Hegde et al. 2012), and in most cases they are asymptomatic and are discovered incidentally on imaging. They may present as a base of neck mass if there is sufficient suprasternal extension of the cyst, as shown in Fig. 13. If they are large enough, they can present with chest pain, hoarseness, or dyspnea from mass effect. These masses are often occult on chest radiographs; however, if they are large enough they can be seen as a smoothly marginated mass arising from the upper mediastinum. On ultrasound imaging, they will present as an anechoic mass and may contain a variable amount of debris depending on the presence of inflammation or prior hemorrhage. CT will show a round, fluid-attenuation mass with no solid components, as shown in Fig. 14. On MRI, simple thymic cysts will typically have high-signal intensity on fluid sensitive sequences (Fig. 13). No solid components should be present, and there should be no internal contrast enhancement.
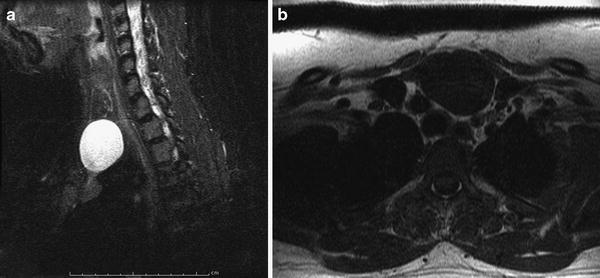
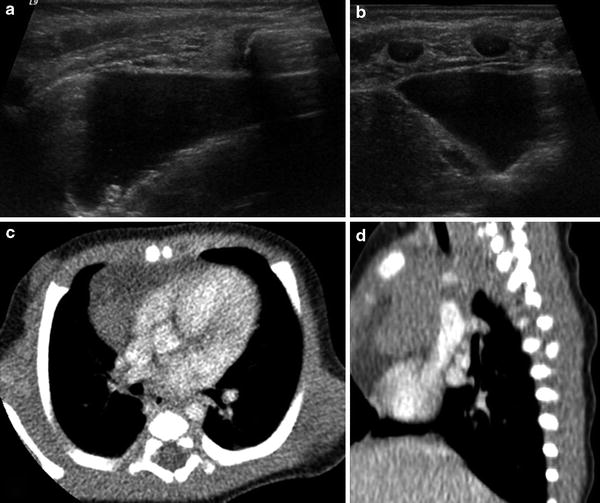
Fig. 13
Thymic cyst presenting as a base of neck mass. a Sagittal T2-weighted image of the neck shows an ovoid T2 hyperintense lesion extending to the base of the neck. b Axial T1-weighted image shows a homogeneously low-signal intensity lesion contiguous with the normal-appearing thymus in the superior mediastinum, compatible with a thymic cyst with suprasternal extension
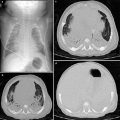
Fig. 14
Thymic cyst diagnosed prenatally and confirmed after birth. Axial (a) and sagittal (b) ultrasound images demonstrate a thin-walled lesion that contains anechoic fluid and is contiguous with normal-appearing thymus. c, d Axial (c) and sagittal (d) CT images with contrast show a low attenuation structure abutting normally enhancing thymic tissue
Acquired cysts vary in etiology. Typically, they are postinfectious but can be seen in the setting of prior neoplasm, radiation, or autoimmune diseases such as myasthenia gravis. Children with HIV infection can also present with massive cystic enlargement of the thymus related to aberrant immunoregulation (Kontny et al. 1997). These acquired cysts are more complex than the simple congenital cysts described above. They often have thicker cyst walls, internal septations, and contain a more gelatinous liquid (Restrepo et al. 2005). They tend to be multilocular and can range in diameter from a few millimeters to over 15 cm (Hegde et al. 2012). The complex nature of the acquired cysts is reflected in their appearance on imaging studies. On ultrasound imaging they range from anechoic to hypoechoic, with a variable number of septations. CT or MRI will also demonstrate a variable number of septations that may enhance. On MRI, these lesions may be higher in signal intensity on T1-weighted images and lower signal intensity on T2-weighted images, as compared to simple cysts, reflecting the complex nature of the fluid, often due to higher protein content. Regardless of the etiology of these cysts, they are uniformly benign in the pediatric population (Petroze and McGahren 2012).
Related posts:
Stay updated, free articles. Join our Telegram channel

Full access? Get Clinical Tree


