The olfactory system and especially the olfactory bulb (OB) as the first relay in the olfactory system represent highly plastic structures. For example, OB volume partly reflects the degree of afferent neural activity. Research indicates that smell deficits leading to a reduced sensory input result in structural changes at the level of the OB. Reduced OB volumes also may be considered characteristic of parosmia. Apart from discussing the clinical implications of these findings, the radiologic basics for assessment of olfactory-eloquent structures are addressed in detail.
The olfactory nerve (ON) is the sum of the axons of all olfactory receptor neurons that are located in the nasal mucosa on both sides of the nasal cavity. The ganglion of the ON collects all these sensory afferents and is called the olfactory bulb (OB) or, less frequently, olfactory peduncle. It constitutes the primary olfactory cortex.
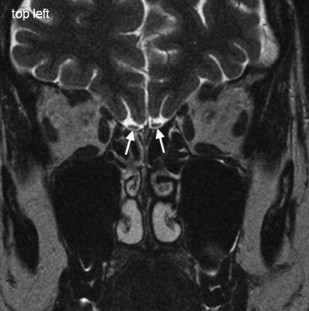
The OB is located bilaterally above the cribriform plate of the anterior skull base, the perforations of which let pass the ON. The OB is aligned in a strict ventrodorsal orientation and has an average volume of 125 ± 17 (mean ± standard deviation) mm 3 . The olfactory sulcus (OS) of the frontal lobe is visible above the OB and the olfactory tract (OT). The morphology of the OS seems dependent on the presence of the OB. The OT connects the OB with the perforate substance. It runs from anteromedial (OB) to posterolateral (perforate substance) and its cross-sectional area is approximately one tenth of the cross-sectional area of the OB. Adding up the volumes of OB and OT results in an average of up to 160 mm 3 . This volume showed a considerable variation depending on age.
In vivo evaluation of the ON in humans and its functional characterization are possible using nasal endoscopy, electrophysiologic recordings like the electro-olfactogram, or biopsies in concert with immunohistochemical investigations but not with currently available routine imaging methods. Because first brain images of living humans have been acquired by MRI at very high field strengths (ie, 9.4 T, with high spatial resolution [voxel size: 0.048 mm 3 ]), visualization of the ON seems foreseeable. The evaluation of the nasal mucosa preferably is done using MRI with T2-weighted sequences in a coronal image orientation. In many centers, the nasal mucosa is investigated by CT, especially before surgery, because this method provides additional information on bony nasal structures. With respect to the radiation exposure of CT (effective dose approximately 3 to 10 mSv) and the clinical question, MRI should be considered in every patient, because this method generates images without radiation exposure.
Perforations of the cribriform plate (with an average diameter of a single perforation well below 1 mm) may be visualized using recent CT systems, although as yet this is not shown convincingly. Such images are not possible with 1.5-T MRI systems but may be achieved using field strengths above 3 T, although susceptibility artifacts are a major concern.
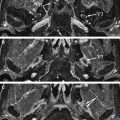
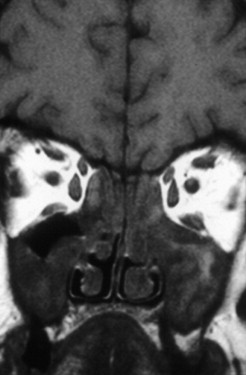
Adequate visualization of human OB and OT in vivo is accessible only with MRI ( Fig. 1 ). Because of the size and orientation of these structures, however, they often are not visible on routine clinical imaging of the brain and skull. Pathologies affecting the ON, OB, and OT are given in Table 1 .
| Congenital | Inflammation | Tumor, Benign | Tumor, Malignant |
|---|---|---|---|
| Aplasia of OB | Acute and chronic rhinosinusitis | Papilloma | Squamous cell carcinoma |
| Kallmann’s syndrome | Mucor mycosis | Osteoma | Adenoidcystic carcinoma |
| Cyclops | Aspergillosis | Neurogenic tumor | Aesthesioneuroblastoma |
| Cystic fibrosis | Meningioma | Rhabdomyosarcoma | |
| Mucocele | Giant cell tumor | Metastases | |
| Tuberculosis | Fibrous dysplasia | Lymphoma | |
| Nerve sheath tumor | Osteosarcoma | ||
| Adenoma | PNET |
Technical considerations (MRI)
Field Strength
MRI requires signals from hydrogen atoms. The amount of hydrogen atoms contributing to an MRI signal can be increased at higher field strengths. Therefore, visualization of small structures, such as OB and OT, should be done at 3 to 7 T. Because these systems are not widely available, the imaging technique at 1.5 T was optimized, using advanced receiver coil techniques or by selected imaging sequences. The techniques discussed herein were used at 1.5 T.
Receiver Coils
When MRI first was used to visualize the OB, mostly small loop coils were used, which were placed on the nasion and enabled comparatively high-resolution images of the OB. Because of the limited field of view (depth penetration) of these coils, the OT and the posterior parts of the olfactory system could not be visualized. New head coils (eg, multichannel head array coils) allow a comparable or even better spatial resolution and provide information from the entire brain. Furthermore, these coils allow morphologic and functional imaging (functional MRI) without new positioning of patients. Most of the images shown herein were acquired with an eight-channel head array coil.
Sequence Techniques
The discussion of sequence techniques focuses on methods applied to imaging of the OB and OT. Two tissue characteristics may be elaborated, the T1 time, using T1-weighted sequences, and the T2 time, using T2-weighted sequences. Different sequence types (eg, turbo spin echo [TSE], constructive interference in steady state precession [CISS], and turbo fast low-angle shot [TFL]) are capable of generating different contrasts between tissues. Depending on the desired tissue contrast, some sequences may be optimized for 3-D imaging, whereas other sequences preferably are used for 2-D imaging.
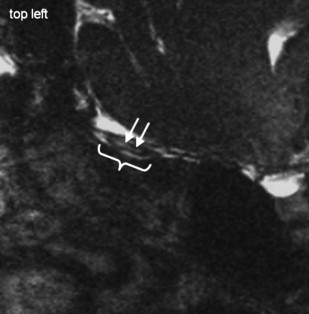
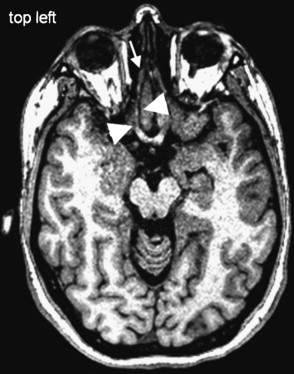
For high-resolution imaging of the OB and OT, 2-D data acquisition preferably is done using TSE techniques, which generate a voxel size of 0.405 mm 3 . Thus, accurate volumetry of the OB is feasible. 2-D TSE sequences should be acquired in coronal slice orientation (maximum slice thickness 2 mm) covering the entire anterior skull base and the pituitary gland. To visualize pathology within the OB, a sequence with stronger T2 weighting (eg, CISS) seems advantageous ( Figs. 2 and 3 ). This technique generates bright signals from cerebralspinal fluid (CSF) and very low signal intensities from all other tissues and structures (ie, high contrast for the sensitive visualization of structures surrounded by CSF). The disadvantage of this sequence is the poor contrast between OB, OT, gray matter, air, and bone. Consequently, it may not be ideal for volumetric purposes, because the differentiation of the cribriform plate, the OB and OT, and the brain is difficult.
In cases where the entire olfactory system, including nasal cavity and posterior structures, is investigated, 3-D imaging with isotropic voxels (isotropic voxels reveal identical lengths of the margins of every voxel in all three spatial orientations) covering the entire cranium is preferred. The acquired data sets allow for multiplanar reformation in any orientation. Table 2 shows important technical parameters of recommended sequence designs.
| T1 TSE (2-D) | T1 TFL (3-D) (MP-RAGE) | T2 TSE (2-D) | T2 TSE (3-D) | CISS (3-D) | |
|---|---|---|---|---|---|
| TR (ms) | 400 | 2180 | 4800 | 2500 | 12.2 |
| TE (ms) | 14 | 3.2 | 148 | 354 | 6.1 |
| TI (ms) | — | 1100 | — | — | — |
| Bandwidth (Hz/pixel) | 70 | 160 | 130 | 930 | 130 |
| Slice thickness (mm) | 2 | 0.8 | 2 | 0.8 | 0.7 |
| In plane resolution (mm 2 ) | 0.45 × 0.45 | 0.8 × 0.8 | 0.45 × 0.45 | 0.8 × 0.8 | 0.7 × 0.7 |
| Voxel size (mm 3 ) | 0.405 | 0.512 | 0.405 | 0.512 | 0.343 |
| Acquisition time (min) | 14 | 6 (PAT factor 2) | 8 | 11 | 6 |
For clinical purposes (eg, excluding a frontal meningeoma or other tumors), the imaging protocol includes T1-weighted 2-D imaging before and after intravenous application of contrast material. Imaging should be done using axial, coronal, and sagittal planes to provide sufficient information for preoperative planning. The application of fat suppression techniques creates improved delineation of tumors that expanded beyond the cranium and invaded the subcutaneous fat. Diffusion-weighted imaging should be done before application of contrast material and might provide additional information on the microstructure of tumors, hence narrowing the differential diagnosis.
Olfactory nerves
The nasal cavity harbors the olfactory neurons. From the roof of the nasal cavity they send their axons in bundles (called the ONs) through the cribriform plate to the OB, where they synapse with mitral cells. In the nasal cavity, the most frequent cases of olfactory loss are inflammatory disorders (eg, sinonasal disease [SND] with and without polyposis) ( Fig. 4 ). In addition, respiratory problems may prevent airflow to the olfactory cleft, thus producing olfactory loss. More recently, localized inflammation of the olfactory cleft with consecutive thickening of the mucosa is described as a possible cause of olfactory loss.

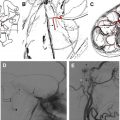
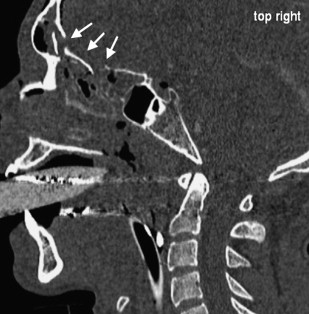
Acute obstructions of the nasal cavity may result from acute trauma and may modify olfactory sensations temporarily or permanently. Bleedings after midfacial fractures may obstruct the nasal cavity, but causative fractures of the anterior skull base may cause permanent injuries of the ON, OB, and OT ( Fig. 5 ).
Olfactory nerves
The nasal cavity harbors the olfactory neurons. From the roof of the nasal cavity they send their axons in bundles (called the ONs) through the cribriform plate to the OB, where they synapse with mitral cells. In the nasal cavity, the most frequent cases of olfactory loss are inflammatory disorders (eg, sinonasal disease [SND] with and without polyposis) ( Fig. 4 ). In addition, respiratory problems may prevent airflow to the olfactory cleft, thus producing olfactory loss. More recently, localized inflammation of the olfactory cleft with consecutive thickening of the mucosa is described as a possible cause of olfactory loss.
Acute obstructions of the nasal cavity may result from acute trauma and may modify olfactory sensations temporarily or permanently. Bleedings after midfacial fractures may obstruct the nasal cavity, but causative fractures of the anterior skull base may cause permanent injuries of the ON, OB, and OT ( Fig. 5 ).

Imaging of the olfactory bulb
Congenital Anosmia
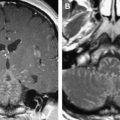
Largely based on the work by Yousem and colleagues, magnetic resonance–based imaging of the OB has found its way into clinical practice ( Fig. 6 ). Today the diagnosis of isolated congenital anosmia or Kallmann’s syndrome centers on MRI. In addition, assessment of OB volume is applied in subjects who have CHARGE syndrome where the olfactory system is compromised.