Vascular parameter
Definition
Regional blood flow (BF)
Flow rate of whole blood through the vasculature of a defined tissue volume or mass
Regional blood volume (BV)
Volume of flowing whole blood within the functioning vasculature of a defined tissue volume or mass
Extraction fraction (EF)
Fraction of the whole blood contrast agent that is transferred to the extravascular-extracellular space during a single passage of the contrast agent
Permeability surface area product (PS)
Product of permeability and total surface area of capillary endothelium in a unit volume or mass of tissue and reflects the total diffusional flux across the capillaries
Regional blood flow, blood volume and vascular leakage parameters within the tumour are interrelated but may vary with the underlying tumour environment. For example, areas of high blood flow, blood volume and leakage may reflect well-perfused areas with presence of shunting and areas of angiogenesis; low blood flow, blood volume and low-leakage areas may represent areas of poor vascularisation ± necrosis; low blood flow, blood volume and high-leakage areas may represent poor perfusion areas with angiogenesis.
15.2 Biological Correlates of Tumour Vascular Parameters
Tumour vascular parameters derived via kinetic modelling provide physiological information regarding regional blood flow and thus the delivery of oxygen and nutrients to the tumour; regional tumour blood volume, which reflects functional ‘vascular density’; and vascular leakage from the capillaries or neovessels. In general tumours demonstrate higher vascularisation than normal tissues. These parameters may also provide a surrogate measure of tumour angiogenesis and perfusion-related hypoxia.
15.2.1 The Tumour Vasculature
The development of a viable tumour blood supply is essential to support tumour growth and proliferation [2]. This may occur through sprouting from pre-existing vessels (vasculogenesis), de novo vascular formation through recruitment of circulating endothelial progenitor cells and vessel co-option. The tumour microenvironment including hypoxia, glucose deprivation and low pH plays an important role in the initiation of tumour angiogenesis via the activation of oncogenes and/or inactivation of tumour suppressor genes [3].
In terms of morphology, the tumour vasculature appears functionally distinct and spatially heterogeneous. The vasculature lacks the usual hierarchical branching pattern and in general demonstrates greater vessel density at the tumour periphery. The vessels themselves are thin and tortuous, characterised by a relatively high endothelial cell proliferation rate, incomplete endothelium, relative absence of smooth muscle or pericyte investiture and hyper-permeability resulting in high interstitial fluid pressure.
15.2.2 Immunohistochemistry Correlates of Dynamic Contrast-Enhanced CT
Microvessel density (MVD) and vascular endothelial growth factor (VEGF) are commonly used immunohistological measures of angiogenesis. In a number of cancers including lung, renal, gastrointestinal and pancreatic cancer, associations have been found between MVD and VEGF and various perfusion CT parameters. Most of the evidence relates to lung cancer. Typically these correlations have been moderate: histological analysis has been varied based on different number of ‘hotspot’ counts or from random areas of the whole tumour. There have also been negative studies, in part reflecting the heterogeneity of analyses and immunohistological biomarkers used [4].
With respect to the lung, peak CT enhancement in patients with solitary pulmonary nodules has been correlated significantly with both MVD and VEGF, irrespective of the benign or malignant nature of the nodules [5]. In patients with operable NSCLC, either CT peak enhancement, blood flow, blood volume or permeability surface area product has been shown to demonstrate a moderate correlation with MVD: Li et al. showed that CT regional blood flow correlated with CD34 expression (r = 0.715; P = <0.001) assessed in 6 tumour regions: central (3) and peripheral (3) [6]. Ma et al. showed that CT peak enhancement and regional blood flow correlated with CD34 expression assessed in 5 hotspots in VEGF positive but not VEGF negative tumours [7]. Similarly Sauter et al. have found that there is a moderate correlation between extraction fraction and blood flow and CD34 [8], while Spira et al. have found a positive association between MVD and blood flow and volume [9]. Peak enhancement, blood flow and relative blood volume have also been shown to be significantly higher in VEGF positive compared to VEGF negative tumours [7, 10].
There have also been several pathological correlative studies in other abdominally sited cancers. In renal cell cancer an initial study in 24 patients showed a moderate correlation (r = 0.60) between peak enhancement and hotspot MVD (CD34) Wang et al. [11]. More recently a further small study (n = 10) where patients with renal cell cancer underwent volumetric perfusion CT prior to surgery has confirmed that regional blood flow and blood volume correlated significantly with MVD (CD34; r = 0.600–0.829); however, K trans only demonstrated moderate correlations with MVD in non-necrotic areas (r = 0.550) [12].
Moderate correlations (r = 0.42) between regional blood volume and hotspot MVD (CD34) have been found in gastric adenocarcinoma [13]. Similarly in colorectal cancer, moderate correlations between regional blood volume and permeability surface area product and non-hotspot MVD (CD34) have been shown [14]. In pancreatic adenocarcinoma moderate correlations (r = 0.49) have also been found between MVD and peak enhancement in the arterial phase [15].
Perfusion CT parameters may also inform on the presence of perfusion-related hypoxia. In lung cancer blood volume measurements have also been found to be negatively correlated to an exogenous marker of hypoxia (pimonidazole: r = −0.48) [16]. However, one of the challenges of clinico-pathological correlative studies is the comparison of in vivo with ex vivo findings. Tacelli et al. have showed that areas of low regional tumour BV but high PS have higher CD34 expression (assessed in 3 hotspots in the non-necrotic tumour portion) than areas of high regional tumour BV and high PS: 72.1 versus 47.9, P = 0.038 [17], which they postulated could be related to the degree of tumour interstitial pressure.
15.3 Technical Aspects
15.3.1 Patient Preparation
As with any contrast-enhanced CT study, patients should be well hydrated and have a normal renal function. For studies involving abdominal organs such as the liver, pancreas and bowel, recent food intake may affect organ perfusion, and patient fasting may be appropriate. If an oral contrast agent is required, water is preferred to positive contrast agents. An anti-peristaltic drug (e.g. glucagon or hyoscine-N-butyl bromide) is advisable for DCE-CT studies of the bowel and/or pelvis.
Keeping the patient well informed concerning the CT acquisition will improve the quality of the study. Clear instructions should be given, for example, regarding the need to stay still, breathing instructions for breath-held studies, cessation of swallowing during the acquisition for head and neck studies and potential effects induced by the contrast agent including a hot flush.
15.3.2 Contrast Agent Administration
The dose and manner in which contrast agents are administered will influence parameter quantification. Kinetic modelling benefits from a bolus injection of contrast agent and an injection rate of at least 4 mL/s via a large bore intravenous cannula, usually sited in the antecubital fossa. Injection rates beyond 10 mL/s appear to confer no additional benefit for quantification. The total injected iodine dose should be within the range of 12–18 g. It is important that the iodine concentration administered is not less than 300 mg/mL. If iodine concentrations are >350 mg/mL, the contrast agent must be warmed to body temperature prior to injection, as the higher viscosity will slow the actual injection rate. The volume of contrast agent will depend on the iodine concentration used (Table 15.2) [1].
Table 15.2
Recommended volume of contrast agent
Iodine concentration (mg/mL) | Volume (mL) |
|---|---|
300 | 40–60 |
350 | 35–50 |
370 | 32–48 |
400 | 30–45 |
15.3.3 CT Data Acquisition
With current state-of-the-art technology, an entire organ such as the brain, lungs, liver, spleen or kidney may be encompassed with a high spatial resolution and a high temporal acquisition sampling rate. A typical CT acquisition is shown in Fig. 15.1.
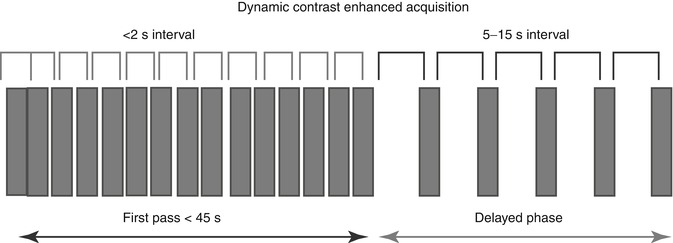

Fig. 15.1
Schema showing typical perfusion CT acquisition for tumour evaluation
To ensure accurate quantification, a sampling rate of 2 s or less should be used. For the initial perfusion phase, an acquisition duration of 45 s is adequate; for the interstitial phase at least 5 additional time points are recommended, the sampling rate ranging from 5 to 15 s depending on the kinetic model applied [1]. The change in blood vessel and tumour enhancement during this time, which is related to the passage of intravenous contrast agent between the intravascular and extravascular-extracellular space, provides the necessary data for quantification. As the concentration of iodine within blood vessels and tissues is proportional to the resultant increase in attenuation, temporal changes in attenuation can be analysed using standard kinetic models without prior conversion to iodine concentration.
15.3.4 Image Processing
15.3.4.1 Motion Correction and Image Registration
For target lesions located in motion susceptible sites, breath-holding during the first-pass study will reduce motion artefact and voxel displacement. For longer duration studies, motion correction/image registration may compensate for motion artefact, and this is incorporated into commercial software platforms, for example, based on a non-rigid deformable registration technique [18].
15.3.4.2 Quantification of Vascular Parameters
The vascular parameters which can be quantified include regional blood flow (BF), blood volume and extraction fraction or permeability surface area product.
Different mathematical models may be applied to derive these. Commonly used tracer kinetic modelling include (1) maximum initial slope, (2) Patlak and (3) distributed parameter analysis (Table 15.3).
Table 15.3
Summary of the commonly applied kinetic models
Kinetic model | Compartments | Parameter measured | Assumptions |
|---|---|---|---|
Johnson-Wilson distributed parameter | Dual | BF, BV, MTT, PS | Constrained IRF |
Patlak | Dual | EF, BV | One way transfer |
Well-mixed compartments | |||
Maximum slope | Single | BF | No venous outflow |
In practice quantification using commercial platforms requires a region of interest (ROI) to be placed within an input artery (to generate an arterial input function, AIF) and for the lesion(s) of interest. From the arterial and tissue enhancement time curve that are displayed by the software, quantitative parametric maps are generated (Fig. 15.2).
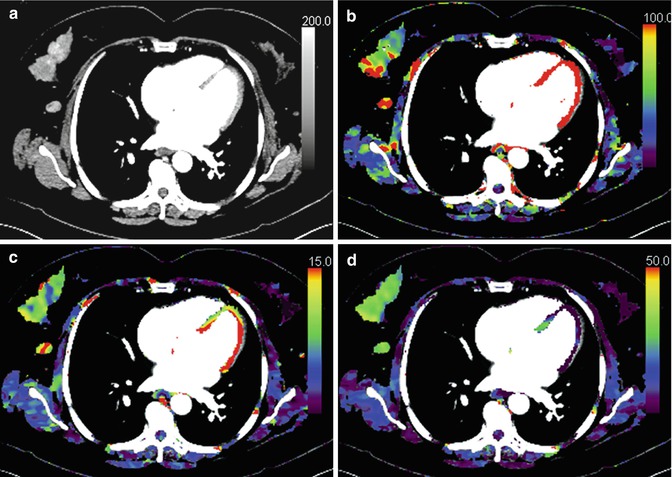

Fig. 15.2
Perfusion CT image of a right breast cancer (a) and corresponding parametric maps of regional blood flow (b), blood volume (c) and extraction fraction (d) are shown. The tumour demonstrates heterogeneous blood flow and blood volume
While volume-of-interest analysis, encompassing the whole tumour, may be the least susceptible to observer error and experience and provide a global evaluation of perfusion and angiogenesis; this may not best reflect the heterogeneity within a tumour, particularly if this demonstrates areas of necrosis, calcification or haemorrhage, as these are ‘averaged’ in the process (Fig. 15.3).
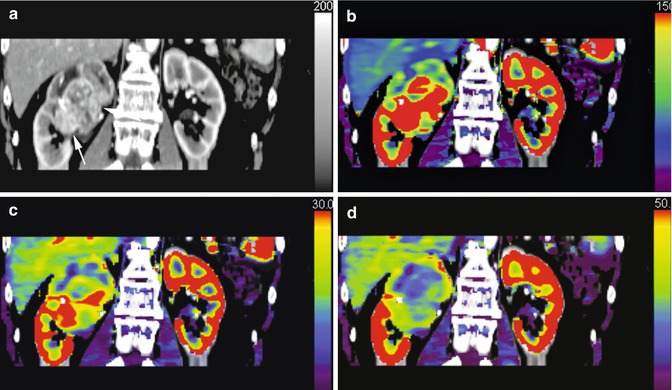

Fig. 15.3
Dynamic contrast-enhanced CT (a) and corresponding parametric maps of a large heterogeneous renal cancer are shown: regional blood flow (b), regional blood volume (c) extraction fraction (d)
In practice it is important to choose an appropriate target lesion(s). Ideally this should be >2 cm and not in close proximity to large vessels (e.g. superior vena cava or aorta), heart or diaphragm in order to reduce artefacts. For lesions located in motion susceptible sites, breath-holding techniques (± initial hyperventilation) and/or the use of motion correction/image registration will reduce motion artefacts. For target lesions located within the bowel, the use of a standard anti-peristaltic (Buscopan or glucagon) will reduce the motion related to peristalsis. It is also important to select an appropriate artery to derive the AIF. The vessel chosen must be of sufficient size to prevent partial voluming occurring secondarily due to pulsation or movement artefact (including peristalsis) or laminar flow within the vessel. If this is the case, this will influence and change the arterial time-attenuation curve. It is assumed that the arterial time-attenuation curve of the artery in the field of view is identical to the vessel supplying the tumour. This is only valid if there is no obstructive process or other significant feeding vessels.
15.4 Clinical Implementation
15.4.1 Quality Assurance and Quality Control
The ready availability of perfusion CT software on commercial reporting workstations has facilitated clinical implementation. However, in addition to standard quality assurance that tests the performance of the CT scanner, quality control procedures should be in place for perfusion CT, particularly where longitudinal studies are planned and robust quantification is required, for example, in the clinical trial setting [1]. Quality control refers to the processes needed to maintain quality. Standardisation of acquisition, analysis and reporting protocols should be implemented, where possible. These acquisition, radiation dose, data processing and reporting protocols should be recorded for each patient allowing audit to be undertaken. The use of phantom calibration, assessment of image quality (contrast to noise ratio) and, in clinical trials, central data review should be undertaken of at least 10 % of the dataset.
15.4.2 Radiation Dose
The cancer risk associated with perfusion CT has to be balanced against the potential benefits derived from quantification of tumour vascularity. Imaging should comply with the ALARA (A s L ow A s R easonably A chievable) principle. The radiation dose of a perfusion CT acquisition is dependent on the temporal frequency of the acquisition, volume of coverage, kilovoltage and milliampere selected [19]. The risk significance of a radiation exposure from DCE-CT will depend to some extent on the clinical circumstance. The risk of radiation exposure from perfusion CT, for example, will be relatively inconsequential in the context of radiation therapy.
The CT acquisition should be tailored to the research or clinical question or clinical context. A maximal acceptable dose should be assigned for the acquisition ensuring that satisfactory signal:noise characteristics can be obtained. In general it is good practice to ensure that a maximum effective dose of 20 mSv for a volume of tissue measuring 4 cm in the cranio-caudal direction is not exceeded [1]. The effective dose is obtained by multiplying the dose length product (DLP, mGy · cm) provided by the CT scanner and the appropriate conversion factor (mSvmGy−1 · cm−1). The DLP and CT Dose Index by volume (CTDIvol) of DCE-CT studies should be recorded in the patient record.
15.4.3 Measurement Reproducibility
Good measurement reproducibility is essential for the clinical application of any technique. Ideally the coefficient of variation should be less than 20 % [20]. This is particularly pertinent in oncological imaging for response assessment, where the differences in repeated measurements have to be smaller than the expected therapeutic effect. Usually, the more straightforward a measurement, the easier it should be to reproduce. With perfusion CT techniques, measurement reproducibility has been shown to be acceptable, with a coefficient variation of 13.2–35 % which has been reported for the cranial circulation of both animals and humans [21, 22] and coefficients of variation ranging from 14 to 24 % for tumours [23–25].
It is also important in the context of repeated measurements that intra- and interobserver variability are limited. In general intraobserver is better than interobserver agreement [26], in concordance with other studies of observer agreement using traditional morphological measures of response [27]. Where appropriate a single observer should analyse serial examinations in the same patient.
The tumour location, the tumour size, the acquisition protocol, the software programme and positioning of the arterial and tumour ROIs by individuals all contribute to observer variation [28]. For perfusion CT coefficients of variation have ranged from 2.5–9.5 % [29] to 14–20.8 % [30] in cranial studies and 3–13 % in a study of squamous cancers of the extracranial head and neck [31].
15.5 Clinical Applications
In oncological practice its main role remains the evaluation of the effectiveness of drugs which target the tumour vasculature, particularly in the context of clinical trials [32]. However, by reflecting perfusion and angiogenesis and exploiting the differences in perfusion parameters between tumour and normal tissues, perfusion CT may also assist lesion characterisation, delineation of tumour extent, tumour phenotyping and prognostication.
15.5.1 Response Assessment
Quantitative parameters derived from perfusion CT may be used to monitor the effects of a variety of treatments. These include chemotherapy with standard and novel agents (anti-angiogenic drugs, vascular disrupting agents, immunotherapy), radiotherapy and interventional oncologic procedures such as embolisation of the tumour vascular supply or radiofrequency ablation. Early evidence has shown that a common long-term effect of treatment is a reduction in perfusion CT parameters following treatment completion, although in the short term, there may be a variable vascular effect related to the therapeutic mechanism of action (Table 15.4).
Table 15.4
The acute and chronic vascular effects of therapy measured by perfusion CT
Therapy | Perfusion CT parameter | ||
|---|---|---|---|
Blood flow | Blood volume | Vascular leakage | |
Cytotoxic chemotherapy: short-term effects | Unchanged | Unchanged | Unchanged |
Cytotoxic chemotherapy: long-term effects | Decrease | Decrease | Decrease |
Unchanged | |||
Anti-angiogenics: short-term effects | Increase | Increase | Decrease |
Unchanged | Unchanged | ||
Anti-angiogenics: long-term effects | Decrease | Decrease | Decrease |
Vascular disrupting agents: short-term effects | Decrease | Decrease | Decrease |
Vascular disrupting agents: long-term effects | Increase | Increase | Increase |
Unchanged | Unchanged | Unchanged | |
Radiotherapy: short-term effects | Increase | Increase | Increase |
Radiotherapy: long-term effects | Decrease | Decrease | Decrease |
Interventional: radiofrequency ablation | Decrease | Decrease | Decrease |
Interventional: TACE | Decrease | Decrease | Decrease |
Absent | Absent | Absent | |
With standard chemotherapy, which affects actively replicating cells via DNA damage or interruption of DNA repair, this effect is thought to reflect the loss of angiogenic cytokine support following cell death [33]. With anti-angiogenic therapies, differing vascular effects may be seen depending on mechanism of action of the drug under investigation and timing of the scan. An initial effect may be a decrease in vascular permeability and reduction in interstitial fluid pressure, with normalisation of function of the vasculature resulting in a transient increase in tumour blood flow [34]. In the longer term, with subsequent pruning of the vasculature, a reduction in regional blood flow, blood volume and vascular permeability may be elicited. With vascular disrupting agents, which target the proliferating immature vasculature ± the mature vasculature, a rapid shutdown in tumour vascularisation may occur that is usually transient and reversible within 24–48 h. This may be followed by a rebound re-vascularisation [35


Stay updated, free articles. Join our Telegram channel

Full access? Get Clinical Tree


