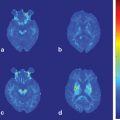
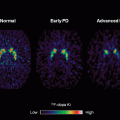
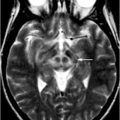
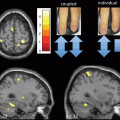
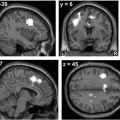
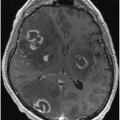
Fig. 4.1
The method of activation SPECT is shown. The task order of the sequence here is gait first followed by rest. The radiotracer (300 MBq of 99mTc-ECD) was administered when the experimenter judged that the gait of the subjects reached a steady state. The subjects kept walking for 5 min after tracer injection, and were moved onto a scanner bed after task completion. They were positioned under the guidance of a 3D laser-reference system and immobilized using a comfortable restraint device. The subjects remained supine on the scanner bed for the subsequent rest condition. They received additional radiotracer (500 MBq of 99mTc-ECD) in the resting condition and remained still for 5 min on the scanner bed in a supine position after tracer injection. The first and second doses of radiotracer and the corresponding scan times were adjusted to reduce subtraction errors between the first and second blood flow images. The order of task conditions was counterbalanced across subjects to reduce order effects. Perfusion images were analyzed using statistical parametric mapping (SPM). The images were corrected for the half-life and dose of the tracer, and perfusion images corresponding to the second task condition were created by image subtraction. Increases in cerebral perfusion during the walk condition compared with the rest condition were explored among all subjects, and then for each group separately
Gait Conditions
In our previous studies, we focused on studying subjects with idiopathic Parkinson disease (iPD) [1, 2] and those with vascular parkinsonism ascribed to age-related white matter changes (ARWMC) [3] in comparison to healthy volunteers. Therefore, we adopted a very slow treadmill speed of ~ 0.2 m/s, considering the worst performance among the subjects in the studies listed above. We recognized that walking at this speed might be unnatural for those who usually walk much faster in daily life, but modified conditions in accordance with the needs of the study and the conditions of the subjects.
It is important to control the effects of sensory stimuli as strictly as possible during the experiment. We chose walking on a treadmill, and the subjects were asked to hold the bars attached to a treadmill for safety, so the results might be affected by sensory inputs from upper extremities as described. Subjects were also asked to maintain fixation on a wall marked in front of them to exclude the effect of visual information from the moving treadmill. We considered that such an effect should be taken into account in the rest condition as well, hence the subjects were asked to open their eyes and stare at one point even during the scanning at rest.
SPECT Scanning
Blood pressure and pulse rate should be measured. These measurements should be taken just before the initiation and after the end of walking, and, at the start and end of the first and second SPECT scans. This procedure is necessary because the cerebral blood flow might be influenced by systemic hemodynamic changes. For example, when we are going to make a comparison among groups, such measurements will be necessary to show that the difference in activities acquired is not affected by differences in such hemodynamics at the system level. This would be especially important for studying gait disorders potentially accompanied by orthostatic hypotension .
Then, the subjects are asked to walk on a treadmill to become accustomed to walking in such a specialized environment. We place a venous line in the cubital vein located at the elbow. Subjects are asked to walk on the treadmill, and then the radiotracer (99 mTc-ECD or 99 mTc-HMPAO; Dosing: ~ 300 MBq) is injected after we deem that the subject has reached a steady gait.
Because the consecutive SPECT and subtraction technique encounters subtraction errors, the values of Rd (administered dose ratio of the second study SPECT against the first) and Rt (acquisition time ratio of the second study SPECT against the first) must be selected carefully [7]. The larger these values, the smaller the subtraction error. As for the gait activation , subject motion occurs between the two SPECT studies, and a large Rd will help savage the rest image by visual assessment without subtraction, because it diminishes the contamination of the first SPECT into the second. However, too large Rd results in longer time intervals between tracer injections. Such time intervals would be limited especially when we use the 99 mTc- HMPAO considering the deterioration in radiochemical purity. Based on these reasons, the Rd ranges from 1 to 4 in proportion to the Rt ranging from 2 to 1/3. For example, we injected 300 MBq for the first injection, and 500 MBq for the second injection. In this way, we can keep the scanning time to be the same between the two occasions. The radioactivity of the radiotracer to be administered is counted each time. For example, when we are going to analyze gait and rest conditions, the amount of radiotracers should be measured just before the first condition (gait or rest). The dosage should be corrected in accordance with the half-life of the tracer, and then adjusted again at the intermediate point between the start and end of the first SPECT scan (A1). After the first scan, the residual amount left in the injector should be counted and adjusted as above (B1). Then, the subtraction of B1 from A1 (A1 − B1) provides the radiotracer dosage injected at the first scan (D1). The same procedure should be repeated for the second condition (rest or gait) as well, and the first amount (A2) and the residual amount left in the injector (B2) should be measured and adjusted to the intermediate point. Then, subtraction of B2 from A2 (A2 − B2) provides the dosage at the second scan (D2). For the first (S1) and second (S2) images, a dose correction should be applied, i.e., S1/D1 and S2/D2 should be counted. Calculations of this kind can easily be done using the image calculator option provided with the statistical parametric mapping (SPM) software. Images such as S1/D1 and (S2/D2-S1/D1) can be used as a representative image of gait and rest respectively, or vice versa. This methodology is explained in Fig. 4.2.
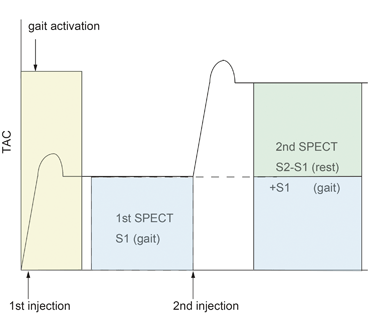
Fig. 4.2
The theory implied in the split-dose method is shown. This is the example with the sequence applying a gait condition followed by rest. The first image (S1) represents the activation of gait, and the second image (S2) represents that of rest plus gait as shown in the figure. With that, the S2-S1 should represent the rest. Thus, S1 and S2-S1 would be used as representative images of gait and rest, respectively, both of which would be subjected to the group analysis with statistical parametric mapping (SPM) after dose correction. TAC time-activity curve
The task order may induce a sequential effect that might influence the result. Therefore, we counterbalance this effect by applying a gait condition followed by rest in half of the subjects and rest followed by gait in the other half. When applying the former sequence, the image reflecting gait is acquired in supine position after the gait task, and the image reflecting rest is acquired soon afterward with the subject in the same position. In this way, the possibility that the location of the head would be drastically different is minimized. However, with the latter sequence, subjects have to walk on the treadmill after images reflecting rest are acquired, meaning they would need to go back to the scanner, raising the possibility that head position would be different. Thus, caution should be paid to any deviation in brain location. In our facility, we not only used laser pointers to keep the position of the head constant, but also attached tape to parts of the clothes or faces of the subjects to keep subjects in the same position.
Data Analysis
Analysis of the images can be done using SPM (Welcome Department of Cognitive Neurology, Institute of Neurology, University College of London; http://www.fil.ion.ucl.ac.uk/spm/) implemented on MATLAB (The MathWorks Inc., Massachusetts, USA) or similar software. Realignment of the two images, spatial normalization to a SPECT perfusion template, and smoothing are carried out for preprocessing. We adopt full-width at half-maximum (FWHM) of 8–10 mm or even more for a smoothing kernel, considering the spatial resolution of SPECT.
For statistical analyses, comparisons between images during gait and rest are performed for all subjects within a group, and then, between groups (e.g., disease group versus normal volunteer group). Age, gait analysis data, and other parameters might be employed as covariates as necessary. In our experience with healthy subjects, the activation pattern resulting from the contrast between walking and rest conditions mainly consists of three clusters. The first cluster is medial frontoparietal cortex centered at the supplementary motor area (SMA) together with primary sensorimotor cortex; the second is around the visual cortex; and the third is around the cerebellum. This activation pattern is quite robust for gait activation studies with SPECT and consistent across our studies even when we apply a strict threshold like family-wise error (FWE)-corrected p < 0.05 as long as we had ten or more subjects.
< div class='tao-gold-member'>
Only gold members can continue reading. Log In or Register to continue
Stay updated, free articles. Join our Telegram channel

Full access? Get Clinical Tree


