Principles and Technology of Two-dimensional Echocardiography
TWO-DIMENSIONAL ECHOCARDIOGRAPHY GENERATES DYNAMIC IMAGES of the heart from reflections of transmitted ultrasound. The echocardiography system transmits a brief pulse of ultrasound that propagates through and is subsequently reflected from the cardiac structures encountered. The sound reflections travel back to the ultrasound transducer, which records the time delay for each returning reflection. Since the speed of sound in tissue is constant, the time delay allows for a precise calculation of the location of the cardiac structures from which the echocardiography system can then create an image map of the heart. Not surprisingly, successful cardiac imaging requires a firm understanding of the interactions of sound and tissue. This chapter reviews the basic principles of ultrasound, its propagation through tissues, and the technologies which create moving images of the heart.
PHYSICAL PROPERTIES OF SOUND WAVES
Vibrations
Sound is the vibration of a physical medium. In clinical echocardiography, a mechanical vibrator, known as the transducer, is placed in contact with the esophagus (transesophageal echocardiography [TEE]), skin (transthoracic echocardiography), or the heart (epicardial echocardiography) to create tissue vibrations. The resulting tissue vibrations or sound waves consist of areas of compression (areas where molecules are tightly packed) and rarefaction (areas where molecules are dispersed) resembling a sine wave (Fig. 1.1).
Amplitude
The amplitude of a sound wave represents its peak pressure and is appreciated as loudness. The level of sound energy in an area of tissue is referred to as intensity. The intensity of the sound signal is proportional to the square of the amplitude and is an important factor regarding the potential for tissue damage with ultrasound. For example, lithotripsy uses high-intensity sound signals to fragment renal stones. In contrast, cardiac ultrasound uses low-intensity signals to image tissue, which produces only limited bioeffects. Since levels of sound pressure vary over a large range, it is convenient to use the logarithmic decibel (dB) scale:

where A is the measured sound amplitude of interest and Ar is a standard reference sound level, I is the intensity and Ir is a standard reference intensity.
More simply expressed, each doubling of the sound pressure equals a gain of 6 dB. The U.S. Food and Drug Administration (FDA) limits the maximum intensity output of cardiac ultrasound systems to be less than 720 W/cm2 due to concerns with possible tissue and neurologic damage from mechanical injury (resulting from cavitation or microbubbles caused by rarefaction) and thermal effects. The ALARA principle recommends that clinicians use exposure levels As Little As Reasonably Achievable to protect patients.
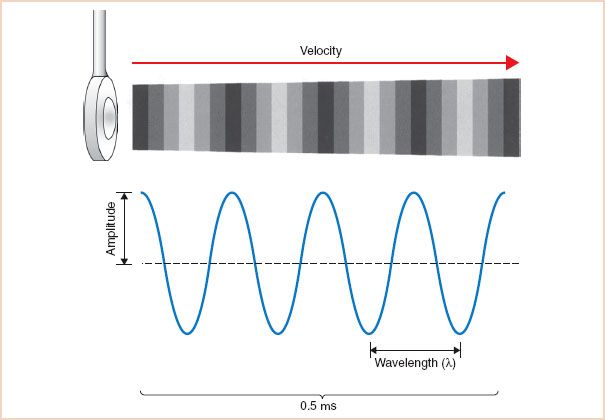
FIGURE 1.1 Sound wave. Vibrations of the ultrasound transducer create cycles of compression and rarefaction in adjacent tissue. The ultrasound energy is characterized by its amplitude, wavelength, frequency, and propagation velocity. In this example, four sound waves are shown in a period of 0.5 μs. The frequency can be calculated as 4 cycles divided by 0.5 μs and equals 8 MHz.
Frequency and Wavelength
Sound waves are also characterized by their frequency (f), or pitch, expressed in cycles per second, or Hertz (Hz), and by their wavelength (λ). These attributes have a significant impact on the depth of penetration of a sound wave in tissue and the image resolution of the ultrasound system.
Propagation Velocity
The travel velocity or propagation velocity of sound (v) is determined solely by the medium through which it passes. For example, the speed of sound in soft tissue is approximately 1,540 m/s. Velocity can be calculated as the product of wavelength and frequency:

It becomes apparent that the wavelength and frequency are necessarily inversely related:


Table 1.1 lists the corresponding sound wavelengths and frequencies commonly used in clinical ultrasonography.
Table 1.1 Corresponding Frequencies and Wavelengths in Soft Tissue

WHAT IS SO SPECIAL ABOUT ULTRASOUND?
Several favorable physical properties of ultrasound explain its usefulness in clinical imaging. Ultrasound is sound with frequencies greater than those of the audible range for humans (20,000 Hz). In clinical echocardiography, frequencies of 2 to 10 MHz are used. The high-frequency, short-wavelength ultrasound beam can be more easily manipulated, focused, and directed to a specific target. Image resolution also increases when higher-frequency sound waves are used (see later).
INTERACTIONS OF SOUND AND TISSUE
The propagation, or passage, of a sound wave through the body is markedly affected by its interactions with the various tissues encountered. These interactions result in reflection, refraction, scattering, and attenuation of the ultrasound signal. The exact manner in which sound is affected by the various tissues it encounters determines the resulting appearance of the two-dimensional image (Fig. 1.2).
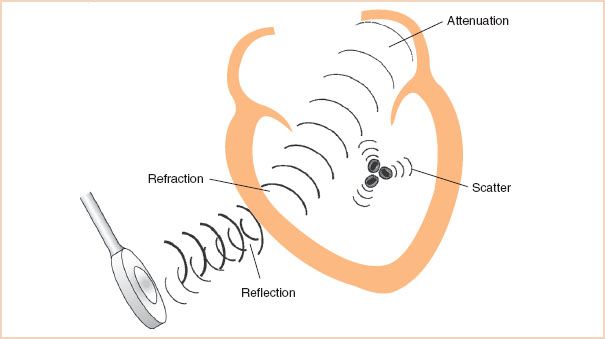
FIGURE 1.2 Interactions of sound and tissue. Traveling through various tissues, sound energy is altered by four major events. Specular reflection creates strong echoes directed back toward the transducer. Refraction bends the ultrasound beam directing it in a new path. As the ultrasound beam travels deeper in tissue, attenuation occurs as the beam is dispersed and the sound energy is converted to heat. Scattering reflections from small objects such as red cells disperse the sound energy in all directions.
TABLE 1.2 Acoustic Properties of Various Tissues

Reflection
Echocardiographic imaging depends on the transmission and subsequent reflection of ultrasound energy back to the transducer. A sound wave propagates through uniform tissue until it reaches another tissue type with different acoustic properties. At the tissue interface, the ultrasound energy undergoes a dramatic alteration, after which it can be reflected back toward the transducer or transmitted into the next tissue, often in a direction that deviates from the original course. Precisely how the ultrasound beam will be affected is predicted by factoring the acoustic properties of the tissues that create the interface and the angle at which the ultrasound beam strikes this interface.
The Tissue Interface: Acoustic Impedance
An important acoustic property of a tissue is its capacity for transmitting sound, known as acoustic impedance (Z). This property is largely related to the density (ρ) of the material and the speed which ultrasound travels (v):

As seen in Table 1.2, denser materials such as bones and fluids effectively transmit ultrasound, whereas air and lung tissue have a low level of acoustic impedance and are poor transmitters of sound energy. This property explains why an amplification system is required even for a small lecture hall, yet whales can hear sound over great expanses of the ocean.
When sound reaches an interface of two tissues of similar acoustic impedance, the ultrasound beam travels across the interface largely undisturbed. When the tissues differ in impedance, a percentage of the ultrasound energy is reflected and the remainder is transmitted. The larger the absolute difference in the levels of acoustic impedance across the interface, the greater the percentage of the ultrasound energy that is reflected. Reflection can be calculated by using the reflection coefficient (R):

The reflective properties of an interface are key factors in the imaged appearance of a structure. When the absolute difference between the levels of acoustic impedance of the two interfacing media is large, as when soft tissue interfaces with air or bone, more energy is reflected back to the transducer. These interfaces are represented by echo-dense or bright signals on the echogram. When the absolute difference is small, as when soft tissue interfaces with soft tissue, the interface will not appear as bright and may even be echolucent or dark.
Specular and Scattering Reflectors
The reflection of sound is also greatly affected by the size and surface of the tissue. Two types of reflection, specular and scattered, are commonly encountered.
Specular reflection occurs when a sound wave encounters a large object with a smooth surface. Such surfaces act like an acoustic mirror, generating strong reflections that travel away from the interface at an angle equal and opposite to that at which the ultrasound beam traveled to the interface. Reflection is maximal when the angle of incidence is 90 degrees—that is, the ultrasound beam and the object are perpendicular to each another. With an angle of incidence other than 90 degrees, less energy is reflected back to the transducer. Because of the important effect of strong specular reflection on image quality, echocardiographers adjust the position of the TEE transducer so that the direction of its beam is perpendicular to the cardiac structure of interest.
Scattering reflection occurs when an ultrasound beam encounters small or irregularly shaped surfaces. Such small objects, such as red blood cells, scatter ultrasound energy in all directions, so that far less energy is reflected back to the transducer than in the case of a specular reflector. This type of reflection is the basis of the Doppler analysis of red blood cell movement.
Both types of reflection contribute to the two-dimensional image. Although the strongest signals and best images are obtained from interfaces that are perpendicular to the beam orientation, cardiac tissue is to a large extent irregular and nonlinear in shape. Therefore, a significant component of the reflected energy comes from scattering off the smaller irregular components of tissue. An example is imaging of the lateral and septal walls of the left ventricle from esophageal windows. Although the ventricular walls are parallel to the ultrasound beam, they can be imaged as a result of both specular reflection and scattering off the irregular surfaces of the myocardium. However, the total amount of ultrasound returning to the transducer is low, which accounts for the poor quality of images, which often include dark spots called echo dropout. Adjusting the transducer angle or using a different echocardiographic window to orient the beam more perpendicular to the structure of interest will often dramatically improve image quality.
Refraction
The portion of the ultrasound beam that is not reflected propagates through the interface, but its direction is often altered or refracted. Refraction is most pronounced when the difference in sound velocities in the two tissues is large and the angle of incidence is acute. When the angle of incidence is 90 degrees, or when the difference in levels of acoustic impedance is minimal, refraction does not occur because the ultrasound energy is either reflected or continues to travel in the same direction.
Refraction is an important factor in the formation of artifacts. Although the ultrasound beam may proceed in an altered direction, the transducer does not recognize this change.
Consequently, the refracted energy may interface with a cardiac structure outside the intended scanning field. The reflected energy from this interface returns to the transducer, which then incorrectly displays the structure alongside structures detected by the beam in its original course (Fig. 1.3). Altering the viewing angle so that the ultrasound energy is perpendicular to the area of interest minimizes refraction and any resultant artifact.
Attenuation
In addition to being reflected and refracted from tissue interfaces, the ultrasound signal is altered as it travels through uniform tissue. Most notable is the steady loss (i.e., attenuation) in transmitted intensity as a consequence of dispersion and absorption. The attenuation in ultrasound energy caused by dispersion and absorption result in less energy returning to the transducer, and subsequently a weaker signal on the display with a poor signal-to-noise ratio.
Dispersion occurs as the ultrasound beam diverges over a greater area in the far field. In addition, since the cellular structure of tissue is irregular, scattering further disperses the ultrasound energy. The amount of scattering varies greatly with tissue type.
Absorption occurs as frictional forces convert ultrasound energy into heat. Since friction is related to the level of tissue movement, it is not surprising that the higher the frequency of the signal and the greater the distance traveled, the greater the absorption (Fig. 1.4). The dependence of attenuation on frequency and distance is reflected in the attenuation coefficient (dB/cm/MHz), which allows for a comparison of the degree of attenuation between tissue types. The penetration of ultrasound can also be expressed by the half-power distance specific for each tissue, which expresses the distance sound will travel until half of its original energy is lost. The acoustic properties of various tissues are summarized in Table 1.2.
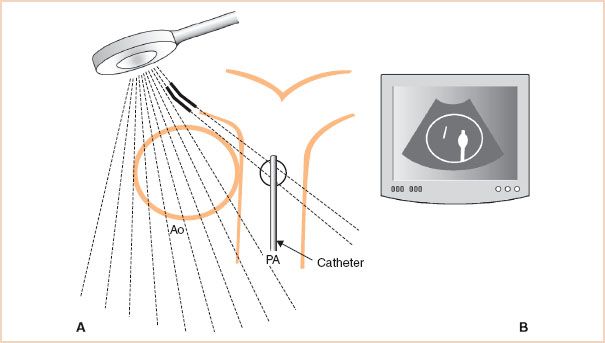
FIGURE 1.3 Refraction artifact. A: Refraction of a portion of the ultrasound beam in the near field (solid line) deflects the beam laterally where it interacts with a strong reflector, a pulmonary artery (PA) catheter. B: The transducer is unable to recognize that these scan lines have been refracted and incorrectly assumes that the returning reflections have originated from the original course of the beam. Echocardiography display illustrates the resulting artifact as the reflections from the PA catheter are mistakenly positioned within the aorta (Ao).
As a result of these phenomena, the returning echoes from deeper structures are weakened. To decrease the negative effects of attenuation during an examination, echocardiographers may choose to use a lower-frequency signal (e.g., a 2.5-instead of a 7.5-MHz transducer frequency) and view the structure from a window either closer to the structure of interest or that avoids a strong near field reflector (e.g., prosthetic valve). In addition, the incoming signal can be enhanced by adjusting the gain controls to amplify the weakened returning signals. These adjustments are discussed in greater detail in Chapter 21.
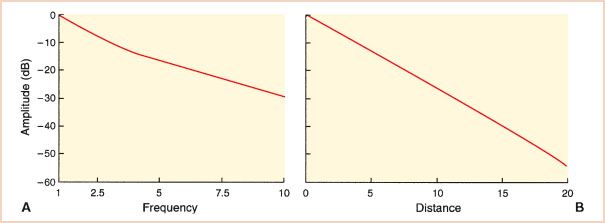
FIGURE 1.4 Attenuation of ultrasound. The effects of transducer frequency and distance on signal strength are plotted in decibels. A: The lower-frequency signals are less attenuated. B: The amplitude of a 1-MHz signal traveling through cardiac tissue is plotted. Signals reaching the far field can be more than 60 dB less than those lying close to the transducer. These effects warrant careful selection of the transducer frequency, imaging view, and gain settings to mitigate attenuation.
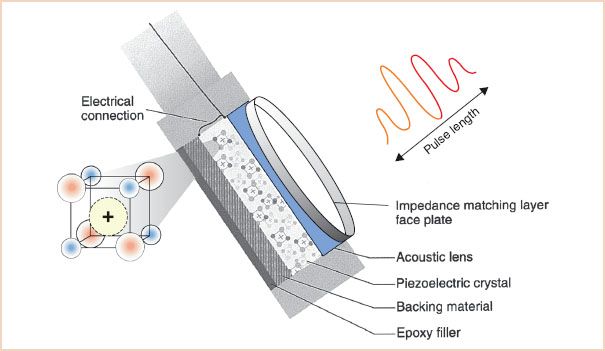
FIGURE 1.5 Transducer components: Creating a sound pulse. A brief transmission of alternating current from the electric connector causes charged particles within the matrix of the piezoelectric crystal to vibrate. The backing material helps to dampen the crystal vibrations quickly, keeping the pulse length short; in this example, it is four wavelengths. An acoustic lens aids in focusing the sound energy. The faceplate contains layers of material that match the acoustic impedance of the esophagus, to avoid unwanted reflections and ensure excellent sound transmission. Epoxy filler secures the working components to the probe.
TRANSDUCER DESIGN AND BEAM FORMATION
Transducer Components
The transducers used in echocardiography systems create a brief pulse of ultrasound that is transmitted into the tissue (Fig. 1.5). To achieve this goal, most TEE transducer designs use the following components:
1. A ceramic piezoelectric crystal, which acts as an ultrasonic vibrator and receiver
2. Electrodes, which both conduct electric energy to stimulate the piezoelectric crystal and record the voltage from returning echoes
3. Backing, which acts to dampen the vibrations of the crystal rapidly
4. Insulation, which prevents unwanted vibration of the transducer from standing waves or extraneous incoming waves
5. A faceplate, which optimizes the acoustic contact between the piezoelectric crystal and the esophagus. The faceplate may also include an acoustic lens to focus the beam
The following sections detail the inner workings of the modern ultrasound transducer and their effects on the transmitted sound beam and the echocardiographic image.
Formation of Ultrasound Waves: The Piezoelectric Crystal
The heart of the transducer consists of a piezoelectric crystal, which contains polarized molecules trapped within a matrix. The formation of the sound wave used in echocardiography is based on the principle of piezoelectricity. When stimulated by alternating electric current, polarized particles within the crystal matrix vibrate, generating ultrasound. Conversely, when an ultrasound wave strikes the crystal, the resulting vibrations of the polarized particles generate an alternating electric current. Therefore, a piezoelectric crystal can function as both a transmitter and a receiver of ultrasound. This process is the hallmark of piezoelectricity—that is, the transformation of electric energy into mechanical energy and the reverse transformation of mechanical energy into electric energy.
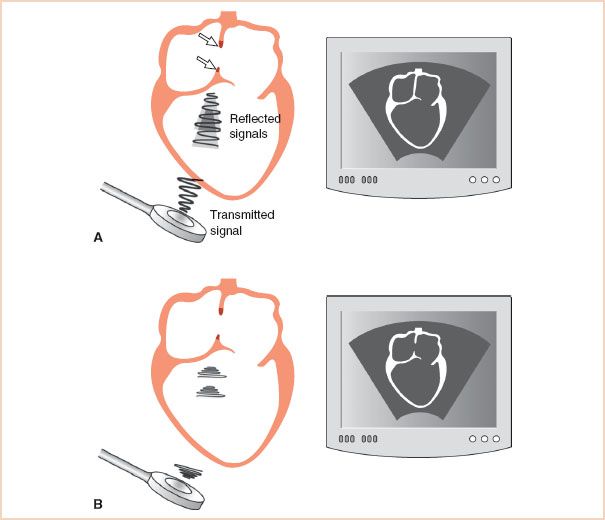
FIGURE 1.6 Effect of pulse length on axial resolution. A: The transducer emits a long sound pulse. Since the length of this pulse is greater than the length of the atrial septal defect (arrows), the reflections from the two tips of atrial septum are smeared and the defect cannot be resolved. Consequently, the resulting two-dimensional echocardiographic display (right) does not show the abnormality. B: The pulse length has been shortened and is now less than the length of the atrial septal defect. The reflections from each interface are clearly identifiable, and the resulting display (right) shows the defect.
Stay updated, free articles. Join our Telegram channel

Full access? Get Clinical Tree


