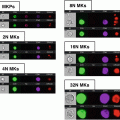
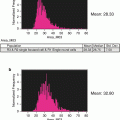
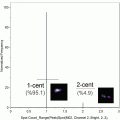
Fig. 1
Fluorescence detection limit and dynamic range as a function of cell size. Because each cell image covers multiple pixels, the sensitivity and dynamic range of cell measurements in imaging flow cytometry are both dependent on cell size. The Amnis systems use the probe-free bright-field and dark-field images to define the location and boundaries of the corresponding fluorescence images, thereby eliminating background noise from pixels within the field of view that do not contain cell imagery. The graph (a) shows the total noise, the detection limit (total noise divided by image size), and dynamic range as a function of cell size, assuming ~×40 magnification. Note that with objects larger than 10 microns in diameter, imaging flow cytometry can exceed five decades of dynamic range and with objects larger than 25 microns, IFC can detect cellular fluorescence at levels below 0.1 counts per pixel, well below the traditional 1 count per pixel detection floor of conventional imaging systems (b). Conversely, with bacteria and other objects just a few microns in diameter, the use of bright-field and dark-field imagery for background rejection can increase sensitivity by an order of magnitude relative to conventional flow cytometry
3 Velocity Detection and Autofocus
In order to effectively image using TDI, the fluidic system must operate without pulsatility and prevent uncontrolled cell rotation or translation across the field of view. The ImageStream system employs precision pumps and an in-line air chamber for fluidic system compliance, resulting in very smooth sheath flow. In addition, the flow cell is designed and manufactured to ensure that the cells are hydrodynamically focused at the center of the cuvette, thereby balancing the shear forces on either side of the cells to prevent rotation. Precise centration of the cells also assures a consistent plane of focus from cell to cell.
Even with non-pulsatile and centered flow, TDI detection still requires the precise tracking of cells as they transit the field of view. If the cumulative tracking error over the height of the detector exceeds one quarter of a pixel, image contrast will degrade. In order to achieve the necessary tracking accuracy, the ImageStream system employs a dedicated velocity detection subsystem that provides closed loop control of the TDI readout rate. The principle is similar to watching a car’s headlights through a picket fence, as the car moves faster, the frequency at which the lights appear to flash through the fence is proportional to the car’s speed. The Amnis velocity detection subsystem includes an infrared laser source to generate side-scattered light from objects in the flow core, a “hot mirror” to reflect the infrared scatter out of the primary imaging path, a Ronchi ruling of alternating opaque and transparent bars oriented orthogonal to the axis of cell motion that modulates the amplitude of the scattered light, and a detector and associated signal processing circuitry that Fourier transforms the signal and accurately identifies the fundamental modulation frequency. The modulation frequency is proportional to the speed of the flowing objects and is used to dynamically adjust the TDI readout rate to keep the detector synchronized with the motion of the cells.
In practice, two Ronchi rulings and detectors are employed behind a 50/50 beam splitter. The rulings are spaced such that their conjugate images lie on either side of the center of the flow cuvette. In this way, an auto focus score can also be generated by comparing the relative amplitudes of the signals from each velocity detection leg, which is then used to correct focus by moving the objective in the Z-axis.
4 Multispectral Imaging Optics
Light collection in the ImageStream system is via a microscope objective and the images cover a spectral range of 420–800 nm. Prior to projection on the TDI detector, the collected light passes through a spectral decomposition element that generates six spectral images of each object simultaneously. The spectral decomposition element consists of a stack of five dichroic long-pass filters with progressively longer cut-on wavelengths mounted in front of a backing mirror. The entire assembly is mounted in aperture space with each filter reflecting a different spectral band at a different angle in the horizontal plane. A secondary imaging lens assembly then focuses this light at the TDI camera, forming six spectral images arrayed side by side on the detector. The original ImageStream 100 employed a single camera but the ImageStreamX and later versions can accept up to two cameras, each with its own spectral decomposition element, to form a total of 12 images per cell. The fields of view of the two cameras are staggered vertically so the cells are first imaged on one camera and then, after a few milliseconds, on the second camera. Different lasers are steered towards the upper and lower fields of view, thereby suppressing cross talk between cameras in a fashion analogous to the use of different pinholes in a conventional flow cytometer.
5 Real-Time Data Analysis
Imaging flow cytometry makes it possible to image populations of rare cells at frequencies at or below 1:100,000. However, with image data rates exceeding 500 megabytes per second, it is critically important to analyze cells in real time so that only cell data of interest are stored. Expanded real-time data analysis also allows IFC to more closely match the workflow of conventional flow cytometry.
The original ImageStream 100 system, which was introduced in 2005, produced 60 megabytes of data per second and was capable of detecting in the presence of objects in flow, performing basic image segmentation from background, and calculating a limited set of morphometric and photometric features. However, all image registration and fluorescence compensation steps were performed post-acquisition, as well as the calculation of ~40 quantitative features per image.
At the time of this writing, the third-generation ImageStreamX Mark II is capable not only of object detection and image segmentation, but also real-time image registration, fluorescence compensation, and the calculation of a much broader and more sophisticated set of image features, despite the fact that it operates at nearly ten times the data rate of the original system. Thanks to Moore’s law, subsequent generations of instrumentation should be capable of the real-time determination of co-localization, spot counting, and other sophisticated image processing tasks at rates fast enough to enable cell sorting.
6 Post-acquisition Data Processing
Amnis data sets routinely contain over a million digital images, presenting challenges both in ensuring data integrity and in managing data analysis. Off-line analysis of Amnis data is preceded by data decompression, correction for gain and offset variations in the CCD detector, normalization for velocity variation from object to object, and (if not performed at the time of data acquisition) spatial registration of the images of each object and spectral crosstalk correction. Registration is performed to sub-pixel accuracy via interpolation using spatial offset coefficients measured during daily instrument calibration. A spectral crosstalk correction matrix, calculated from singly labeled fluorescence cell images as in conventional flow cytometry, is applied independently to every pixel of image data to improve fluorescence quantitation and image analysis.
After crosstalk compensation, approximately 100 photometric and morphometric feature calculations are performed for each image. In an application employing all 12 images per cell, approximately 1200 quantitative analysis features are available. The breadth of this “feature space” allows the creation of biologically meaningful derivative features by the algebraic combination of existing features and/or masks. For example, the nuclear-to-cellular area ratio can be calculated by taking the quotient of the nuclear fluorescence image area and the bright-field cellular area.
Amnis data allows the linkage of cell imagery with the univariate histograms and bivariate scatter plots used in standard flow cytometry data analysis. For example, a dot representing a cell on a scatter plot can be selected to inspect its associated imagery. Alternatively, a cell image can be selected and the corresponding dot highlighted in every scatter plot containing that cell. This functionality extends to populations, which are defined on a scatter plot or histogram using graphical drawing tools. Once a population is defined, its members can be visually inspected as a gallery in a “virtual cell sort.” Conversely, a population can be defined by the inspection and selection of individual cell images and then highlighted in various scatter plots to determine the utility of different features for the definition of “like” cells.
Finally, correlated multispectral imagery allows the use of image cross-correlation algorithms to determine the degree of co-localization of probes in different images of the same cell. This capability is useful for numerous applications, particularly in cell signaling, and can substitute for Forster resonance energy transfer (FRET) in many applications.
7 Multimode Image Correlation for Improved Detection Limits
The simultaneous acquisition of dark-field and bright-field along with fluorescence imagery provides a means for substantially improving the fluorescence detection limit. In any digital imaging system where the camera has one count of dark noise per pixel, the detection limit will be approached when overall pixel values are within a few counts of zero. At these signal levels, image segmentation algorithms become unreliable, despite the fact that there may be hundreds of pixels in the image and therefore hundreds of counts of signal overall.
In the Amnis systems, the bright-field and dark-field images offer a means to enhance the detection of extremely faint fluorescence from the same object. During image segmentation the logical OR of the bright-field and dark-field masks is applied to the fluorescence image(s) of the object, thereby defining the boundaries of any faint fluorescence that may be present in or on the cell. In order to detect the fluorescence signal, it must be isolated from the background, which can be determined by using the pixels outside the mask. The mean value of the background per pixel outside the mask is multiplied by the area of the mask and subtracted from the total signal-plus-background within the mask. The result of this calculation is a net total signal, which may average significantly less than one count per pixel in larger cell images, and can greatly enhance sensitivity relative to conventional flow cytometry of smaller objects like bacteria.
Both sensitivity and dynamic range are a function of image size in IFC. Because the total noise scales with the square root of the number of image pixels, for a given fluorescence signal, sensitivity will go down as the image size increases due to higher magnification or larger cell sizes. However, the dynamic range goes up as the fluorescence is distributed over more pixels, since each pixel is independently digitized. Figure 1 shows the total noise, the detection limit (total noise divided by image size), and dynamic range as a function of object size, assuming ~40× magnification. Note that with objects larger than 25 μm in diameter, imaging flow cytometry can detect cellular fluorescence at levels below 0.01 counts per pixel.
Stay updated, free articles. Join our Telegram channel

Full access? Get Clinical Tree


