Magnetic resonance spectroscopy (MRS) provides information on neuronal and axonal viability, energetics of cellular structures, and status of cellular membranes. Proton MRS appeals to clinicians and scientists because its application in the clinical setting can increase the specificity of MR imaging. The objective of this article is to provide descriptive concepts of the technique and its application in vivo for a variety of patient populations. When appropriately incorporating MRS into the neuroradiologic evaluation, this technique produces relevant information to radiologists and clinicians for their understanding of adult and pediatric neurologically based disease processes.
Key points
- •
Magnetic resonance spectroscopy (MRS) provides information on neuronal and axonal viability, energetics of the cellular structures, and status of the cellular membranes.
- •
The interpretation of a magnetic resonance (MR) spectrum primarily arises from variations in chemical ratios and/or concentrations, which alter peak area for the endogenous metabolites.
- •
The single-voxel spectroscopy (SVS) technique provides a cubic-based volume of interest, typically 4 cm 3 to 8 cm 3 in volume.
Introduction
Proton MRS appeals to many clinicians and scientists because its application in the clinical setting can increase the specificity of MR imaging when implemented with appropriate questions for MRS to answer. Enthusiasm for application of this technique is often diminished, however, due to the complexities of data acquisition, processing, and interpretation. The original expectation of MRS included a concept of disease specificity, meaning MRS would be a technique having distinct patterns for specific disease processes. Unfortunately, only a few disease processes have distinct MRS profiles unique to a particular disorder. Instead, MRS typically reveals the metabolic status of the region sampled. In the brain, MRS provides information content on neuronal/axonal viability, energetics of the cellular structures, and status of the cellular membranes. Yet, by examining the composite MR spectrum, a pattern of disease involvement at a molecular level can complement an imaging examination.
The objective of this article is to provide descriptive concepts of the technique and its application in vivo for a variety of patient populations. Ideally, when appropriately incorporating MRS into the neuroradiologic evaluation, this technique will produce relevant information to radiologists and clinicians for their understanding of adult and pediatric neurologically based disease processes.
Technical concerns
For readers previously unexposed to the MRS technique, many articles in the literature and textbooks describe the origin, mathematical approaches, and physics of MRS acquisition in the brain. Conventional MR imaging systems, with 1.5-T and 3.0-T superconducting magnets, offer suitable magnetic field strengths for performing proton MRS of the brain clinically. For practicing radiologists familiar with MR imaging, there are several technical properties that must be considered for MRS. These include the concepts of chemical shift, spectral dispersion associated with magnetic field strength, shimming, signal suppression, combination schemes for signal processing from phased array coils, sequence approach, and localization sequences.
Chemical Shift
Spectroscopy uses signal intensity, line width, and position to display information from molecules of interest. Multiple chemical regions of the same molecule may contribute distinct signals to the spectrum. Typically, these molecules of interest from the human brain are referred to as metabolites . Proton MRS plots hydrogen atom (proton) metabolite signal intensity versus an observation frequency. The protons from the backbone components of the molecule (primarily carbon atoms) can produce peaks (or resonances) when in the MR environment with signal intensity proportional to the relative number of protons. The position of the metabolite peaks on the X axis reflects the local chemical and magnetic environment of the molecule. Shielding factors influence the position of the peak ( Fig. 1 ). The position is described using the parts-per-million (ppm) scale. Because locations in Hertz (Hz) change as field strengths vary, a dimensionless unit is necessary to normalize field strengths. The chemical shift for a given peak location is calculated by dividing the difference in frequency of 2 peaks (with 1 peak defined as the reference) by the operating frequency of the MR scanner. This ppm scale refers the magnetic field strength, which is approximately 10 6 , or 1 million, Hz. This allows comparison of a peak location found on the spectrum obtained on a 1.5-T scanner with that found at that location on a different field strength scanner. Examples of this property include the methyl (CH 3 −) resonance on the acetyl group of N -acetylaspartate (NAA) that appears at 2.0 ppm and the creatine (Cr) N -methyl resonance that always appears at 3.0 ppm, regardless if measured on a 1.0-T, 1.5-T, 3-T, or 4-T scanner. In general, the locations of the metabolites are stable, because the brain pH does not change sufficiently to result in a change in peak assignment.

Metabolites with a singlet peak, such as those with NAA and Cr (including phosphocreatine), corresponding to a methyl group do not change chemical shift assignment. Metabolites with adjacent methylene and methine elements may produce a slightly different signal position and appearance at different field strengths; however, this does not occur from a pH change. The signal from methylene and methine groups may split peaks into multiplet patterns. The local chemical and magnetic environment influences the appearance of the peaks and reflects local coupling constants between protons within the molecule. Myo -inositol (mI), glutamate (Glu), glutamine (Gln), glucose, and aspartate are a few of the molecules with coupled methylene and methine spin systems visible on clinical proton MRS. For the purpose of this discussion, the only routinely reported metabolite with distinct alterations in its assignment and spectral appearance due to field strength is mI. For MRS performed at 1.5 T, the mI peak normally is distinct, with 4 of the molecule’s methine protons magnetically indistinguishable, thereby coresonating at the same location (3.57 ppm). Increased spectral dispersion (discussed later) inherent at higher field strengths, however, produces 2 distinct peaks (at a field strength of 3 T, 3.55 ppm and 3.61 ppm) for the 4 protons, effectively reducing the signal intensity by half. Normal mI levels visually appear lower at higher field strengths, such as 3 T in comparison to 1.5 T. Although some reports have found improved detection of mI at high field strength arising from increased signal-to-noise ratio (SNR), it may be problematic depending on the acquisition conditions. A short echo approach (ie, echo time [TE] ≤35 milliseconds [ms]) must be used due to the fast relaxation rate to detect mI.
Benefits and Challenges at Fields of 3 T and Higher: Relaxation Times, Signal-to-Noise Ratio, and Spectral Dispersion
The transition from 1.5 T to 3 T or higher field strengths illustrates some of the fundamental principals of MRS by perturbing properties, such as relaxation rate, SNR, and spectral dispersion. As with MR imaging, the relaxation properties influence the metabolite signal appearance. T1 relaxation reflects the time it takes for the perturbed magnetization to return to equilibrium. T2 relaxation represents the time it takes for dephasing or loss of coherence within the applied field. For the metabolites, T1 relaxation rates lengthen slightly whereas T2 shortens on moving to fields of 3 T or higher compared with 1.5 T. For metabolites (NAA, Cr, and choline [Cho]), the longitudinal relaxation T1 times approximate 1.2 to 1.4 seconds at 1.5 T and increase slightly to 1.2 to 1.6 seconds at 4 T, with Cho the shortest. These values have an impact on the repetition time (TR) necessary to conduct the MRS experiment. At least 5 times the longest T1 value is needed to obtain a fully relaxed experimental condition. For practical purposes, most clinical MRS sites use TR times of approximately 2000 ms to balance the signal afforded from decaying metabolites and beginning a new excitation. For transverse relaxation, T2, several common metabolites have values of approximately 270 ms to 480 ms at 1.5 T and 150 ms to 210 ms at 3 T, 140 ms to 185 ms at 4 T, with Cr values the shortest. These 3 primary metabolites are observed at long TEs greater than 135 ms. Other metabolites generally have much shorter T2 values, thus requiring TEs of approximately 35 ms or less (discussed later). The protocols used must consider the relaxation properties of the metabolites and how the field strength influences them.
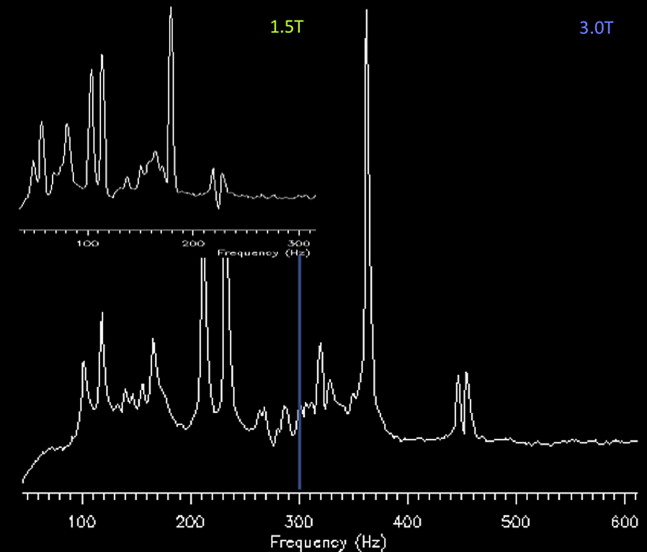
Acquiring proton MRS data at 3 T compared with 1.5 T should provide a significant benefit with an increase in SNR, which can then be applied for increased speed of acquisition (temporal resolution), spatial resolution (smaller voxel sizes with equivalent SNR to lower field), or some hybrid of speed and voxel size. This increase has been found, however, to be approximately 20% for short TE (20 ms) and approaching 100% for long-echo single-voxel proton MRS. At short TEs, it seems that the peaks acquired at 3 T are wider than those at 1.5 T. With any increase in magnetic field strength, there is a decrease in metabolite T2* relaxation times, resulting in increased metabolite line widths. Other postprocessing factors also influence the overall appearance of the peaks (ie, spectral apodization, also known as line broadening) ( Fig. 2 ). The improved resolution afforded from increased field strength is accomplished with increased spectral dispersion (ie, the spectrum is dispersed or spread apart because the frequency between peaks is greater at higher field strength) ( Fig. 3 ). The ability to distinguish where one peak begins and ends is improved. For instance, the fat and water peaks are separated by 220 Hz at 1.5 T but 440 Hz at 3 T, with the Cr and Cho peaks appearing further apart at 3 T than at 1.5 T.
Shimming
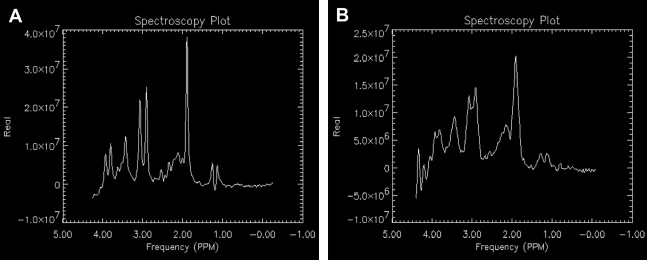
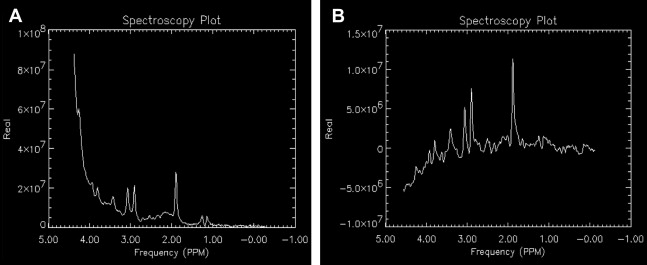
Shimming is the process of homogenizing the magnetic field by applying direct current offsets to gradient coils (usually found as first-order shim coils on clinical MR imaging systems and higher-order shims on research MR imaging systems) via automated software packages provided by the system manufacturers or research groups (an example is FastMap ). Shimming can be conducted on the raw time domain signal or the frequency (post–Fourier transformed) signal. Shimming is performed to enhance the sensitivity and resolution of the metabolite signal by narrowing the peak widths and increasing the SNR ( Fig. 4 ). Shimming also allows for improved water suppression, because a narrower water peak is more easily nulled because the center frequency can be optimized. Single-voxel spectra are less susceptible to the effects of large variations in magnetic field inhomogeneity. Thus, it is easier to shim on a small, 8 cm 3 , volume compared with an entire region, slice, or volume. Regions of interest in spectroscopic imaging or multivoxel spectroscopy acquisitions are more difficult to shim, because distortions in the magnetic field arise from tissue-air, tissue-bone, tissue-cerebrospinal fluid (CSF), and other interfaces and have large magnetic susceptibility differences because the tissues are magnetized differently. A compromise in homogeneity is inherent across the volume of interest for spectroscopic imaging because the shimming algorithm balances the need for higher shim settings around the sinus and frontal lobes compared with regions in the cerebrum away from ventricles, bone, and so forth.
Suppression
Briefly, proton MRS requires suppression of signals from water and fat. Water has a concentration level of approximately 80 M whereas most metabolites of interest are at the 1-mM to 10-mM level. Water suppression is implemented using pulse sequences, such as chemically selective saturation (CHESS ), Water suppression Enhanced through T1 effects (WET), Variable Pulse power and Optimied Relaxation delays (VAPOR), and so forth. The most commonly implemented sequence on clinical MR scanners, CHESS, has 3 narrow, frequency-selective pulses applied along with a dephasing gradient to suppress the water ( Fig. 5 ). For fat, signals can be nulled, with the application of a sequence with inversion pulses, or simply avoided with placement of a volume-selective localization pulse sequence (described later) of the region of interest. To further eliminate signal from scalp and sinuses, outer volume suppression uses very selective suppression pulses. The outer volume suppression pulses are graphically prescribed using the imaging sequences to guide locations and angles around the scalp by a technologist. Although the very selective suppression pulses can be used with body coil excitation, they have low radiofrequency peak power. These pulses have large bandwidths and sharp transition bands, which minimize chemical shift errors because the edges of the selected volume are better defined, thus minimizing chemical shift misregistration. Also known as chemical shift displacement artifact, misregistration occurs when the signal is excited from metabolites that do not originate from exactly the same volume. This arises due to the variation in chemical shift within a spectrum, because the metabolites on one end of the spectrum experience different excitation profiles from the other. The localization pulse sequence selection strongly influences this artifact with a stimulated echo-based approach minimizing displacement.
Approaches and Localization
The easiest clinical approach for proton spectroscopic analysis is known as single-volume element (voxel) proton MR spectroscopy (SVS). In its basic form on clinical MR imaging scanners, the SVS technique uses either a spin-echo (point-resolved spectroscopy [PRESS])–based or stimulated echo (stimulated echo acquisition mode [STEAM])–based volume-selective localization pulse sequence providing a cubic-based volume of interest, typically 4 cm 3 to 8 cm 3 in volume. Crusher field gradient pulses are applied to remove signals (free induction decays from a single pulse and spin echoes generated from 2 pulses) arising from outside of the voxel. As the name implies, SVS is limited to a single acquisition in a given region. Although the SVS technique does not interrogate multiple regions of interest simultaneously, it does afford good signal to noise and homogenous peaks due to a limited region of interest for shimming within a few minutes of scan time. Magnetic resonance spectroscopic imaging (MRSI) (also known as multivoxel spectroscopy) generates spectra from a larger number of usually smaller-sized voxels with broader anatomic coverage providing a choice of single slices and multiple slices in multiple dimensions and orientations. Volumes of interest are much larger and are also usually obtained using PRESS localization. The MRSI spectra can be transformed into color maps yielding metabolite images. Historically, long acquisition times, complicated postprocessing, poor homogeneity across the regions of interest sampled, partial volume effects with signal contamination from outside a voxel, and low resolution (on comparison with MR imaging) for metabolite mapping were significant limitations for the early implementation of MRSI. Recent advances provide improved accuracy in localization, speed, and resolution for spectroscopic imaging. The technical development of fast spectroscopic imaging continues to focus on implementing k-space sampling strategies (ellipsoid k-space encoding, echo planar spectroscopic imaging, spiral spectroscopic imaging, and parallel imaging reconstruction, such as SENSitivity Encoding (SENSE)) for spectroscopic acquisition without artifacts from eddy currents, especially for short TEs, and spectral aliasing effects in spectral fitting due to limitations in gradient rise times.
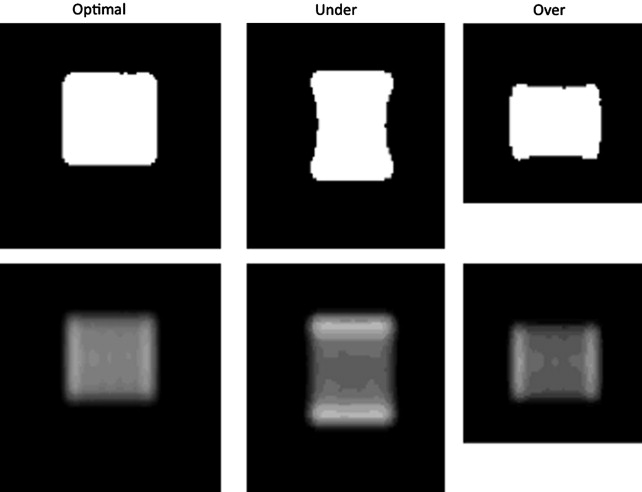
During the prescan, several steps are performed to optimize the scanner, including identifying the center of the water frequency, shimming the region of interest, and setting the power for applying the pulses in the localization and suppression sequences. If power levels for the pulses are not properly set, the voxel or region of interest sampled does not match what was graphically prescribed nor is it properly water suppressed ( Fig. 6 ).

