Fig. 23.1
ON in a 44-year-old male patient. (a) Anteroposterior view of the hip shows ON of the left femoral head. (b) Frog leg lateral view shows clear delineation of ON with subchondral collapse
On preradiographic stage of osteonecrosis, plain radiograph can be seen normal (ARCO stage I) even if histopathological osteonecrosis exists. To identify osteonecrosis in this stage, MRI or radionuclide examination might be helpful (Fig. 23.2). After this stage, mottled radiodense and radiolucent areas are noticeable on the subchondral portion of the anterosuperior part of the femoral head (ARCO stage II) (Fig. 23.3). However, the abnormal density of this area must be differentiated from the normally heterogeneous density caused by the overlapped shadow of the anterior and posterior columns of the acetabulum. Increased densities on the femoral head show revascularization and osseous repair [10–12].

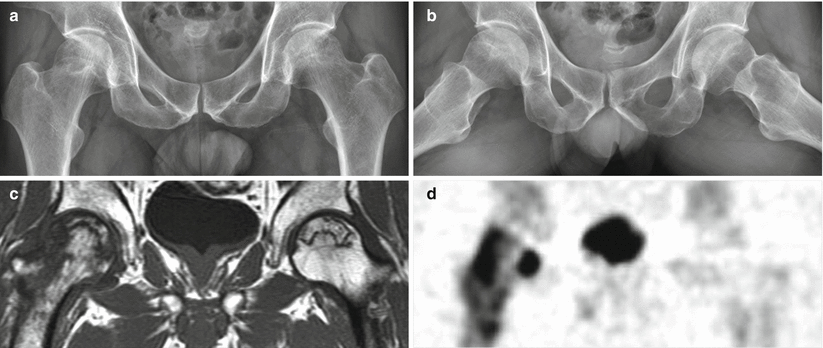

Fig. 23.2
Early stage of ON in a 36-year-old male patient. (a) The right femoral head shows ON with subchondral collapse, and marginal sclerosis along the lesion is seen. The left femoral head shows suspicious sclerosis. (b) T1-weighted coronal image shows ON of both femoral heads. ON of the left femur shows involvement of the head and intertrochanteric portion

Fig. 23.3
ON (ARCO stage II) of both femoral heads in a 55-year-old male patient. (a) Anteroposterior view of hip joints shows radiolucencies of both femoral heads with curvilinear sclerosis. (b) Frog leg lateral view shows round contours of both femoral heads. (c) T1-weighted coronal image shows ON of both femoral heads. Unlike plain radiographs, diffuse marrow edema at the right femoral head and neck is seen. (d) SPECT image shows photon defects at both femoral heads. Hot uptake foci are seen at the right femoral head and neck
As osteonecrosis of the femoral head progresses, fibrotic band formed on the border of the dead bone and the live bone cannot be observed on plain radiograph. However, when marginal sclerosis occurs along the band, it can be detected on plain radiographs as radiolucent lesion on inner section. Radiolucency is mostly seen on the subchondral portion of the femoral head and in the frog leg lateral view. The radiolucency along the subchondral portion of the femoral head is called the crescent sign (ARCO stage III). The changes affect only the femoral head, and the contour of the femoral head is maintained so that the joint space appears normal and can be distinguished from articular disease. The femoral head starts to collapse and this makes changes to the contour of the femoral head (ARCO stage IV) (Fig. 23.4).
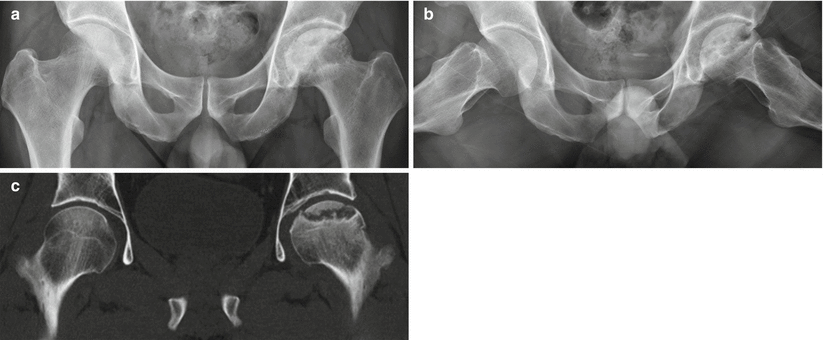

Fig. 23.4
ON (ARCO stage IV) of the left femoral head in a 49-year-old male patient. (a) Anteroposterior view of hip joints shows subchondral collapse of the left femoral head with radiolucent and sclerotic lesions. (b) Radiolucent lesions are prominent at the superolateral portion of the left femoral head. (c) CT coronal image shows subchondral collapse of the left femoral head
Subchondral fractures are seen as subchondral collapse and sclerosis, mostly on frog leg lateral view. When it starts to collapse, marginal sclerosis along the border of osteonecrosis fades in and reactive sclerosis around the affected area increases. If the lesion progresses continuously, secondary osteoarthritic changes such as joint space narrowing, marginal osteophytes, and subchondral sclerosis on hip joints including defect of articular cartilage appear. The progression of osteonecrosis is mostly influenced by extent, part, and the patient’s age [16].
Collapse shows rapid progress as the affected area gets wider. It can be seen as the same condition for several years without collapse if it is not located on the anterosuperior or weight-bearing portion. Osteonecrosis can be limited only to the femoral head, and in this case, no progress would be detected for long periods of time (Fig. 23.5). If osteonecrosis is observed on one femoral head, the contralateral femoral head should also be examined closely.
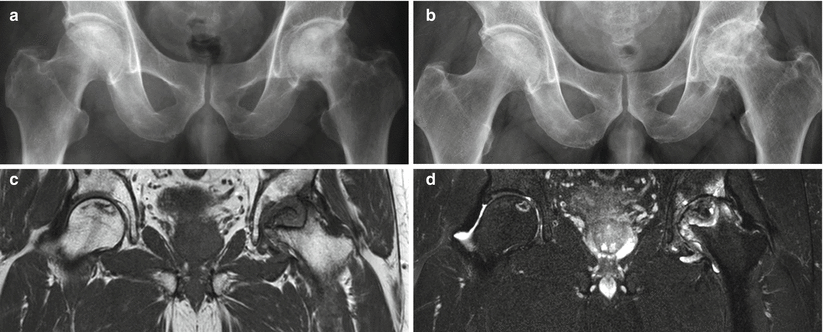

Fig. 23.5
Intraosseous location of ON in a 54-year-old woman. (a) Plain radiograph of hip shows ON of both femoral heads. The right femoral head shows normal contour; however, the left femoral head shows subchondral collapse. (b) Six months later, the left femoral head shows progression of subchondral collapse. The right femoral head has no change in contour. (c) T1-weighted coronal image shows intraosseous location of ON in the right femoral head. The left femoral head shows subchondral collapse with secondary degeneration of the acetabulum. (d) T2-weighted fat-saturated coronal image shows typical double-line sign of ON in the right femoral head
If the lesion affects not only the anterosuperior portion of femoral head but also the greater part of the femoral head, it shows the form of rapidly destructive hip disease (RDHD) [17]. There has been a reported case of rapid collapse on the femoral head in which the normal contour collapsed only in a few weeks (Fig. 23.6). When collapse proceeds, collapsed bone fragments can be seen on the inner portion of the joint cavity. Bone erosion of the acetabulum is accompanied by an irregular margin of the femoral head. In this case, distinction between RDHDs by other causing factors is necessary and the presence of ON on the contralateral femoral head is a favorable finding to ON-related RDHD.
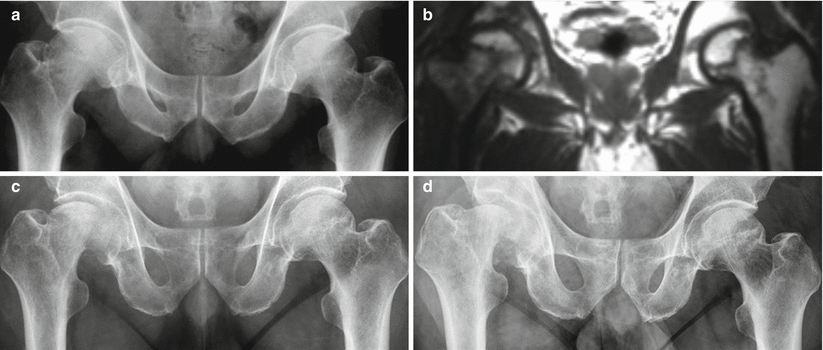

Fig. 23.6
Rapidly destructive hip disease in a 63-year-old male patient. (a) Plain radiograph of the hip shows ON of both femoral heads. Contours of femoral heads are relatively preserved. (b) T1-weighted coronal image shows ON of both femoral heads. (c) Two months later from (a), the right femoral head shows subchondral collapse with contour deformity. The left femoral head is not changed. (d) Two weeks later from (c), progression of collapse of the right femoral head is seen with bone fragments. The contour of the right acetabulum is changed with erosion
In patients with large extent of ON, it is possible that pathologic fracture is seen on the border along the lesion instead of collapse of the femoral head (Fig. 23.7). Opposite to RDHD, if the osteonecrosis region is small or if the lesion is located in non-weight-bearing portion, it shows no additional changes for several years.
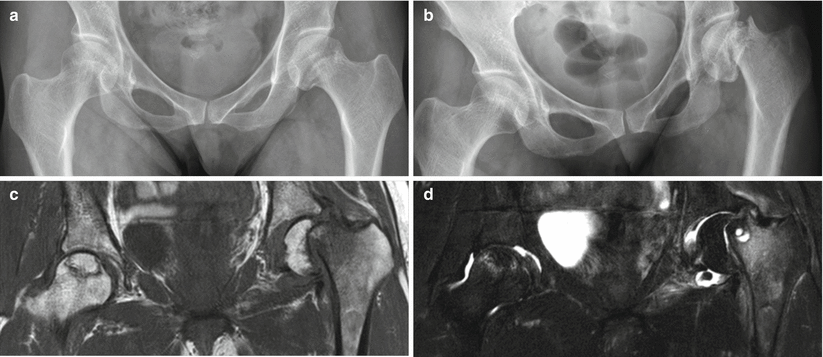

Fig. 23.7
Pathologic fracture of ON in a 45-year-old female patient. (a) Both femoral heads show amorphous sclerosis. The junction of the left femoral neck and the head shows acute angulation. (b) Two months later, the left femoral head shows pathologic fracture with inferomedial displacement of the femoral head. (c) T1-weighted coronal image shows fatty marrow change with diffuse low signal intensity of the femoral head. The right femoral head shows early change of ON. (d) T2-weighted fat-saturated image shows diffuse marrow edema of the left femoral neck with cystic changes
23.2.2 MRI
MRI is considered as the method of choice for detecting and staging ON due to its multiplanar imaging, excellent soft tissue contrast, and ability to discriminate fat from other tissues in the bony marrow [18]. MRI achieves excellent sensitivity for early ON detection [19, 20] (Fig. 23.8). In one study, MRI achieved a sensitivity of 100 % as opposed to 81 % for scintigraphy [21]. More recent data have shown that MRI may improve staging, investigate radiologically occult collapse, depict other causes of disability and pain, assess prognosis, and evaluate treatment [22]. Also, MRI is effective in assessing joint effusions and bone marrow edema, which has a strong association with hip pain [23, 24]. However, a negative MRI for ON does not exclude the possibility of ON, especially in patients with corticosteroid treatment such as renal transplant recipients [25].
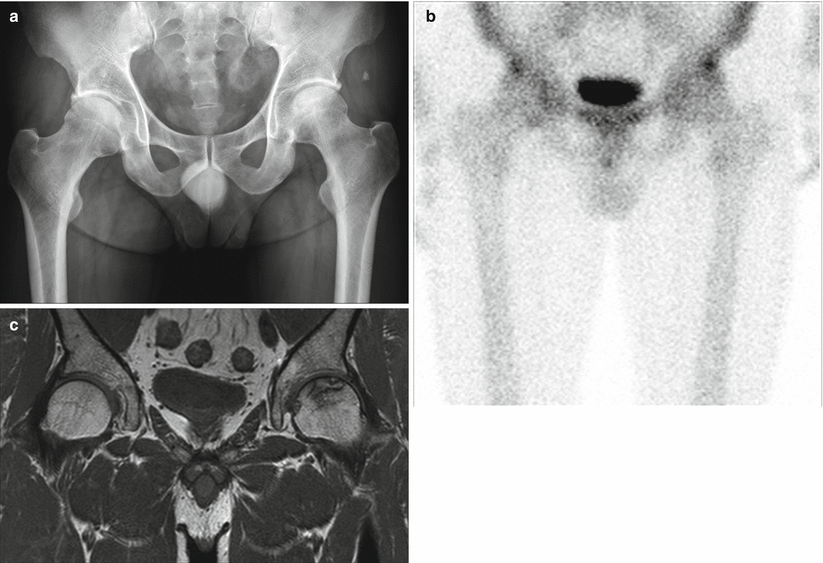

Fig. 23.8
ON of the left femoral head. (a) The hip anteroposterior radiograph was interpreted as normal. (b) Minimally increased uptakes of the radionuclide are noted at the lateral margins of both acetabula on bone scan (99mTc-DPD). (c) On T1-weighted MR image, low-signal band-like lesion is noted in the left femoral head
Imaging protocols for evaluation of patients with ON can include combinations of variable multiplanes and sequences. T1-weighted sagittal imaging may be helpful in defining early changes of cortical flattening associated with subchondral collapse. And T2-weighted fat-saturated imaging or STIR (short tau inversion recovery) imaging can provide excellent contrast for the detection of marrow replacement, fluid, and necrotic tissue [26].
General magnetic resonance (MR) characteristics of ON include the following:
On T1-weighted MR images, a circumscribed subchondral “band-like” lesion with low signal intensity is pathognomonic [5] (Fig. 23.9a). This lesion outlining a central region of bone marrow represents the reactive interface between necrotic and reparative areas. This finding is not dependent on the plain radiograph being normal or suggesting ON [3].
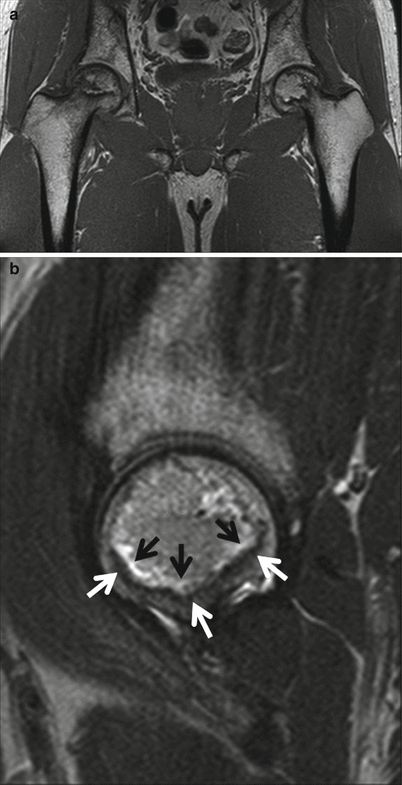
Fig. 23.9
ON of both femoral heads. (a) On T1-weighted coronal MR image, circumscribed “band-like” lesions with low signal intensity are noted in both femoral heads. (b) On T2-weighted sagittal MR image of the left hip, the “double-line” sign is well noted. This sign consists of a low-signal-intensity outer rim (white arrows) and a high-signal-intensity inner rim (black arrows)
On T2-weighted or fluid-sensitive MR images, the “double-line” sign is seen and consists of a low-signal-intensity outer rim and a high-signal-intensity inner rim (Fig. 23.9b). This sign was present in 80 % of the lesions, but in that study, no correlation with the radiographic stage was attempted. This sign was introduced by Mitchell et al. [5] and was considered pathognomonic for ON since the outer rim represents the reactive bone and the inner rim the vascular and repair tissue at the necrotic-viable osseous interface. However, the etiology of the “double line” has been challenged in the literature. It has been reported that a transposition of the frequency and phase-encoding axis results in reversal of the positions of the bright and dark rims, suggesting the presence of a chemical shift misregistration artifact [27–29]. The region within the “double-line” sign may demonstrate hypo-, iso-, and hyperintensity relative to the normal marrow.
A joint effusion may be seen and is hypointense on T1-weighted images and hyperintense on fluid-sensitive images. Joint effusions are seen in about half the patients with ON regardless of the presence of articular surface collapse [30]. Although not yet clarified, joint effusion might result from an ON-related synovitis. Joint effusions are correlated with pain and are commonly found together with bone marrow edema [23] (Fig. 23.10).
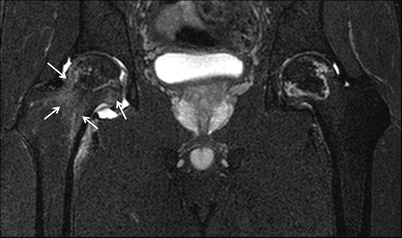
Fig. 23.10
ON of both femoral heads. The patient has ON of both femoral heads. The right hip is painful, but the left hip is asymptomatic. Joint effusion at the right hip joint and diffuse bone marrow edema (arrows) of the right femoral head and neck are demonstrated on T2-weighted fat-suppressed coronal MR image
Bone marrow edema (BME) in MRI has been a source of controversy in the literature. Distinction between reversible and ON-related BME is of essential importance because ON is a progressive clinical disease requiring a joint-preserving treatment, whereas transient osteoporosis resolves spontaneously without requiring surgical treatment. The presence of BME in ON seems to correlate highly with pain [24] (Fig. 23.10). Further studies showed that BME is a poor prognostic sign since it develops after the onset or worsening of hip pain and correlates with the subsequent collapse of the femoral head suggesting progression to advanced ON [23, 31, 32] (Fig. 23.11).
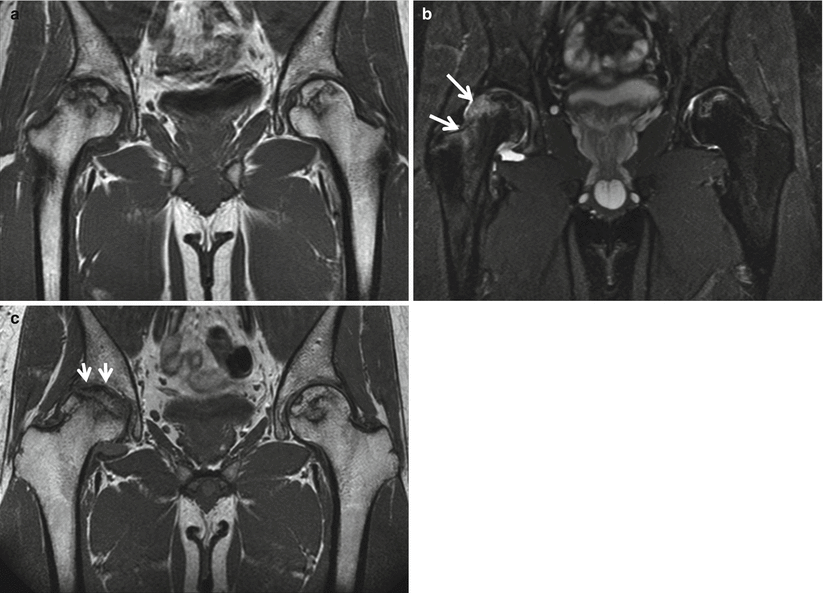
Fig. 23.11
ON of both femoral heads. (a) At both femoral heads, ON with band-like low signals is noted with similar involving areas on T1-weighted coronal MR image. (b) In the right femoral head and intertrochanteric area, bone marrow edema (arrows) is noted on T2-weighted fat-suppressed coronal MR image. In contrast, there is no significant bone marrow edema in the left proximal femur. (c) Nine months later, significant collapse (arrows) of the superolateral aspect of the right femoral head is identified on T1-weighted coronal MR image. At the left femoral head, there is no significant collapse
Post-contrast enhancement corresponds to a reparative zone, seen as a hypointense band. There may be decreased enhancement with gadolinium in early ON, and there is no enhancement with nonviable trabeculae and marrow. But, this was not widely accepted as an additional imaging finding of ON at the femoral head [33, 34]. Recent studies with dynamic contrast-enhancing MR (DCE-MR) or perfusion MR have been performed for early evaluation of the blood flow at the femoral head and neck after femoral neck fracture or steroid therapy [35–38]. MRI with these sequences is expected to be a guideline to predict the possibility and prognosis of ON at the femoral head before and after treatment.
23.2.3 CT
On axial images of CT, a star-shaped structure made by radial condensation composed of the primary compressive and primary tensile trabeculae which intersect the central area of femoral head is seen. This figure is called the asterisk sign [39]. In the cases with prominent trabeculae and physeal scar in the femoral head, axial CT image scanned at femoral head level shows that sclerotic raylike branchings from the central dense band representing physeal scar extend to the upper surface of the femoral head. It should not be mistaken for osteonecrosis (Fig. 23.12).
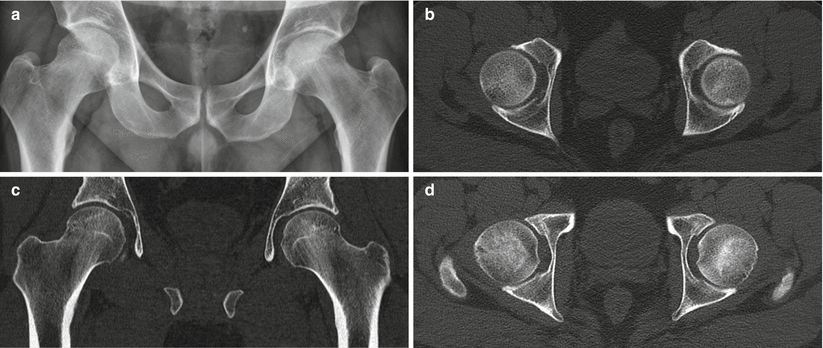

Fig. 23.12
CT findings of ON occurred in a 36-year-old female patient. (a) Plain radiograph of the hip shows indistinct sclerosis at the superolateral portions of both femoral heads. (b) Axial CT image shows linear sclerosis crossing the central portions of both femoral heads with decreased bone densities. (c) Coronal CT image shows curvilinear sclerosis with decreased bone densities at the superolateral portions of both femoral heads. Epiphyseal scars are prominent. (d) Axial CT image shows sclerosis caused by epiphyseal scars
CT shows diagnostic findings on advanced stage but less sensitive to the preradiographic stage . On the early stage of osteonecrosis, bone resorption zones can be detected and no more asterisk sign is seen. Normal forms of bone trabeculae are shown on the upper part and it shows the forms of patch sclerosis and osteoporosis. Axial CT scans show that the lesions appear as round or wedge radiolucency with peripheral sclerotic lines suggesting the border of ON. On the advanced stage, the subchondral fracture or collapse accompanied by extensive sclerosis on the living bone is more clearly visualized than those of radiographs. Following this, secondary osteoarthritic findings of narrowing of the joint space, subchondral sclerosis, and marginal osteophyte from sagittal and coronal images can be identified clearly and easily [40, 41] (Fig. 23.13).
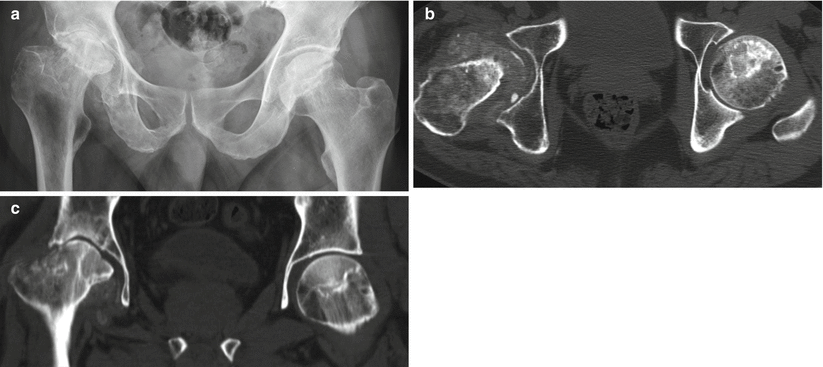

Fig. 23.13
Secondary osteoarthritis caused by ON in a 59-year-old female patient. (a) Plain radiograph of the hip shows advanced ON of the right femoral head with subchondral collapse and secondary osteoarthritis of the right hip. The left femoral head shows early ON with curvilinear sclerosis. (b) In axial CT image, bone fragments are seen within the joint space. The left femoral head shows loss of asterisk sign with irregularly margined sclerosis
23.2.4 Radionuclide Examinations
23.2.4.1 Bone Scan
Radionuclide bone scintigraphy using technetium-labeled phosphate analogs such as methylene disphosphonate (99mTc- MDP) and dicarboxypropane diphosphonate (99mTc-DPD) may be used for the early diagnosis of ON of the femoral head [5]. Also, scintigraphy may be useful in evaluating the contralateral asymptomatic hip in patients with apparent unilateral ON of the femoral head. Although bone scans can detect ON earlier than conventional radiography, they are not sensitive as MRI. In acute phase of ON, decreased or absent uptake of bone tracer (“cold” lesion ) can be revealed. After weeks or months, increased accumulation of bone tracer occurs (“hot” lesion) with chronic vascular stasis in repair and in revascularization (Fig. 23.14).
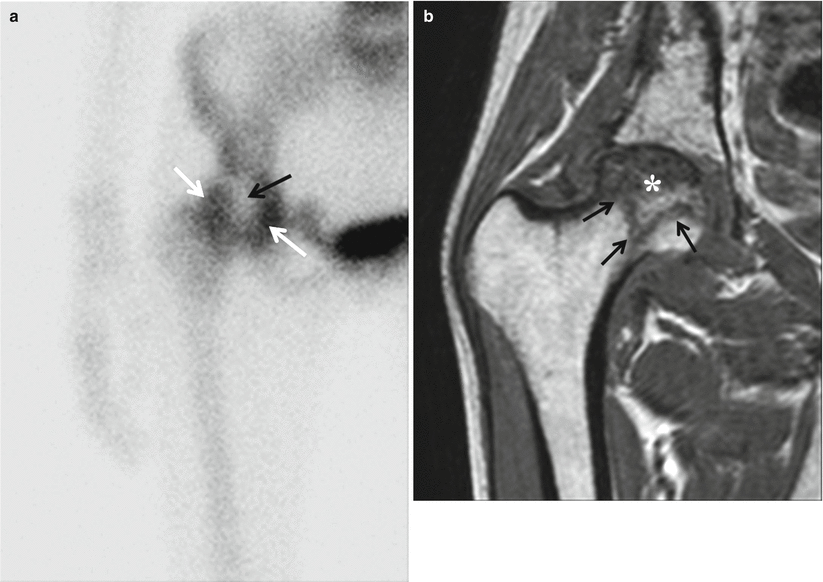

Fig. 23.14
ON of the right femoral head. (a) Bone scan (99mTc-DPD) depicts a central area of diminished uptake (“cold” lesion) (black arrow) surrounded by a zone of augmented activity (“hot” lesion) (white arrows). (b) On T1-weighted coronal MR image, a serpentine low signal band (black arrows) is noted at the femoral head with heterogeneous marrow signal change in the necrotic portion
23.2.4.2 SPECT
Single-photon emission computed tomography (SPECT) may improve radionuclide sensitivity for the diagnosis of ON [42]. SPECT can contribute to the accurate diagnosis of ON by identifying photopenic defects on serial images that may not be evident on bone scans. On bone scan, increased accumulation of bone tracer from osteoarthritic change in the posterior rim of the acetabulum may in part obscure a photopenic defect from femoral ON [43].
23.2.4.3 PET-CT
Positron emission tomography (PET) scans provide a real-time image of physiology based on the type of radiolabeled marker used. PET imaging has been utilized extensively in orthopedic skeletal disease assessment as well as in cases where interference from implants inhibits the use of other imaging modalities [44, 45]. On PET or PET-CT, ON is seen as a photopenic area.
Stay updated, free articles. Join our Telegram channel

Full access? Get Clinical Tree


