The role of radiomics in the diagnosis, monitoring, and therapy planning of brain tumors is becoming increasingly clear. Incorporation of quantitative approaches in radiology, in combination with increased computer power, offers unique insights into macroscopic tumor characteristics and their direct association with the underlying pathophysiology. This article presents the most recent findings in radiomics and radiogenomics with respect to identifying potential imaging biomarkers with prognostic value that can lead to individualized therapy. In addition, a brief introduction to the concept of big data and its significance in medicine is presented.
Key points
- •
Radiomics refers to the extraction of a large array of quantitative features from imaging that can be correlated with the demographic and genomic profile of the patient.
- •
Radiomic analysis has the potential to serve as a noninvasive technique for accurate characterization of tumor microenvironment.
- •
Incorporating simple imaging features, such as tumor location, involvement of eloquent cortex, and extent of the tumor, can improve understanding of tumor genomic profile and aid in therapy planning.
Introduction
Brain tumor is the growth of abnormal cells in the brain and ranges from noncancerous (benign) to malignant. Glioblastoma (GBM) is the most aggressive type of brain tumor, rising from glial cells, characterized by rapid growth and invasion into nearby brain tissue. GBM has an incidence of 3.19 cases per 100,000 adults per year and average age at diagnosis is 64 years. The current line of treatment for patients with GBM involves maximal safe excision of the tumor followed by radiotherapy plus concomitant and adjuvant chemotherapy. However, this paradigm of treatment has proven insufficient because most treatments cannot eradicate all tumor cells, explaining the high rate of progression; most patients with GBM survive approximately 12 to 15 months, and only 5% live for more than 5 years. Another important factor that greatly reduces the efficacy of current therapy is the heterogeneity of gliomas. In addition, analysis of histologic specimens highlights the intertumoral and intratumoral differences. Against this background, research in the field is focused on identifying markers for patient stratification at the point of diagnosis and for follow-up.
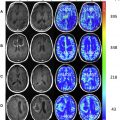
MRI is a well-established technique for imaging evaluation of brain tumors because of its high soft tissue contrast. Current standard of care involves acquisition of high-resolution MRI scans (<2 mm through plane resolution) that allow for tumor visualization, shape and size determination, and initial staging before surgery ( Fig. 1 ). Using more advanced imaging techniques, such as diffusion weighted imaging, dynamic susceptibility contrast MRI, and magnetic resonance spectroscopy (MRS), it is now possible to probe the tumor cellularity and its vascular dynamics ( Fig. 2 ). Quantitative MRI allows for macroscopic, detailed, three-dimensional representation of the tumor and the surrounding environment without the need of invasive procedures, such as biopsy or surgery. Although, the information obtained from MRI is at the tissue/organ level and cannot substitute histologic findings, extracted quantitative parameters are believed to reflect various pathophysiologic aspects of the tissue under examination. Additionally, these parameters are suitable for statistical comparisons with clinical and genomic factors, and longitudinal analysis.
Recent findings have revealed that imaging contains complementary information with demographic and genomic data, giving rise to radiomics. The combination of imaging features with demographic information, such as age, sex, overall survival, and progression-free survival, presents a new opportunity to classify patients into survival groups and determine risk of recurrence based on a noninvasive assessment at the time of diagnosis or during therapy. Furthermore, correlating imaging features with genomic information (often referred as radiogenomics) highlights the important conclusion that information obtained at the tissue/organ level (macroscopic level) is directly linked to underlying physiologic, cellular processes (microscopic level).
Consequently, radiomics has the potential to improve diagnosis and therapy planning of numerous cancers. In parallel, a by-product of radiomics is the generation of large-volume data that are currently accumulating in computers and servers, and are expected to increase daily. This article provides a summary of the current findings in radiomics of brain tumors with a focus on MRI, and also identifies future directions. In addition, an introduction to the concept of big data and its significance in medicine is presented.
Introduction
Brain tumor is the growth of abnormal cells in the brain and ranges from noncancerous (benign) to malignant. Glioblastoma (GBM) is the most aggressive type of brain tumor, rising from glial cells, characterized by rapid growth and invasion into nearby brain tissue. GBM has an incidence of 3.19 cases per 100,000 adults per year and average age at diagnosis is 64 years. The current line of treatment for patients with GBM involves maximal safe excision of the tumor followed by radiotherapy plus concomitant and adjuvant chemotherapy. However, this paradigm of treatment has proven insufficient because most treatments cannot eradicate all tumor cells, explaining the high rate of progression; most patients with GBM survive approximately 12 to 15 months, and only 5% live for more than 5 years. Another important factor that greatly reduces the efficacy of current therapy is the heterogeneity of gliomas. In addition, analysis of histologic specimens highlights the intertumoral and intratumoral differences. Against this background, research in the field is focused on identifying markers for patient stratification at the point of diagnosis and for follow-up.
MRI is a well-established technique for imaging evaluation of brain tumors because of its high soft tissue contrast. Current standard of care involves acquisition of high-resolution MRI scans (<2 mm through plane resolution) that allow for tumor visualization, shape and size determination, and initial staging before surgery ( Fig. 1 ). Using more advanced imaging techniques, such as diffusion weighted imaging, dynamic susceptibility contrast MRI, and magnetic resonance spectroscopy (MRS), it is now possible to probe the tumor cellularity and its vascular dynamics ( Fig. 2 ). Quantitative MRI allows for macroscopic, detailed, three-dimensional representation of the tumor and the surrounding environment without the need of invasive procedures, such as biopsy or surgery. Although, the information obtained from MRI is at the tissue/organ level and cannot substitute histologic findings, extracted quantitative parameters are believed to reflect various pathophysiologic aspects of the tissue under examination. Additionally, these parameters are suitable for statistical comparisons with clinical and genomic factors, and longitudinal analysis.
Recent findings have revealed that imaging contains complementary information with demographic and genomic data, giving rise to radiomics. The combination of imaging features with demographic information, such as age, sex, overall survival, and progression-free survival, presents a new opportunity to classify patients into survival groups and determine risk of recurrence based on a noninvasive assessment at the time of diagnosis or during therapy. Furthermore, correlating imaging features with genomic information (often referred as radiogenomics) highlights the important conclusion that information obtained at the tissue/organ level (macroscopic level) is directly linked to underlying physiologic, cellular processes (microscopic level).
Consequently, radiomics has the potential to improve diagnosis and therapy planning of numerous cancers. In parallel, a by-product of radiomics is the generation of large-volume data that are currently accumulating in computers and servers, and are expected to increase daily. This article provides a summary of the current findings in radiomics of brain tumors with a focus on MRI, and also identifies future directions. In addition, an introduction to the concept of big data and its significance in medicine is presented.
Radiomics: emerging clinical applications
Radiomics refers to the extraction of a large array of quantitative features from imaging that is correlated with the demographic and genomic profile of the patient. These imaging features comprise of descriptors of size, shape, volume, intensity distribution (extracted from the histogram), and texture patterns. Different imaging modalities (eg, MRI, computed tomography, ultrasound) and different sequences (T1-weighted, T2-weighted, fluid attenuation inversion recovery [FLAIR], diffusion weighted imaging) are used as the base for extracting these features. The complete set of imaging features obtained for a patient using the images available is called the “radiome.”
One of the first attempts to correlate imaging findings with histology was published in 1988, highlighting that enhancing areas in MRIs and computed tomography scans overlapped with areas of neovascularity and cell proliferation as determined through biopsy. Since then a plethora of studies have been published looking into the prognostic value of specific imaging features and correlations with genomic findings. This section reviews the research findings on radiomics for GBM using MRI. The discussion is split into three separate sections, according to the level/complexity of the imaging features presented: (1) Visually AcceSAble Rembrandt Images (VASARI) features, (2) volumetric imaging features, and (3) texture analysis–derived features.
Visually AcceSAble Rembrandt Images Features
Incorporating simple imaging features, such as tumor location, involvement of eloquent cortex, and extent of the tumor, can improve understanding of tumor genomic profile and aid in therapy planning. Several groups have evaluated the use of such information in the context of predicting patient survival and making correlations with genomic signatures. However, effectively combining imaging features with demographic or genomic information requires imaging features to be independent of the approach used, reviewer/radiologist evaluation, and data collection site. The aforementioned requirements allow for robust and reproducible results, and validation across data obtained from different sites. To address these issues, the cancer research community introduced the VASARI features, a comprehensive list of standardized imaging features that can be obtained through typical clinical scans.
The first study using VASARI features was published by Gutman and colleagues and investigated the association of VASARI features with genomic information and patient survival. Presurgical MRIs of 75 patients obtained from the Cancer Imaging Archive database ( http://cancerimagingarchive.net/ ) were evaluated by three neuroradiologists and results showed that increased length of the major axis obtained from the T2-weighted FLAIR image and the presence of contrast-enhanced tumor (>33%) are associated with poor survival. Furthermore, results revealed associations between VASARI features and GBM mutation status; epidermal growth factor mutant GBMs were larger than wild-type epidermal growth factor GBMs, whereas TP53 mutant GBMs were smaller than wiled-type GBMs.
Since then, more findings on the correlation of VASARI features and demographic/genomic information have been published. In 2014, using a larger patient cohort (104 The Cancer Genome Atlas patients), Colen and colleagues reported that deep white matter tract and ependymal involvement suggests poor survival. At the same study, mitochondrial pathway was identified at the top canonical pathway in GBMs with invasive phenotypes. The most recent study on the subject was published on 2015 by Rao and colleagues ; the authors using a combination of three VASARI features (volume-class, hemorrhage, and T1/FLAIR ratio) partitioned patients into two distinct survival groups with survival difference of 12 months. It should be noted that in this study findings were validated on an independent set of 48 patients (training set, 43 patients).
Volumetric Imaging Features
The adoption of quantitative measurements is envisioned as a major advantage in the radiology field. VASARI features could be characterized as the first attempt in the transitioning from qualitative radiologic evaluation to accurate, reproducible, quantitative measurements. As highlighted in the previous section the size of the tumor (longer axis) is linked to genomic information and can predict survival; in addition over the past 5 years it became evident that three-dimensional segmentation (ie, volume) would allow one to grasp the whole tumor rather than information from a single slice.
Volumetric analysis provides a snapshot of the entire tumor, and partitions of the tumor that reflect specific imaging phenotypes; in the case of GBM, contrast-enhancing tumor (CE), nonenhancing edema/invasion, or necrotic portion. Typically, volumetric measurements are based on high-resolution precontrast/postcontrast T1-weighted images and FLAIR images. Different approaches ranging from manual delineation to fully automated segmentation have been adopted by researchers. These methods are characterized by specific advantages and disadvantages; however, the investigation of those is not the subject of this article.
A large body of literature exists demonstrating that tumor volume (preoperatively or postoperatively) is associated with overall survival and progression-free survival. Other well-known factors associated with good prognosis are younger age and higher preoperative Karnofsky Performance Status (KPS) score; thus, further studies assessed the additive benefit of combining volumetric information with demographic data in predicting overall survival. Toward this goal, Park and colleagues proposed a preoperative prognostic scale that evaluated tumor location, KPS, and tumor volume; results identified three distinct survival groups. A favorable prognosis was reported in patients with tumors away from the eloquent cortex (motor-speech/middle cerebral artery score ≤2), good performance status (KPS ≥80), and tumor volume less than 50 cm 3 . Further looking into the genomic associations of volumetric/demographic information and therefore moving toward the radiogenomics field, Zinn and colleagues presented VAK, a three-point scoring system that evaluates volume, age, and KPS. Two classes with significant survival differences were presented (VAK-A and VAK-B; P <.05), and VAK-specific molecular configuration was identified.
In the radiogenomics field, the first large-scale study using volumetric information obtain from MRIs along with the tumor’s genomic profile was published by Zinn and colleagues. Zinn and colleagues classified patients into two groups based on the volume of edema (obtained using the FLAIR sequence) and further identified main cancer genomic components associated with cell migration and invasion. Additionally, Iliadis and colleagues reported that the volume of necrosis was a negative prognostic factor of progression-free survival and was inversely correlated with MGMT protein–positive tumor cells. Another MRI-based study by Naeini and colleagues has shown that the volume of CE, central necrosis, and the ratio of FLAIR hyperintensity to the combined volume of CE and necrosis are significantly different between mesenchymal and nonmesenchymal GBM subtypes, suggesting that volumetric features may be linked to molecular subtypes. In a recent study by Colen and colleagues, necrosis was associated with different molecular pathways in males (TP53) than females (MYC).
Texture Analysis–Derived Features
Texture analysis comprises of a wide range of techniques that evaluate gray level patterns, pixel interrelationships, and spectral patterns inside a region of interest (ROI). As an image postprocessing technique it can be applied to any type of imaging; the first publications on the subject were on images obtained from satellites. Almost two decades later, the method was applied in radiographic images. In the pipeline of texture analysis and feature extraction, the first and most important step is selection of an appropriate ROI. The selected ROI should be large enough to capture the tumor heterogeneity, reflect image appearances/phenotypes, and not involve dominant variations resulting from mixture of image phenotypes (ie, selecting an ROI that incorporates both CE and necrotic portions). For more methodologic considerations about texture analysis, see the study by Kotrotsou and colleagues.
Texture analysis yields quantitative features that can be used for (1) classification, (2) correlation with demographic data (eg, survival), and (3) correlation with genomic data ( Fig. 3 ). This section is organized based on the aforementioned applications of texture analysis in brain tumors.
Related posts:
 New State-of-the-Art and Cutting-Edge Advances in Brain Tumor Imaging
 Dynamic Susceptibility Contrast MR Imaging in Glioma
 Imaging Genomics in Glioblastoma Multiforme
Perfusion Imaging in Neuro-Oncology
Shedding Light on the 2016 World Health Organization Classification of Tumors of the Central Nervous System in the Era of Radiomics and Radiogenomics
Adult Brain Tumors
Imaging Genomics in Glioblastoma Multiforme
Perfusion Imaging in Neuro-Oncology
Shedding Light on the 2016 World Health Organization Classification of Tumors of the Central Nervous System in the Era of Radiomics and Radiogenomics
Adult Brain Tumors
Stay updated, free articles. Join our Telegram channel

Full access? Get Clinical Tree


