Fig. 15.1
Schematic diagram of a synovial joint. 1 Articular cartilage, 2 fibrous joint capsule, 3 fat and soft tissues, 4 synovial membrane, 5 bare area, 6 joint space
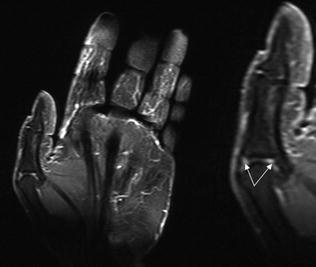
Fig. 15.2
Hyperemia. Coronal contrast-enhanced T1-weighted MRI scan with fat suppression shows hyperemia at the level of the metacarpophalangeal joint of the thumb (arrows)
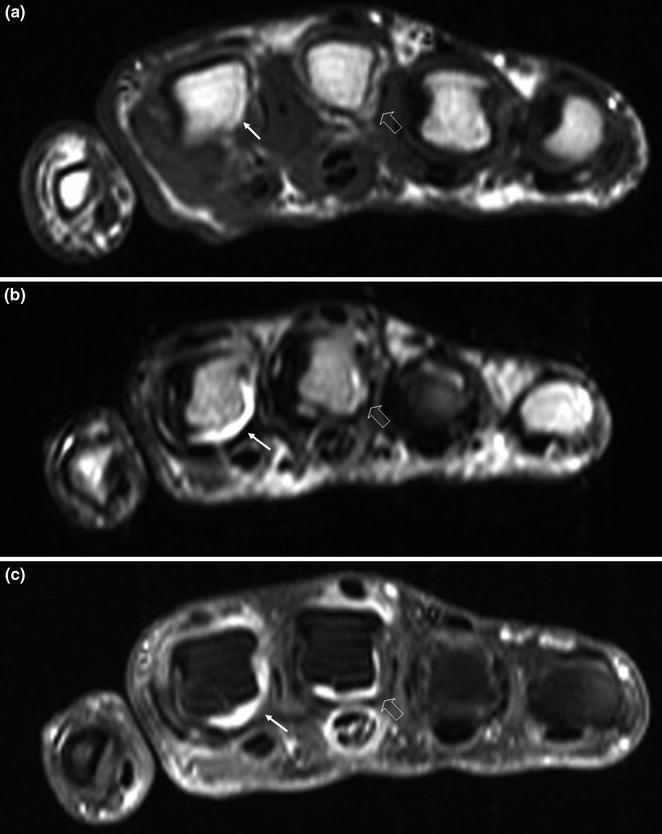
Fig. 15.3
Joint effusion—synovial hypertrophy. Axial MRI scans at the level of the metacarpophalangeal joint s—T1-weighted (a), T2-weighted (b), T1-weighted with fat suppression and contrast enhancement (c)—show typical signs of the disease: involvement of multiple joints in various stages of the disease with effusion at the level of the metacarpophalangeal joint of the index finger (arrows), synovial hypertrophy in the metacarpophalangeal joint of the middle finger (open arrow), and tendon lesions (tenosynovitis of the superficial and deep flexor tendons of the middle finger)
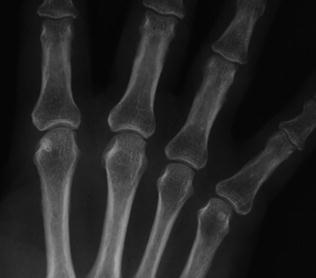
Fig. 15.4
Joint space narrowing. The radiographic examination reveals concentric reduction in the metacarpophalangeal joint spaces, particularly those of the index and middle fingers
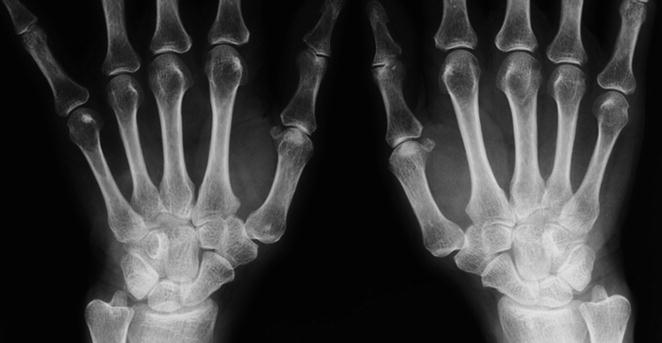
Fig. 15.5
Periarticular osteoporosis. The radiographic examination reveals a markedly decreased calcium content at the level of the metacarpophalangeal joints, particularly those of the second and third rays
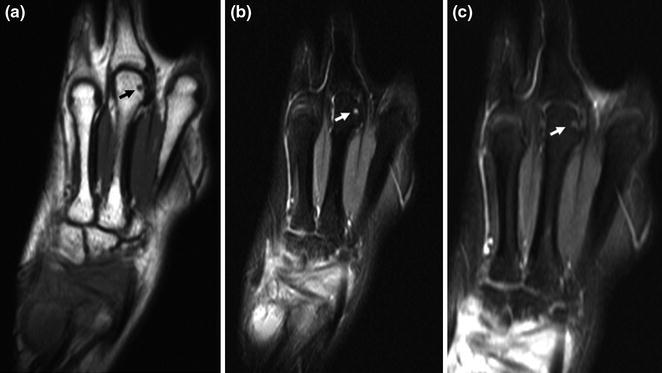
Fig. 15.6
Subchondral bone cysts. Coronal MRI images obtained at the level of the third metacarpal—T1-weighted (a), T2-weighted (b), T1-weighted with fat suppression and contrast enhancement (c)—reveal the presence of subchondral bone cysts (arrow), which are depicted as small, roundish areas that are hypointense in T1 (a), hyperintense in T2 (b), and weakly hyperintense on contrast-enhanced T1-weighted scans (c)
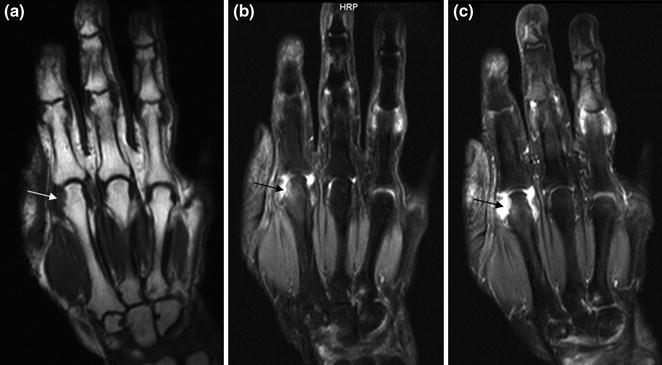
Fig. 15.7
Bone erosions. Coronal MRI views—T1-weighted (a), T2-weighted (b), T1-weighted with fat suppression and contrast enhancement (c)—obtained at the level of the metacarpophalangeal joints. Erosions are seen on the head of the second metacarpal bone (arrow), and joint effusions and synovial hypertrophy are present at the levels of the metacarpophalangeal joint of the index finger and the interphalangeal joints of the index, middle, and ring fingers
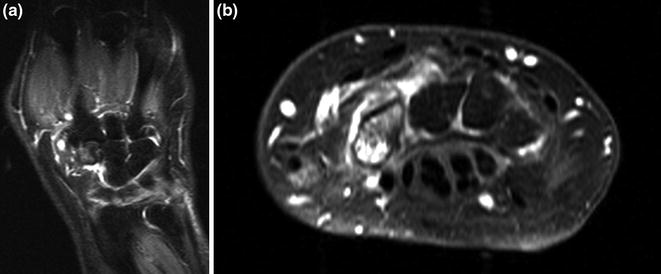
Fig. 15.8
Bone edema. MRI—coronal T2-weighted scan (a) and axial T1-weighted scan with contrast enhancement (b)—discloses edema at the level of the carpal bones in a patient with rheumatoid arthritis
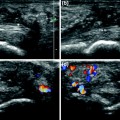
Clinical signs and symptoms are bilateral, symmetric, and involve four or more joints [1, 2]. The metacarpophalangeal joints of the second and third rays and the proximal interphalangeal joint of the middle finger are typically the first to be affected. In many cases, there is also involvement of the radiocarpal and intercarpal joints, as well as of the metacarpophalangeal and proximal interphalangeal joints of other digits.
Hyperemia is another early manifestation (Fig. 15.2). It reflects acute inflammation or re-exacerbations of chronic disease, and it may regress completely [1]. Hyperemia is the first step in the inflammatory cascade, which can be documented with imaging studies. Power Doppler imaging and contrast-enhanced ultrasound studies can demonstrate hyperemia, as can magnetic resonance imaging (especially contrast-enhanced, T1-weighted sequences with fat suppression). The well-documented association between enhancement and synovial hyperemia is related to changes in tissue perfusion and vessel permeability.
Related posts:
Stay updated, free articles. Join our Telegram channel

Full access? Get Clinical Tree


