Right Ventricle, Right Atrium, Tricuspid and Pulmonic Valves
INTRODUCTION
Right ventricular (RV) dysfunction is a common concern in the perioperative period. Inadequate myocardial protection, increases in pulmonary vascular resistance, air embolism to the RV coronary supply, and acute valvular dysfunction can compromise RV performance. This chapter surveys the echocardiographic approaches for evaluating the right side of the heart, the tricuspid valve (TV) and pulmonic valve (PV).
RIGHT VENTRICLE
Anatomy
Echocardiographic evaluation of the RV is complicated by the nongeometric, asymmetric, crescent shape of this chamber. The RV consists of a free wall and a septum that is shared with the left ventricle (LV). The RV free wall is divided into basal, mid, and apical segments corresponding to the adjacent LV segments as seen in the midesophageal (ME) four-chamber view. The RV is also described in terms of its inflow and outflow tracts. An encircling muscular band includes parietal and septal portions, separates these two regions, and reflects their embryologic origins. Its most apical portion with the distinctive moderator band is often well visualized with transesophageal echocardiography (TEE). Present in most normal individuals, the moderator band is a muscular trabeculation extending from the lower interventricular septum to the anterior RV free wall and serves as an anchoring structure for the tricuspid papillary muscles (Fig. 14.1).
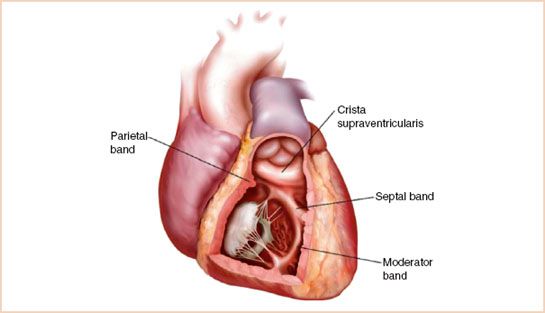
FIGURE 14.1 Schematic drawing of anatomic structures in the right ventricle.
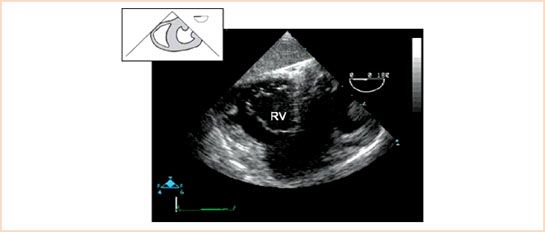
FIGURE 14.2 Transgastric midpapillary short-axis view. This image demonstrates the tricuspid valve in short axis during diastole (i.e., with the leaflets in the open position). RV, right ventricle.
Transesophageal Echocardiographic Views
1. ME four-chamber view. This long-axis view of the RV allows assessment of all three segments of the RV. In this view, the RV appears triangular in comparison with the elliptic LV, and its length is only two-third the length of the LV (see Chapter 2 and Appendices).
2. ME RV inflow–outflow view. Often termed the wraparound view, the right atrium (RA), RV, and pulmonary artery (PA) appear to “wraparound” the aortic valve and left atrium, describing a 270-degree arc from left to right of the video display (see Chapter 2 and Appendices).
3. Transgastric (TG) midpapillary short-axis view. In addition to the monitoring of LV function, this view serves to assess the function of the RV free wall and interventricular septum (Fig. 14.2, Video 14.1).
4. TG RV inflow view. Analogous to the two-chamber view of the LV, this view is acquired by advancing the multiplane angle 90 degrees from the TG short-axis view of the RV (see above) or until the RA and RV are seen in long axis, with the RV inflow and TV centered in the image. Alternatively, one develops the TG two-chamber view of the left atrium and ventricle and then rotates the probe clockwise (rightward) until the two right-sided chambers are displayed. Both techniques should result in the similar images of the RV inflow tract and the long axis of the RA and the RV (Fig. 14.3, Video 14.2).
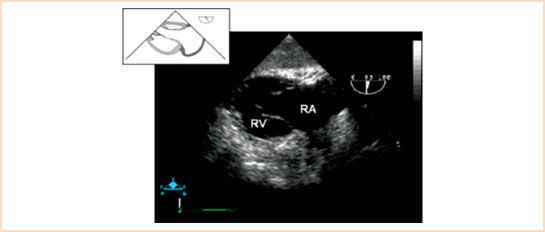
FIGURE 14.3 Transgastric right ventricular (RV) inflow view. RA, right atrium; RV, right ventricle.
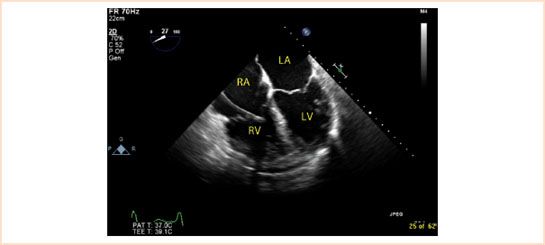
FIGURE 14.4 Right ventricular (RV) dilation. Note the change in shape of the dilated right ventricle from triangular to round. There is also a pulmonary artery catheter visible in the right atrium and ventricle. RA, right atrium; RV, right ventricle; LA, left atrium; LV, left ventricle.
Additional TEE views may allow more complete assessment of RV function, particularly regional assessment of RV wall motion (1).
Assessment of Global Right Ventricular Function
Hypertrophy
The normal thickness of the RV free wall measures less than 5 mm at end-diastole (2). RV hypertrophy is present when the RV free wall thickness exceeds 5 mm, indicating elevated PA pressure or pulmonic stenosis (PS) (3). In patients with chronic cor pulmonale, the RV wall thickness may exceed 10 mm while intracavitary trabecular patterns become more prominent, particularly at the apex.
Dilation
RV dilation may be seen with RV volume or chronic RV pressure overload. Normally, the RV end-diastolic cross-sectional area is approximately 60% of the area of the LV. As the RV dilates, its shape changes from triangular to round. In addition, the cardiac apex, which should be made up solely of the LV, may be equally shared between the ventricles or even dominated by the RV, indicating significant RV dilation. With mild RV dilation, the RV area is >70% of the LV area on two-dimensional (2D) imaging. With moderate RV dilation, the RV area may equal the LV area, and with severe RV enlargement, the RV area exceeds that of the LV (3,4) (Fig. 14.4, Video 14.3).
Systolic Function
Quantitative assessment of RV systolic function is limited by the unique geometry of RV, while variations in shape occur readily with changes in RV volume. RV ejection is accomplished by inward motion of the RV free wall, with lesser contributions from the right ventricular outflow tract (RVOT). Longitudinal shortening of the RV with systolic descent of the tricuspid annulus also contributes significantly to RV ejection (3,4). Signs of RV dysfunction include severe hypokinesis or akinesis of the RV free wall, RV enlargement, change in shape of the RV from crescent to round, and flattening or bulging of the interventricular septum toward the left side.
Tricuspid Annular Plane Systolic Excursion
Long-axis systolic excursion of the lateral aspect of the tricuspid annulus may be used as an indicator of RV systolic function. Normal tricuspid annular plane systolic excursion (TAPSE) is 20 to 25 mm with <15 mm being considered significantly depressed. The angle of excursion is toward the cardiac apex, and is slightly greater than normal mitral annular plane excursion (2). The tricuspid annulus tilts toward the apex, whereas the mitral annulus moves more symmetrically toward the apex, somewhat like a piston, emphasizing the importance of measuring motion at the lateral annulus (4). Depressed TAPSE measurements suggest depressed RV systolic function from a variety of causes.
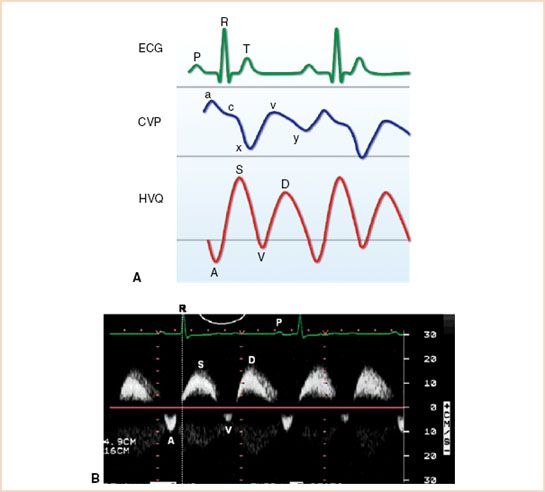
FIGURE 14.5 A: Schematic diagram of the correlation of hepatic vein flow (HVQ) with central venous pressure (CVP) and electrocardiogram (ECG). B: Pulsed wave Doppler image of normal hepatic venous flow with forward flow in systole (S) and diastole (D) and two small retrograde waves (A and V).
Hepatic Venous Flow Patterns
Examination of flow velocity patterns during phases of the cardiac cycle with pulsed wave Doppler can contribute useful information about RV function. Normal hepatic venous flow patterns have four phasic components. Initial forward flow during systole is associated with atrial relaxation and apical movement of the TV during RV systole and corresponds to the x-descent in atrial pressure measurements. Subsequent diastolic flow, associated with early ventricular filling, corresponds to the y-descent. Two small retrograde waves are often detectable, corresponding to atrial contraction at end-diastole (A) and at end-systole (V), prior to the y-descent (Fig. 14.5A and B). When RV systolic function is impaired, the systolic inflow wave of hepatic venous flow is attenuated and may even be reversed.
Assessment of Regional Right Ventricular Function
RV perfusion is supplied primarily by the right coronary artery, although a small portion of the anterior free wall may be supplied by a conus branch of the left anterior descending artery (4,5). Since the thin-walled RV is a volume-dependent chamber, its ejection fraction (EF) is extremely sensitive to changes in afterload. In contrast, the thick-walled LV is a pressure-dependent chamber, and its EF is largely preserved over large changes in afterload demand. Furthermore, the irregularity and asymmetry of the RV make changes in inotropic function difficult to detect or quantify. More dramatic changes in function such as akinesis or dyskinesis are more readily identified and are sensitive indicators of RV infarction (3,6). Less common findings associated with RV infarction include RV dilation, papillary muscle dysfunction, tricuspid regurgitation (TR), and paradoxic motion of the interventricular septum (IVS) (3,6).
Interventricular Septum
Examination of interventricular septal motion can help distinguish RV volume overload from RV pressure overload (2).
Right Ventricular Volume Overload
RV volume overload is characterized by a prominent, rounded ventricular cavity that often extends to the cardiac apex, sometimes eclipsing the LV in size in the four-chamber views. Ventricular enlargement usually develops as an adaptation to the increased total blood flow resulting from atrial or ventricular septal defects, TR, or pulmonic regurgitation (PR). Although features of RV volume and pressure overload may overlap, RV volume overload more consistently produces dilation of the RV. Examination of the IVS may yield additional clues to the etiology of RV dysfunction. Normally, the IVS functions as part of the LV and maintains a convex shape toward the LV throughout the cardiac cycle. As the RV dilates or becomes hypertrophic, its total mass increases, the septum flattens, and paradoxic septal motion develops. It is important to note that in contrast to chronic pressure overload, chronic volume overload eventually results in septal distortion that is greatest at end-diastole with paradoxical motion toward the RV (i.e., away from the center of the LV) during systole (2).
Right Ventricular Pressure Overload
RV pressure overload accompanies pulmonary hypertension or PS and is characterized by hypertrophy of the RV free wall and eventually hypertrophy of the interventricular septum and free wall. In contrast to RV volume overload, RV pressure overload produces maximal septal distortion at end-systole and early diastole (2).
RIGHT ATRIUM
Anatomy
The RA is a thin-walled, irregularly shaped structure with the superior vena cava entering near the anterior portion of the superior wall and the inferior vena cava entering near the right posterior portion of the inferior wall. The tricuspid annulus forms the inferior portion of the RA, and the coronary sinus opens into the RA just above this structure. The Eustachian valve and Chiari network are associated with the orifice of the inferior vena cava. Failure of regression of the right or inferior valve of the sinus venosus during gestation may result in a persistent Eustachian valve. The Chiari network is a fenestrated, strand-like structure within the RA cavity. Although it most often arises from the orifice of the IVC, it may originate from the RA free wall, the coronary sinus, or interatrial septum.
Transesophageal Echocardiographic Views
TEE evaluation of the RA may be performed from the standard ME four-chamber view or the ME RV inflow–outflow view. The ME bicaval view is also very useful (see Chapter 2 and Appendices), particularly for the evaluation of RA free wall and interatrial septum. The upper limit of normal for RA size is 18 cm2, or 5.3 cm × 4.4 cm (5).
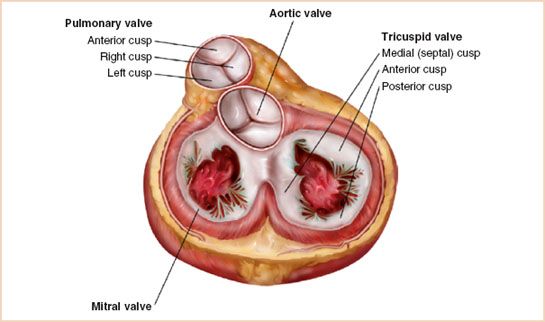
FIGURE 14.6 Schematic drawing of tricuspid valve anatomy.
TRICUSPID VALVE
Anatomy
The TV consists of valve leaflets, chordae tendineae, papillary muscles, an annular ring, and the RV myocardium. The TV is trileaflet, with anterior, septal, and posterior leaflets of unequal size (Fig. 14.6). The anterior papillary muscle is the largest and originates from the moderator band while the chordae tendineae connect the papillary muscles to the tricuspid leaflets. The TV annulus is larger and located in a slightly more apical position than the mitral valve annulus.
Transesophageal Echocardiographic Views
TEE evaluation of the TV focuses on the same standard views as for the RV.
1. ME four-chamber view. From the standard ME four-chamber view, slight rightward (clockwise) rotation of the probe moves the TV to the center of the scan plane; advancing and withdrawing the transducer allows imaging of the entire TV. This view demonstrates the anterior and septal leaflets.
2. ME RV inflow–outflow view. This view provides a nearly orthogonal view of the TV, with the orifice more nearly parallel to the ultrasound beam. As such, quantitative measurements of TV flow velocities are optimized.
3. ME modified bicaval view. From the standard ME bicaval view at approximately 120 degrees, the omniplane angle is increased slightly until the TV appears in the far left of the display. This view provides the best alignment of the ultrasound beam and the direction of the regurgitant TR jet, minimizing error in continuous or pulsed wave Doppler measurements.
4. TG views. The TG views used to evaluate the RV also provide useful windows for imaging the TV. Rightward (clockwise) rotation of the TEE transducer from the TG midshort-axis view of the LV provides a good view of the TV in short axis, allowing identification of its septal, anterior, and posterior leaflets. The TG RV inflow view provides the best image of the chordae tendineae and RV papillary muscles supporting the TV.
Tricuspid Regurgitation
TR is the most common right-sided valvular lesion in adults. It is most often caused by tricuspid annular dilation secondary to RV enlargement or chronic pulmonary hypertension.
Two-dimensional Echocardiography
Echocardiographic features of TR include RA, RV, and tricuspid annular dilation causing incomplete TV closure or even TV leaflet prolapse.
Doppler Echocardiography
Color Flow Doppler
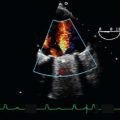
Regurgitation severity is most easily assessed with color flow Doppler, with severe dysfunction defined as an abnormal color flow signal filling >50% of the RA, or appearing as a laminar color signal. When the regurgitant jet is directed toward the atrial septum, it must be distinguished from normal caval inflow or flow through an atrial septal defect (Fig. 14.7A,B, Video 14.4A,B).
Pulsed Wave Doppler
Severe TR may also be documented by measurement of reversed or retrograde systolic hepatic vein or caval flow (Fig. 14.8).
Estimation of Pulmonary Artery Systolic Pressure
A visible TR jet may be interrogated with continuous wave Doppler to measure its peak velocity. The simplified Bernoulli equation (ΔP = 4v2; v = peak TR jet velocity) may then be used to estimate the transvalvular pressure gradient, which when added to the RA pressure yields an estimate of RV peak systolic pressure. In the absence of obstruction to RV outflow, this calculated RV systolic pressure provides a good estimate of the PA systolic pressure. It is critical, however, to align the ultrasound beam with the direction of regurgitant jet to avoid an underestimation error (Fig. 14.7C).
Tricuspid Stenosis
Tricuspid stenosis (TS) is diagnosed by visualization of structural abnormalities of the leaflets and quantified by continuous wave Doppler examination of transtricuspid flow.
Two-dimensional Echocardiography
Features consistent with TS include increased echo density of the thickened leaflets, diastolic leaflet doming, and decreased size of the TV orifice.
Doppler Echocardiography
Being the largest of the cardiac valves, transtricuspid flow velocities are often very low, typically <0.7 m/s. Although normal prosthetic valves in the tricuspid position may demonstrate peak velocities nearly twice normal, peak flow velocity >1.5 m/s suggests significant TS. As with any suspected valve dysfunction, effective orifice area should be calculated to confirm peak flow estimates of severity (5).
Etiology of Tricuspid Valve Disease
Annular Dilation
Annular dilation results in decreased leaflet coaptation and progressive TR. The severity of the regurgitation is directly related to the degree of annular dilation and may be treated with ring annuloplasty.
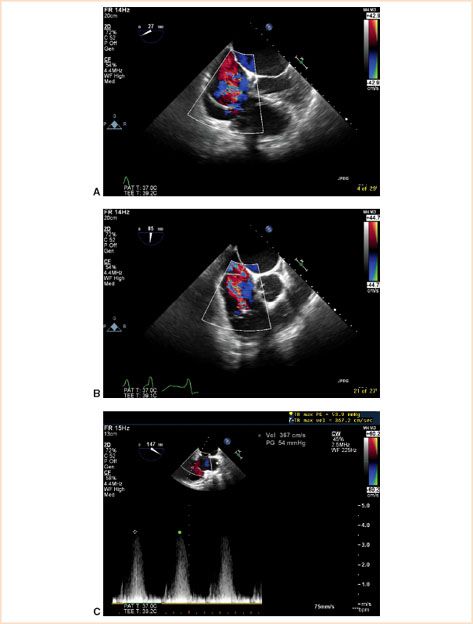
FIGURE 14.7 A: Midesophageal four-chamber view showing a color flow Doppler image of severe tricuspid regurgitation. B: Midesophageal, RV inflow–outflow view showing a color flow Doppler image of severe tricuspid regurgitation with the jet wrapping around a prominent Eustachian valve. C: Continuous wave Doppler image of tricuspid regurgitation. A sample calculation of the pulmonary artery systolic pressure follows: ΔP = 4(3.7)2; systolic pulmonary artery pressure = 54 + right atrial pressure; systolic pulmonary artery pressure is approximately 59 to 64 mm Hg (13).
Related posts:
Stay updated, free articles. Join our Telegram channel

Full access? Get Clinical Tree


