Fig. 1.
Conceptual setup of a superconducting magnet with a vertical bore. The superconducting coils that cylindrically surround the bore are placed in a chamber filled with liquid helium. To avoid heat transfer to the surroundings, the chamber is enclosed in vacuum and to reduce radiative losses an outer compartment containing liquid nitrogen with another vacuum shielding is installed.
Due to the very high fields achievable with superconducting magnets, stray fields also increase and for several years now, manufacturers have been producing shielded systems, that essentially create on the outside a counter-field to compensate the stray field. This sacrifices a small amount of maximum field strength but allows integrating those magnets in environments that cannot offer sufficient room to place these magnets far away from all other equipment and thus increases safety by reducing the risk of accidental entry into the magnet’s stray field with ferromagnetic objects.
1.2 Shim Coils
Since most magnets (of either kind) do not offer sufficient homogeneity for NMR studies, systems are equipped with shim coils. Originally, the word shim referred to small pieces of metal that were placed close to the magnet to optimize its field. This is still done in some magnets as a first step of homogenizing the field. For superconducting magnets, the most important shims are a set of superconducting shim coils—cryo-shims—that are adjusted when installing the magnet to make the field as homogeneous as possible. A set of room-temperature shim coils is common to all kinds of magnets. These coils are used to fine-tune the system once a sample is in place. For whole body systems, this process usually is fully automated and uses shim directions of the first or at most second order. Especially in high-field systems that are employed for spectroscopy and imaging, one can adjust those shims and even higher order shims by hand. Shimming the systems well will lead to narrow linewidths, which is also important in spectroscopic and microscopic imaging. Two more tasks that are performed by the room-temperature shim coils are drift compensation and frequency locking. A drift compensation adds some additional field strength parallel to the magnets own field to compensate for the unavoidable losses that occur in superconducting systems, thereby keeping the Larmor frequency stable over longer periods of time. Experiments that are very sensitive to off-resonances will require even better stabilization during the experiment, which can be provided by a frequency lock. This depends on a specially prepared sample containing 2H, whose Larmor frequency is monitored independently of the experiment and any frequency changes are counteracted by a feedback circuit powering up the room-temperature shims accordingly.
For some systems, e.g., small mobile systems, there are no separate shim coils or only a reduced set of separate shim coils and shimming is done by the gradient coils (see Section 2).
2 Gradient Coils
For all imaging applications, magnetic field gradients are required to encode the spatial information. Usually, gradient coils consist of three sets of coils that can create gradients in three orthogonal directions. By superimposing those fields one can achieve any desired gradient direction. It is important to keep in mind that all gradients always create only additional field along the main field axis. It is that field’s amplitude that varies with the gradient’s direction being zero in the center of the system and maximum at its borders. Of course, gradient coils cannot maintain a linear field ramp over infinite distance. At least along the bore of the magnet, one might experience artifacts due to the non-linearity of gradients if the imaged sample extends too far outside. Then, the spatial encoding will fail and objects will appear distorted or even in entirely wrong positions as illustrated in Fig. 2.
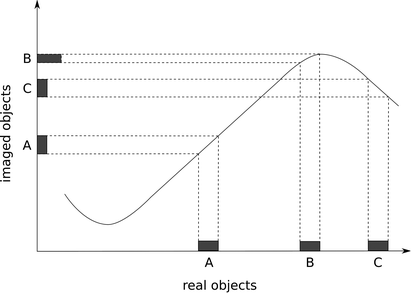

Fig. 2.
Spatial encoding inside and outside the linear regime of a gradient (gradient values are depicted by the solid curve). Object A is encoded in the linear regime of the gradient and mapped to its image properly. Object B resides close to the maximum of the gradient at a smaller slope than in the linear regime. In the image, it appears squeezed and with very high intensity. Finally object C is located even beyond the maximum of the gradient; though its intensity appears almost correctly, it is displaced and flipped.
Gradient coils are characterized by the maximum achievable field difference over the sample, which they can create. For most whole body systems, gradient strengths are on the order of several tens of milliteslas per meter while for high-field systems for microscopic imaging, even a few teslas per meter can be reached.
An ideal gradient should be the shape of a boxcar function, that is, it should switch on and off in zero time and be stable at its set value. In reality, gradients can be switched on a scale of a fraction of a millisecond, but they will not immediately, once they reach their maximum value, be flat but overshoot by some amount and oscillate for a short period in time. This is due to coupling in other elements close to the gradient coils (e.g., the shim coils) and also due to limitations of the gradient’s power amplifiers. To counteract these unwanted distortions, systems allow setting a pre-emphasis, which is essentially a kind of pre-distortion that is overlaid over the desired gradient currents to compensate for the aforementioned effects. This pre-emphasis has to be adjusted for each gradient unit and system individually to obtain maximum efficiency. In addition, gradient coils today are built as shielded coils to avoid unwanted coupling into other parts of the systems and further reduce distortions.
More considerations on gradient systems can be found in (1).
3 RF System
The rf system in MRI has to fulfill very special requirements: on the one hand, during transmission, it has to handle voltages of up to several hundreds of volts and on the other hand, during reception, it has to be sensitive to smallest signals down in the range of micro- or even nano-volts (5). The first two sections will comment on the transmit and receive chains in general. After that, in far greater detail, probe bases and rf coils will be discussed including hands-on approaches on how to manufacture and improve these components. Finally a method on how to characterize rf coils in the scanner will be presented.
3.1 The Transmit Chain
3.1.1 Hardware
The transmit chain of a modern MRI system consists of a frequency source and a power amplifier. Usually, highly stable synthesizers are employed as frequency source, which provide the reference frequency and phase for the measurement. A very high phase stability is essential for being able to correctly time pulse sequences. The synthesizer feeds through a phase shifter and an rf gate into the power amplifiers of the MRI system. These amplifiers handle transmit powers up to several kilowatts for whole body scanners. Most systems will come with at least one power amplifier for 1H measurements. This amplifier can—due to the gyromagnetic ratios of 1H and 19F which differ less than 10%—usually also handle transmission for 19F. For all other X-nuclei, different transmitters can be built into the system. These will not reach the high frequencies of 1H and 19F but will offer highly linear amplification for other nuclei.
While transmit power is for most systems not a critical resource, one should keep in mind that for coaxial cable losses are non-negligible. For RG 58, a commonly used cable type in MRI, with a wave impedance of 50 Ω, the attenuation at 300 MHz is approximately 0.3 dB/m, which means that at a distance of only 10 m, half the power will dissipate in the cable. Attenuation will get worse with higher frequencies. So in order to characterize a transmit chain one should measure the power at its end where it connects to the probe. How to perform such measurements is described in Section 3.1.2.
One more issue to address in the transmit line is noise from the transmitter during reception. Transmitters—even when blanked—will still yield low noise on their outputs at the Larmor frequency. Commercial systems usually offer decoupling switches in their hardware that will separate the transmitter from the receive line during acquisition but the use of power splitters in order to drive several transmit coils with a single transmitter or quadrature hybrids (see Section 3.2) often bypasses those switches as shown in Fig. 3. In that case, one has to add a decoupling mechanism to the transmit chain as described in Section 3.1.3 to avoid additional noise from the transmitter.
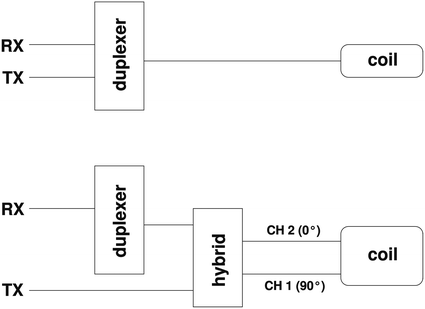

Fig. 3.
Top: single coil connected via duplexer to transmitter and receiver. Bottom: quadrature coil connected to a hybrid. The transmitter is directly connected to the hybrid and therefore decoupling circuits within the duplexer will not block any transmitter noise during reception.
3.1.2 Characterization of the Transmit Chain
To perform such measurements in one’s own lab, one will need a directional coupler, an oscilloscope, which does not need to be able to resolve the actual transmit frequency, a couple of attenuators, and 50-Ω loads. Connect the transmit cable as shown in Fig. 4 to one input of the directional coupler, the through path goes into an attenuator which can handle the full transmit power—e.g., a liquid-cooled attenuator or an actual rf coil. In any case, make sure to terminate this line with a 50-Ω load. The fork with only a small fraction of the power goes into the oscilloscope. Make sure the split part is sufficiently low not to ruin the oscilloscope; one may need to inset an additional pass-through attenuator. Finally the fork for the returned power is terminated with a 50-Ω load. Since there should be a good 50 Ω at the end of the line, there should be only very little reflected power. Now one can measure, for different transmit settings the power at the end of the transmit chain and depict it in a graph to characterize the power output.
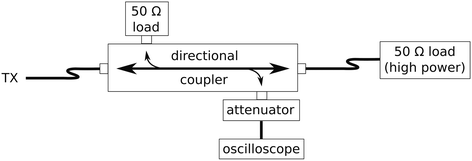

Fig. 4.
Setup for measuring the output power at the end of the transmit chain. Via the bidirectional coupler a well-defined fraction of the forward power is redirected from the line into the oscilloscope. The remaining forward power is dissipated in the 50 Ω load at the end of the setup. The 50 Ω load that would receive a fraction of the reflected power is in place to properly terminate the setup.
3.1.3 Decoupling of Transmit Lines During Reception
The transmitter can be decoupled from the reception line by a passive element which is simply plugged into the transmit line. Its basic layout is drawn in Fig. 5.
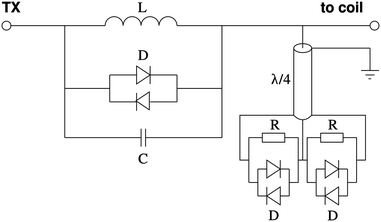

Fig. 5.
Passive decoupler for a transmit line. During transmission, all diodes D will be switched through due to the high power level. The resonant circuit formed of the inductance L, capacitance C, and the diodes D will be off-resonant and the short at the end of the λ/4 line will be transformed to an open end. This allows full transmission of the pulses. During reception, the resonant circuit will be on-resonant, thereby blocking any noise from the transmitter with high impedance. The two resistors R at the end of the λ/4 line yield a proper 50 Ω termination for the coil’s side of the system.
During transmission, due to the high transmit power, all diodes will be switched through. In that case, the resonant circuit formed by the inductor, the capacitor, and the diodes will be off-resonant and the rf can pass unhindered. The diodes at the end of the quarter-wavelength cable will form a short which in turn is transformed by the cable to an open end, rendering this part of the setup “invisible” during transmission. During reception, the signal power will be too low to switch through the diodes. Now those diodes in combination with the capacitor and the inductor form an on-resonant circuit thereby effectively blocking any rf noise from the transmitter. From the receiver’s point of view, there will be an open end. The diodes at the end of the quarter-wavelength cable will also be blocking and the additional resistors load the cable at its end with 50 Ω. Since it is a 50-Ω wave impedance cable, these 50 Ω will be also visible at the other end of the cable, thereby properly terminating the system from the receiver’s side.
3.2 The Receive Chain
3.2.1 Hardware
The very first element of the receive chain is a low-noise preamplifier. This amplifier is—especially in phased arrays (see Section 3.3)—sometimes included in the coil but may also be found as a integral part of the receive chain itself. This preamplifier is the one which determines the noise of the entire system, since it will get the very low signal from the detector and amplify it adding its own noise that may be comparable in magnitude. Any later stage of preamplifiers will already see a higher input signal that outweighs their own noise by far. To determine the intrinsic noise that comes from the receive chain, a simple experiment as described in Section 3.2.2 can be performed. Since this first preamplifier is built to handle very low input voltages on the order of micro- or even nano-volts, it has to be protected during transmission to avoid high voltages from burning the preamplifier. This is done by a so-called duplexer, which either with active or passive circuitry, separates transmit from receive chain. A more advanced version of such a duplexer is a quadrature hybrid that can be used with quadrature coils (see Section 3.3). Some considerations on these hybrids and their layout will be discussed in Section 3.2.3.
Since acquired data are processed by a computer, they need to be converted from analog signals to digital ones. This is done by an analog-digital-converter (ADC), which can typically handle frequencies up to several hundreds of kilohertz or a few megahertz. Therefore, the original signal at the Larmor frequency of several tens or even hundreds of megahertz has to be modified in order to fit into this regime. Downsampling is done by mixing the high-frequency signal with a reference signal from the synthesizer mentioned already in Section 3.1. A schematic setup of the receive chain is displayed in Fig. 6. As shown, the signal is not only mixed with the reference frequency but also with a 90° phase-shifted reference. Mixing the signal with a reference will yield a new signal at the frequency difference between the original Larmor frequency and the reference that is on the order of kilohertz and thus well within the limits of an ADC.


Fig. 6.
Schematic drawing of the receive chain for quadrature detection. The signal from the coil is split up and mixed with two reference signals that are 90° out of phase. After mixing, the signal is sampled down to the audio range and can be further filtered and amplified. After digitizing the signal in the ADC, two signals that constitute the real and imaginary part of the full signal are passed to the computer for further processing (e.g., Fourier transformation).
Nevertheless, having just one mixed signal will lead to ambiguities in case there are frequencies present in the spectrum that are slightly below and others that are slightly above the reference. These will not be distinguishable by fitting the data to the following expression for the signal strength in a free induction decay (FID):


Using the second signal mixed with the phase-shifted reference, one will obtain additional information on the real signal:


Now, frequencies below and above the reference are distinguishable and, in addition, one gains a factor of  in SNR. This can be easily seen when interpreting the two above expressions as the real (S cos) and the imaginary (S sin) part of a complex signal:
 in SNR. This can be easily seen when interpreting the two above expressions as the real (S cos) and the imaginary (S sin) part of a complex signal:

