(1)
where I is the input image, v 1, v 2 are orthonormal eigenvectors, and λ 1, λ 2 are the corresponding eigenvalues given by
(2)
Fig. 1
Elliptical representation of a 2D structure tensor
Providing that an image region contains either edges of approximately the same orientation, or edges of multiple orientations, it can be identified by means of a structure tensor as a structured or unstructured edge region, respectively. The boundaries of medical objects are naturally associated with structured edge regions, whereas unstructured edge regions are associated with noise, artifacts, and/or background clutter. In this light, structure tensors are capable of providing maps of target and nontarget edge regions in the context of a medical imaging application.
Region-Based Active Contours
The energy functional of the region-based active contours that is minimized can be written as follows:
where E reg and E df are the regularization and data fidelity energy terms, respectively, whereas w reg and w df are the corresponding weighting parameters. Energy terms are scalar functions, which most often discard any information associated with the orientation coherence of edge regions. However, forces guiding contour evolution are vectors which are affected by the orientation coherence of edges.
(3)
Regularization forces are tangent with respect to the principal axis of the contour, whereas data fidelity forces are vertical, attracting the contour towards target edges. Providing that the contour is initialized as an ellipsoid, the regularization weight w reg is longitudinal with respect to the principal axis of the contour, whereas the data fidelity weight w df is vertical with respect to the same principal axis. Figure 2 depicts an elliptical representation of an active contour.
Fig. 2
Elliptical representation of active contour
It can be noted that the regularization weight w reg corresponds to the same direction as the principal eigenvalue λ 1, whereas the data fidelity weight w df corresponds to the same direction as the minor eigenvalue λ 2. This isomorphism associates the regularization and data fidelity parameters with the eigenvalues of the structure tensor.
Orientation Estimation
Inspired by the aforementioned observation, regularization and data fidelity parameters of region-based active contours are automated in order to reflect the orientation coherence of edge regions, in a similar fashion to Weickert’s diffusion model [24]. The orientation coherence is estimated by means of the orientation entropy (OE). The latter is calculated on directional subbands in each scale of the contourlet transform (CTr) [26], which, apart from intensity, also represents textural information. This approach provides an inherent filtering mechanism, capable of filtering out randomly oriented edges associated with noise, artifacts, and/or background clutter. Moreover, CTr is directly implemented in the discrete domain, as opposed to similar transforms, such as curvelets [27].
The Contourlet Transform
CTr is an anisotropic directional image representation scheme, which effectively quantifies diffusion over contour segments with varying elongated shapes and directions. Aiming at a sparse image representation, it employs a double iterated filter bank, which captures point discontinuities by means of the Laplacian pyramid (LP) and obtains linear structures by linking these discontinuities with a directional filter bank (DFB). The final result is an image expansion that uses basic contour segments. Figure 3 illustrates a CTr iterated filter bank.
Fig. 3
CTr iterated filter bank. LP provides a downsampled low-pass version and a band-pass version of the image. Consequently, a DFB is applied to each band-pass image
The downsampled low-pass and band-pass versions of the image contain lower and higher frequencies, respectively. It is evident that the band-pass image contains detailed information of point discontinuities which are associated with target edges. Furthermore, DFB is implemented by an l-level binary tree which leads to 2 l subbands. In the first stage, a two-channel quincunx filter bank [28] with fan filters divides the 2D spectrum into vertical and horizontal directions.
In the second stage, a shearing operator reorders the samples. As a result, different directional frequencies are captured at each decomposition level. The number of iterations depends mainly on the size of the input image. The total number of directional subbands K total is calculated as
where K j is a subband DFB applied at the jth level (j = 1, 2, …, J).
(4)
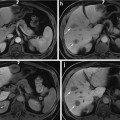
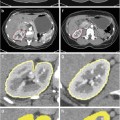
Figure 4 depicts the CTr filter bank applied on a sample grid of a lung CT scan, decomposed to the finest and second finest scales which are partitioned into four directional subbands. Each q × q image grid is fed into the CTr filter bank through an iterative procedure. This grid must be appropriately selected in order to preserve the orientation of the main structures of the target region. The band-pass directional subbands represent the local image structure. It should be mentioned that the presented framework is not confined in using CTr and could also embed alternative multi-scale or multi-directional approaches for image representation.
Fig. 4
CTr filter bank on a sample grid of a lung CT scan decomposed to two levels of LP and four band-pass directional subbands
In the context of the presented framework, OE is calculated for each subband image I jk as follows:
![$$ {p}_{jk}\left(m,n\right)=\frac{\left|{I}_{jk}\left(m,n\right)\right|{}^2}{\sqrt{{\displaystyle \sum_{n=1}^{N_{jk}}{\displaystyle \sum_{m=1}^{M_{jk}}{\left[{I}_{jk}\left(m,n\right)\right]}^2}}}} $$](/wp-content/uploads/2016/03/A303895_1_En_17_Chapter_Equ6.gif)
(5)
(6)
where OE jk is the OE of the subband image I jk in the kth direction and the jth level of decomposition, M jk is the row size, and N jk is the column size of the subband image. OE obtains high and low values in cases of unstructured, nontarget and structured, target edge regions, respectively. Figure 5a depicts a schematic representation of several elliptical structure tensors consisting of single and multiple orientations, whereas Fig. 5b depicts the OE behavior on each structure tensor of Fig. 5a.
Fig. 5
Schematic representation of (a) elliptical structure tensors and (b) OE behavior on each structure tensor
Automated Parameter Adjustment
Regularization and data fidelity parameters are automatically adjusted according to the following equations:

(7)
The core idea is to guide the active contour towards structured, target edge regions in the early stages of evolution by appropriately amplifying data fidelity forces in randomly oriented, high-entropy regions. As a result the contour will be repelled and iterations dedicated to erroneous local minima will be bypassed, speeding up contour convergence towards target edges. Equation (7) is an interpretation of orientation entropy values adaptive to the orientation of data fidelity forces. Apart from separately adjusting each parameter, the presented framework also achieves a balanced trade-off between regularization and data fidelity parameters. It should also be noticed that the automated parameterization is spatially adaptive, so as to reflect local variations over the image.
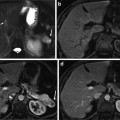
Figure 6 illustrates the improvement in contour evolution achieved by the presented framework as compared to the typical contour evolution obtained by empirical parameterization. Figure 6a depicts a synthetic image containing a target region over an inhomogeneous background, resembling a typical medical image case, whereas Fig. 6b depicts a sketch of orientation variability of the synthetic image. Red arrows correspond to structured, target edge regions, whereas black ones indicate unstructured, nontarget ones.
Fig. 6
Contour evolution of the presented framework vs. empirical parameterization, (a) synthetic image, (b) sketch of orientation variability, (c, d) evolution of empirical parameterization, and (e, f) evolution of the presented framework
In the case of empirical parameterization, the contour will be trapped in false local minima associated with background clutter in the early stages of evolution (Fig. 6c). Since region-based forces (short white arrows) are uniformly weighted irrespectively of OE, the contour will be kept away from target edge regions for more iterations (Fig. 6d).
Related posts:
Stay updated, free articles. Join our Telegram channel

Full access? Get Clinical Tree


