(13.1)
This approximation of ignoring the ill-defined volume of the third compartment limits the meaning on the term IVF to mean the fraction of free water outside the cells. The tissue concentration TSCm of sodium ions in solution from the model becomes the number of moles of sodium M m in free solution divided by the voxel volume which is approximately equivalent to the sum of the volume fraction-weighted sodium concentrations in the two compartments of free water:


(13.2)
However, the unit of concentration for TSCm in this equation refers to moles of sodium ions per liter of tissue. In practice, tissue volume is an awkward parameter to measure and so the usual biochemical parameter of concentration in tissue is expressed in terms of mass of wet tissue in grams. However, as the voxel volume also contains the third compartment of solids, these hydrated macromolecules contribute to the overall wet weight of tissue. Thus, the concentration from (13.2) can be re-expressed in the more convenient biochemical unit by correcting for the tissue density. The tissue density, TD, shows very little variation in normal tissue, being about 1.02–1.04 g/mL [11]. Thus, as the wet weight of a voxel of tissue is the product of the tissue density and that volume, (13.2) can be rearranged to more conventional units (moles/g wet weight) as


(13.3)
This model allows the TSC to be calculated from known literature values. The literature values for C c and C i are expressed in terms of the free water within each compartment in normal tissue as about 12 and 145 mM, respectively. The IVF has been reported in human brain as 0.2 [11, 12]. Using these literature values, the model predicts a TSC as about 37 mM.
The experimental tissue sodium concentration (TSCe) measured by sodium MR imaging is determined by calibrating the arbitrary signal intensity, SI, scale that reflects the number of moles, m, of free sodium ions within the imaging voxel volume V v such that TSCe = m/V v. The calibration of the sodium MR signal intensity is made by comparing the tissue SIt to the signal intensities SIc of sodium salt solutions at different concentrations, C p, in a phantom under the same imaging conditions and, specifically, the same voxel dimensions. The calibration curve can be fitted with a linear calibration equation:

where A and B are fitting coefficients for the two variables SIc and C p. The experimental TSC for a signal intensity SIt measured in tissue is computed using A and B as


(13.4)

(13.5)
However, the implicit assumption that the transverse relaxation signal losses are the same in brain tissue and the calibration solutions introduces a quantification bias [13]. The different rapid T2 relaxations during spatial encoding for imaging and the use of projection k-space trajectories also contribute to this quantification bias. As the in vivo and in vitro T2 values can be measured, this quantification bias, Q, can be calculated and corrected [12]. The value of Q found from simulations is 0.93 such that

where C t is the actual free sodium concentration in brain tissue.

(13.6)
The complete derivation of Q and the impact of the rapid transverse relaxation of the sodium signal are beyond the scope of this chapter but it is important to note that the dimensions of the voxel element overestimate the spatial resolution of sodium MR images. Furthermore, the MR measurement of TSC can be obtained in units of tissue wet weight, as used by the model above, by converting the voxel volume to mass (wet weight) using the TD. As the mass of tissue in a voxel is V v.TD, the TSCe in units of moles per gram of wet weight is given by


(13.7)
If the TSC unit is required in terms of tissue water content rather than wet weight, (7) could be further divided by the tissue water content, usually reported as around 0.8 [11, 12].
There is good agreement between TSCe and TSCm for normal human brain tissue [8]. As tumors lack cell adhesion, the interstitial space of tumors is expanded and TSC is much higher than in normal brain tissue. Although the pathologist, seeing the abundance of stained nuclei in histological sections of tumor, will describe the high cellularity of tumors, this description is not a comparison to normal brain tissue which is the most densely packed tissue in the body. Tumors have expanded interstitial space.
Given the agreement between the experimental and model estimates of TSC, the model can be used to calculate IVF for tumors from the measured TSCe values and literature values of C c, C i, and TD by rearranging (13.3):


(13.8)
When the voxel of interest contains CSF as well as tissue, the measured TSC must be corrected for the volume of CSF before a value of IVF can be derived accurately. This can be readily done using co-registered proton images that can be obtained at much higher spatial resolution and with high CSF–tissue contrast. Thus, sodium voxels obtained at 5 mm isotropic dimensions can be segmented into tissue and CSF fractions with great accuracy. Even better corrections may be possible using a mixture modeling approach for signal intensities for tissue and CSF [14]. As the CSF sodium concentration is known from the sodium MR measurement in voxels containing only CSF, voxels can be corrected for partial volume averaging effects to obtain IVF in such voxels. For simplicity, this discussion has used the nominal voxel as the unit of spatial resolution. In fact, the appropriate unit to use is the point spread function that is slightly larger than a voxel [13]. This difference arises from the short transverse relaxation of the sodium signal and the use of a projection acquisition that samples a sphere of k-space [13]. However the same principle applies to allow the partial volume correction to be made.
The concept of using sodium MRI to examine brain tumors is not new but dates back to the early development of MR imaging in the 1980s [15]. The technology at that time was insufficient to provide adequate SNR to compete with the development of the more sensitive proton MRI techniques. More recently, quantitative sodium imaging has been applied to human brain tumors but without consideration for monitoring therapeutic responses [16].
Quantitative Sodium MR Imaging Methodology
Conventional clinical MR imaging is based on spatially encoding the MR signal that arises from the nuclei of hydrogen atoms (protons) bound to water and fat. For brain imaging, only protons covalently bound to oxygen in water, at a concentration of approximately 80 M as the brain tissue is about 80 % water, need to be considered. Although the MR phenomenon produces very weak signals, the high concentration of protons and the development of superconducting wide-bore high-field magnets have allowed MR imaging to evolve into a practical medical tool. Clinical MR scanners currently use magnetic fields up to 3.0 T. The proton has the highest intrinsic sensitivity of all the elements of the periodic table and is four times more sensitive than the sodium nucleus. Meanwhile, the sodium ion concentration in brain parenchyma is only about 30–40 mM and, as a quadrupolar nucleus, the rapid biexponential relaxation behavior of the nuclear signal of sodium in tissue is challenging to image. The sensitivity challenge can be met by higher field magnets such as on current 3.0 T clinical scanners and improved still further with 7.0 and 9.4 T scanners designed for human MR imaging. Results from 3.0 and 9.4 T scanners are presented in this chapter.
Because the nuclear relaxation properties of sodium are very different from those of protons, different imaging strategies must be used. Most clinical MR imaging is qualitative and relies only on signal contrast between different anatomical structures and distortions of normal patterns of anatomy to detect pathology. Although sodium MR imaging cannot, as yet, hope to compete with proton imaging for spatial resolution, quantitative sodium imaging does provide highly reproducible values for TSC [8]. The small biological variation in the distribution of TSC for brain tissue reflects the tightly controlled sodium ion homeostasis that is essential for normal function. The small variance of this metabolic parameter is why quantitative sodium MR imaging yields new information that justifies its development for clinical applications.
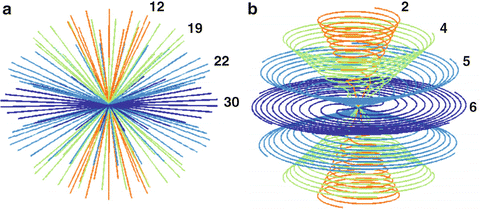
The steps required to perform quantitative sodium MR imaging are presented only briefly as the details have been published elsewhere in the cited articles. The MR scanner should be at or above 3 T and have a broadband capability to operate at frequencies other than the proton frequency specified by the field strength. For example, a 3.0 T scanner operates at 128 MHz for proton imaging but at 34 MHz for sodium imaging. This usually requires the use of a separate multinuclear spectroscopy package (MNS module) that can be supplied by the scanner manufacturers. A head volume radio-frequency (RF) coil tuned to the sodium frequency with corresponding transmit and receive switch and preamplifier must also be purchased. The pulse sequences for the sodium and proton acquisitions must also be obtained along with the image reconstruction software. Proton imaging is required as a part of the sodium signal quantification process to optimize the B0 static magnetic field. The 3.0 T scanner (HDx, CMR gradients, GE Healthcare, WI) used by the Center for Magnetic Resonance Research at the University of Illinois at Chicago has the MNS package with two customized single-tuned head birdcage RF coils for each of the sodium and proton frequencies. The patient lies on the patient table with their head located in a cantilevered head holder that allows the RF coils to be swapped without moving the patient (Fig. 13.1). The proton imaging provides the anatomical imaging and allows very rapid automated linear shimming that is maintained for the sodium imaging and mapping of the B0 inhomogeneities. As the proton and sodium coil are made from the same materials and have identical geometries, the assumption that swapping the RF coils does not alter the B0 homogeneity is reasonable and has been demonstrated [8]. The sodium pulse sequence is the flexible twisted projection imaging sequence (flexTPI) that provides an efficient projection acquisition starting at the center of k-space to minimize signal loss due to the short transverse relaxation times of the biexponentially decaying sodium signal [8]. The k-space trajectories cover a set of nested cones such that, once having moved away from the oversampled center of k-space by a specified radial fraction, the trajectory twists on the surface of a cone to acquire the equivalent of several radial projections at once. This twisting enhances the efficiency while also being constrained to avoid violation of the slew rate limits of the gradient set. Examples of the k-space trajectories are shown in Fig. 13.2. The sodium imaging is performed at different power levels to obtain a B1 map to correct for nonuniform sensitivity of the RF coil across the three-dimensional (3D) field of view (FOV). The quantitative sodium imaging is done in just over 8 min with short TE (0.31 ms), and long repeat times (160 ms or approximately five times the tissue sodium longitudinal relaxation time, T1 = 30 ms), thereby avoiding signal loss from rapid transverse relaxation and saturation effects from incomplete longitudinal relaxation. The proton and sodium imaging are then repeated using a calibration phantom under the same conditions (excitation power and receiver gains) as the patient. The calibration phantom and calibration curve are shown in Fig. 13.3. The calibration phantom is designed to have the same electrical loading of the RF coils as a human head. It contains three separate compartments of different sodium concentrations (30, 70, 110 mM NaCl) in agar gel (3 %) surrounded by a spherical compartment of potassium chloride (60 mM). Although the signal-to-noise ratio of the sodium imaging is sufficient to use a two-point calibration, a three-point calibration confirms the linearity of this step. The only difference between 3.0 and 9.4 T is that the increased sensitivity permits shimming and B0 field mapping to be done directly with the sodium signal saving the time by avoiding the need to exchange the RF coils.


Fig. 13.1
Pictures of (a) the near-identical 1H and 23Na birdcage RF coils and (b) RF coil positioned on the sled that has the cantilevered head holder on the patient table at entrance to the 3.0 T magnet. Similar sodium coils are used at 9.4 T

