, does not contain any position-dependent terms. It is thus necessary to introduce some spatially varying factor that allows distinguishing between spins at different positions in space. This is achieved by abandoning the strict spatial homogeneity of the main magnetic field by superimposing an additional, spatially dependent field. These fields, called gradients, are generated by coils installed inside the magnet bore, which produce magnetic fields that vary linearily in space. An MRI scanner is usually equipped with three gradient coils, producing fields that vary in x-, y– and z-directions. In contrast to the main magnetic field B 0, these additional fields are not constantly active, but are turned on and off in short, well-controlled gradient pulses. Since fast switching of these coils inside the B 0 field generates strong forces on the coils, they start to vibrate, thus generating the loud noise that accompanies MRI examinations.
In the presence of a gradient field
G x that varies linearily in the
x-direction, the total magnetic field has the shape

, where t in the parentheses emphasizes that the gradient varies with time. The spins thus precess with a spatially dependent frequency
This is used in three different ways for spatial encoding, which can be combined to resolve all three spatial dimensions in one experiment: Slice selection is used to selectively excite the spins in a well-defined plane, while frequency and phase encoding produce an image in two or three dimensions.
2 Spatial Encoding
2.1 Slice Selection
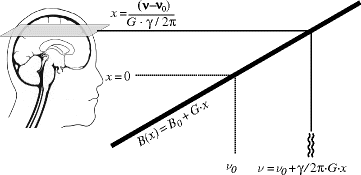
The space dependence of the Larmor frequency in the presence of a gradient can be used to selectively excite the spins within a slice perpendicular to the gradient direction. Since only the excited spins generate a signal, this is used to restrict the imaged volume to a well-defined region. Position and thickness of this slice can be adjusted freely.
The principle of slice selection is simple: If the Larmor frequency changes with position, a radio frequency (rf) pulse with a single frequency only selects those spins that are at the appropriate position (
Fig. 1) where the Larmor frequency is equal to that of the pulse. Changing the frequency of the pulse modifies the position of the excited slice, while its thickness is determined by the
bandwidth, the frequency range, of the pulse.
While this principle seems simple, a few things have to be paid attention to in order to ensure good slice selection.
The excitation profile is never the perfect rectangle that would be optimal for slice selection. Pulses in NMR are usually short (in the order of milliseconds or less) and thus always contain a mixture of many frequencies. To analyse the frequency composition of an rf pulse is again a job for the Fourier transformation:
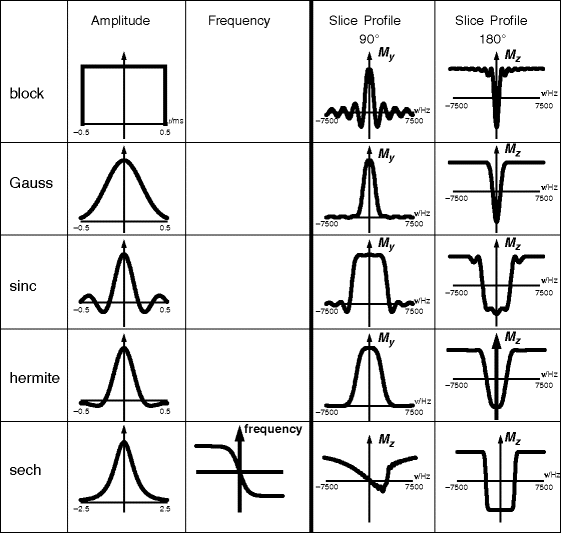
Figure 2 shows the simple case of a short pulse with constant amplitude over its entire duration (
block pulse). The Fourier transform and thus the frequency distribution of this pulse is not at all uniform, but follows a sinc function, defined as

. When we use this pulse for excitation, the slice profile will look similar, which means that the signal is not restricted to the narrow plane in the centre, but also comes from regions of the sample that are distant from the intended slice. Actually, the Fourier transform of the pulse accurately describes the slice profile for low excitation angles (low enough so that

). For higher flip angles, the slice profile will often be significantly different (
see Fig. 3).
In addition to obtaining a good excitation profile, rf pulses have to meet additional requirements. In most cases, they should be short and not require too much power. Additional requirements may come up, e.g. when surface coils with an inhomogeneous
B 1 field are used, or when the application requires special pulse characteristics. To satisfy these demands, the modulation of the pulse amplitude or, less frequently, its frequency is adapted to modify the behaviour of the pulse. In addition, its properties depend on whether it is used for excitation, with flip angles below 90°, refocusing, saturation or inversion. Many pulse shapes have been developed for different applications. Among the most often used pulses are the following (
see Fig. 3):
The block pulse: As described above, this pulse has constant amplitude over its entire duration and a bad slice profile. Its advantage is the low power or short duration required to reach a certain pulse angle. It is usually used for three-dimensional imaging, where the entire sample is excited simultaneously in the absence of a gradient.
The sinc pulse: For small flip angles, the slice profile is the Fourier transform of the pulse envelope. For a perfect, rectangular slice profile, this would be the sinc function. Correspondingly, its slice profile for low angles is quite good, although not perfect due to the finite duration of the pulse which requires an early cut-off of the sinc function. The sinc pulse requires a relatively high power.
The hermite pulse: is a numerically optimized pulse shape for 90° and 180° pulses. The refocusing profile especially is considerably improved in comparison to the sinc pulse. In addition, the required pulse power is reduced.
The Gauss pulse: Its envelope is a Gaussian and so is its Fourier transform. This pulse thus has a definitely non-rectangular excitation shape, but is quite well localized and requires only little pulse power.
The sech pulse: This pulse has the shape of a hyperbolic secant function and is the most prominent example of the group of adiabatic pulses. In contrast to the pulses presented before, not only the amplitude, but also the rf is shaped during the pulse. This gives adiabatic pulses the special characteristics of being able to exactly reach a certain pulse angle, usually 90° or 180°, over a large volume, even if the B 1 field strength varies considerably over this region. This can be guaranteed due to the property of the adiabatic pulses to never exceed the intended flip angle. Sech pulses can be designed for 90° or 180° angles; however, due to their phase properties, they are of only limited use for excitation and refocusing and are usually used for either saturation or inversion.
Many other pulse shapes and modifications of the presented ones have been designed for improving the slice profile or for special purposes.
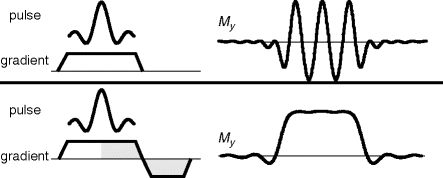
When using any of these pulses for excitation, an additional gradient has to be switched to adjust the phase of the magnetization: right after the pulse (in the presence of a gradient), the slice profile is superimposed by a linear phase dispersion in the direction of the gradient, which is due to the varying precession frequency caused by the gradient during the excitation process. To recover the full signal, this has to be reversed by inverting the gradient after the end of the pulse for half the pulse duration. This rewinds the phase dispersion and the signal corresponds to the desired slice profile (
Fig. 4). The usual excitation module in any imaging sequence thus consists of a slice selection gradient, during which the pulse is played, followed by a rephasing gradient, generated by inverting the first one until phase coherence is reached.
2.2 Frequency Encoding
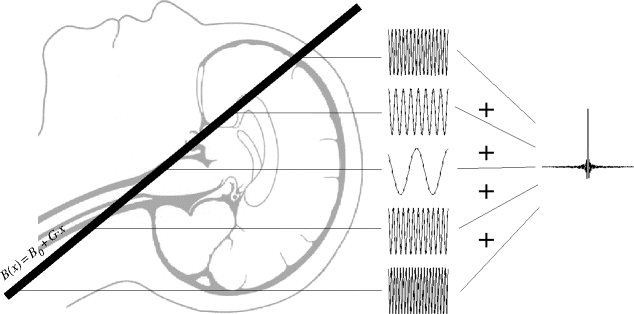
To obtain an image, the excitation (slice-selective or not) has to be coupled with a procedure that achieves spatial resolution in two or three dimensions. One technique that is often used for one direction is turning on a gradient during signal acquisition. The effect of this is to introduce a spatially dependent frequency (
Fig. 5). Similar to spectroscopy, a Fourier transformation then recovers the frequency and, accordingly, the spatial information.
The signal in presence of the gradient is written as
where
ρ(
x) is the spin density, describing the spatial distribution of the spins in the sample, and the gradient is assumed to be constant and oriented in the
x-direction. Again, the signal is not sampled continuously, but in discrete steps separated by the dwell time Δ
t. Analogous to spectroscopy, the Nyquist criterion now determines the value of Δ
t that is necessary to image a certain volume, the field of view (FOV ):
This relation follows directly from the definition of the Nyquist frequency, when the bandwidth is replaced by the gradient term. Thus, a small FOV requires a large gradient or a large dwell time (which also leads to a long acquisition).
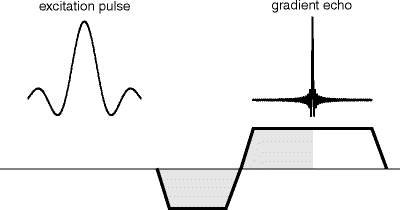
In practice, it is often advantageous to first dephase the spins with one gradient, invert the gradient and thus observe the spins first rephase and then dephase again (
Fig. 6). The signal then grows until the effects of the two gradients compensate and is dephased again under the influence of the second gradient. Since this signal has the shape of an echo, it is called
gradient echo.
2.3 Phase Encoding
The frequency-encoded signal results in the projection of the sample profile perpendicular to the gradient direction. Since it only works in one dimension at a time, the second and third spatial dimensions have to be resolved differently. The most common technique for this is
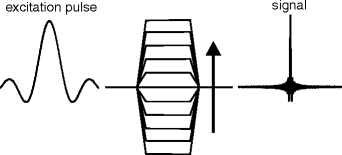
phase encoding. Here, a gradient in the direction to be resolved is turned on for a short time between excitation and acquisition. This gradient will introduce a spatially varying phase
on the entire acquired signal. Here, the gradient is placed under integration to emphasize that it is not constant. The phase of the signal now depends on position. This experiment is repeated with varying phase by changing the strength of the gradient
G(
t) and thus the magnitude of the exponential in Eq. [
4] (
Fig. 7). Since one phase-encoding gradient can only modulate one signal,
N separate and different phase-encoded signals are required to obtain
N points (voxels) in the image.
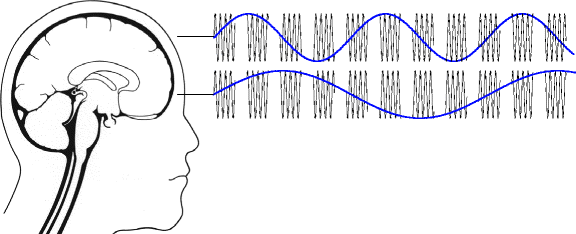
Figure 8 demonstrates the signal modulation during a phase-encoded measurement by following the phase of the first point of the signal through several phase-encoding steps and for two different positions. The phase modulation gets faster with increasing distance from the centre. This is similar to the frequency distribution within a single signal in frequency encoding.
Again, the difference in the gradient strength between the phase encoding steps is determined by the Nyquist limit as
where the last term considers the special case of a phase gradient with constant strength during its entire duration
τ G .
3 The k-Space
Equations [
2] and [
4] show clear similarities which indicate that frequency and phase encoding really are complementary ways for accomplishing the same effect. It is therefore practical to treat both approaches with a common formalism. This is done with the concept of
k-space, defined as
Both frequency and phase encoding now are described by
which shows the analogy to the spectral signal (
see Eq. [
11] in
Chapter 1). Analogously, the Nyquist criterion now determines the distance Δ
k between two acquired points in
k-space as
which applies both to frequency encoding, where it describes the dwell time and thus the bandwidth, and to phase encoding, where it determines the differences in the strengths of the phase-encoding gradients.
Alternatively, this relation can be based on the spatial resolution:
where Δ
x is the size of one voxel and
K is the width of the
k-space region that is sampled in the entire experiment.
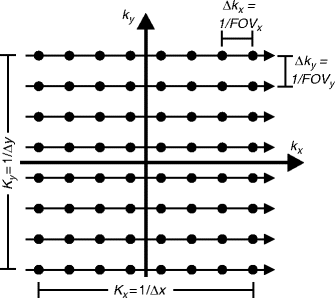
To acquire a two-dimensional image with

voxels with the described techniques, the experiment has to sample a region in
k-space, the size of which is determined by Eq. [
9], while the step size is given by Eq. [
8]. This can be visualized by the
k-space diagram (
Fig. 9).
k-Space is sampled in lines that are acquired by frequency encoding and columns that are covered by phase encoding and thus require a separate signal for each line. This kind of diagram, although not very exciting in this simple case, is often used to describe alternative encoding schemes and experimental procedures.
 , where t in the parentheses emphasizes that the gradient varies with time. The spins thus precess with a spatially dependent frequency
 . When we use this pulse for excitation, the slice profile will look similar, which means that the signal is not restricted to the narrow plane in the centre, but also comes from regions of the sample that are distant from the intended slice. Actually, the Fourier transform of the pulse accurately describes the slice profile for low excitation angles (low enough so that
  ). For higher flip angles, the slice profile will often be significantly different (see Fig. 3).





 voxels with the described techniques, the experiment has to sample a region in k-space, the size of which is determined by Eq. [9], while the step size is given by Eq. [8]. This can be visualized by the k-space diagram (Fig. 9). k-Space is sampled in lines that are acquired by frequency encoding and columns that are covered by phase encoding and thus require a separate signal for each line. This kind of diagram, although not very exciting in this simple case, is often used to describe alternative encoding schemes and experimental procedures.