to fit A 0 and t 1/2 for easy calculation of the cumulated activity as

Here, t 1/2 is the total half-life of the nuclide. A simple time-activity model is needed, because only a small number of activity samples (SPECT/CT images) can be acquired due to time-consuming imaging and inconvenience to patients. A minimum of two time points are needed (because two parameters are fitted: A 0, t 1/2), and acquiring more than four time points cannot be achieved in our clinical practice. However, the present method does not impose an upper limit on the number of time points, and increasing the number of samples improves the fitted TAC. In our case (a private clinic) we settled for two or three time points depending on the ease of travel for the patients.
The 177Lu voxel-point kernel used here is based on a dose-point kernel described in detail elsewhere (Kangasmäki et al. 2012). After fitting the model, several voxel-dose kernels corresponding to different SPECT image voxel sizes (from 1.2 to 9.59 mm) were created. These different voxel-dose kernels were used in artificial image phantom calculations to check against the results reported by Cremonesi et al. (2006). Only one voxel-dose kernel, with 4.79 mm voxel size, was used in the patient dose calculations, because this is the voxel size of the SPECT/CT images.
The calculation of treatment dose is done by 3D convolution of the voxel-dose kernel and cumulated activity. In the calculation, the patient is assumed to be fully water equivalent; i.e., patient inhomogeneities are not taken into account in the actual dose calculation. This does not impose problems, because we are mostly interested in hepatic lesions, bone marrow and kidney doses, which both are almost water-equivalent tissues.
The 3D cumulated activity distribution is obtained after 2–4 SPECT image sets are registered and the exponential time-activity curve is fitted for all voxels; finally, the cumulated activity is integrated when the initial activity and biologic half-life are known for all voxels (Kangasmäki et al. 2012).
All the calculations were done using MATLAB. All programs were written in house. The whole process of reading multiple SPECT images, calculating 3D initial activity, half-life, and cumulated activity maps, and then calculating the 3D dose distribution takes less than 5 min on a typical personal computer. Image registering and registered image resampling take also less than 5 min for one treatment fraction (three time points).
2.2 Clinical Practice
Patient imaging was done with a Siemens Symbia T2 (Siemens, Erlangen, Germany) dual-head SPECT/CT camera with medium-energy all-purpose collimator (MELP). The imaging protocol consisted of whole-body and SPECT/CT images taken at 1 h and 1, 3, and 7 days after the start of 177Lu-DOTATATE infusion. All imaging utilized two photopeaks at 113 and 208 keV energies (15% energy windows) with scatter correction, the higher energy peak with only lower scatter window and the lower energy peak with both upper and lower scatter windows.
In the whole-body imaging, both AP and PA images were acquired with automatic body contouring enabled. The area of interest for the SPECT/CT imaging was determined from the whole-body images. In SPECT/CT imaging, single or multiple bed positions could be acquired. The bed speed was 7 cm/min. The first whole-body image of the series was acquired immediately after the end of infusion, so that this image contained all of the infused activity (the patient was allowed to empty the bladder only after the whole-body image).
The SPECT images were acquired with 128 × 128 matrix, zoom of 1, 30 s per view, and 64 views. If treatment planning imaging was required, similar image sets were acquired, but with imaging of 60 s per view. The CT images covered the whole SPECT image area; 130 kV, 17 mAs was used with B31 kernel filtering for anatomic information and B08 filtering for attenuation correction. The corresponding slice thicknesses for the two differently filtered CT images were 3 and 5 mm.
SPECT images were reconstructed using a Siemens MMWP multimodality workstation. The reconstruction algorithm was FLASH 3D (3D-OSEM) with 8 subsets and 16 iterations. A 10-mm Gaussian filter was applied. The choice of filtering is a compromise, because the same filtering is used for reconstruction of all SPECT imaging (including imaging with preplanning imaging with nominal injected activity of 200 MBq). CT-based attenuation correction was used in the reconstruction. Also scatter correction was used, and scatter-corrected photopeaks were summed to yield final SPECT images. The FLASH 3D reconstruction contains 3D collimator response modeling.
Whole-body images from the 1 h time point were used to double-check the correctness of the SPECT activity calibration. At 1 h, both whole-body images are acquired before the patient is allowed to empty the bladder, so all the infused activity is contained in the body. In this double-check, the total activity contained in the SPECT-imaged body portion is compared with the activity in the thickness-corrected (attenuation) geometrical mean of whole-body AP and PA images of the same area. A 15% difference in the calculated activities between whole-body and SPECT images is considered acceptable.
The SPECT images from 1, 3, and 7 day imaging times were registered to 1 h images (target in the fusions) and then resampled to 1 h slice locations and saved. Registration and resampling were done to assess the time-activity data for each voxel. These resampled images were then used in the 3D dose calculation. The scanner was calibrated for count to activity conversion using several phantoms, including PTW PET CEC emission phantom L981602 (PTW-Freiburg, Freiburg, Germany) to simulate human body.
Before the radiopeptide infusions, the patients received ondansetron or granisetron orally 30 min before the start of i.v. infusion of amino acids. Amino acids (25 g/l Arg, 25 g/l Lys) were infused with total volume of 1,500 mL, starting for 1 h before 177Lu-DOTATATE was administered and then concomitantly via injection pumps. The mean therapy activity of 7.4 GBq was infused within 15–30 min, and the mean interval between therapies was 8 weeks (range 7–9 weeks), with typically 4–6 cycles of 177Lu-DOTATATE given.
Similar conditions were applied for pretherapeutic scanning after receiving approximately 200 MBq of the same Lu-177-DOTA compound.
3 Results
We used approximately 200 MBq Lu-177-DOTA-FCFWLTCTate, i.e., Lu-177-DOTATATE, for serial imaging at 1, 24, and 72 and/or 168 h using amino acid kidney protection (25 g L/l, 25 g R/l) before the actual PRRT. Similar conditions were applied for posttherapeutic scanning after receiving approximately 7.4 GBq of the Lu-177-labeled compound. We used Organ Level INternal Dose Assessment/EXponential Modeling (OLINDA/EXM) and own software for actual dose calculation. Tumor-to-background ratios based on SPECT/CT in liver varied from 4:1 to 15:1. Tumor doses varied from 2 to 110 Gy, normal organ doses in kidneys from 3 to 12 Gy, normal liver from 2 to 20 Gy, and spleen from 2 to 20 Gy per cycle using posttherapeutic scans. We were also able to calculate the bone marrow dose directly from voxel data.
This type of work requires standardized SPECT/CT imaging; i.e., corrections are needed for attenuation and scatter, in order to create a CT-based attenuation map and iterative reconstructions with scatter corrections, which form the basis of quantitative SPECT imaging. Partial-volume corrections may be taken into account in dose maps. Additionally, the imaging system has to be calibrated using phantom studies. The errors related to uncertainties are described in detail elsewhere, but they are in the range of 10–15% (1 SD) (Kangasmäki et al. 2012).
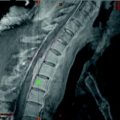
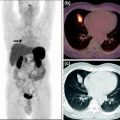
Figure 1 shows typical SPECT/CT findings in a NET patient with multiple liver metastases and single solitary lung and skeletal metastases; this study was performed after a therapeutic Lu-177-DOTATATE dose. Figure 2 demonstrates serial SPECT registrations. These SPECT/CT registrations are aligned to each other to create a voxel-by-voxel time-activity map, i.e., voxel half-life map. Figure 3 illustrates one of our software tools. The calculated dose distribution can be overlaid, e.g., on CT images, and it is possible to create dose–volume histograms. Figure 4 shows the 3D dose distribution overlaid on the CT part of the SPECT/CT study. Here a relative scale is shown, but it can easily be presented on an absolute scale.
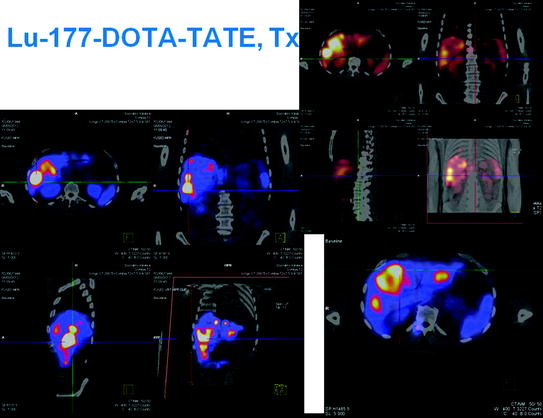
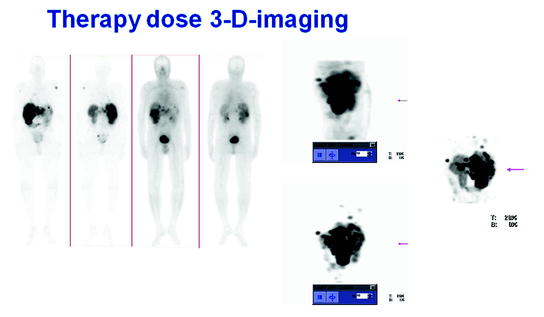
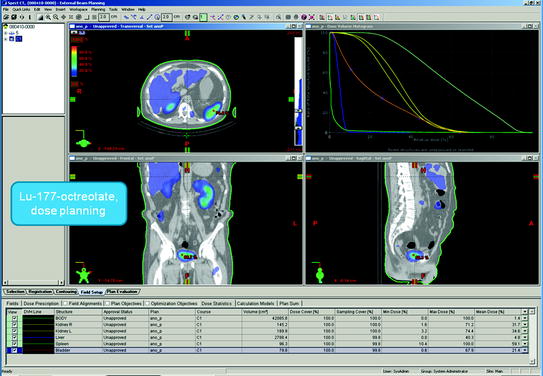
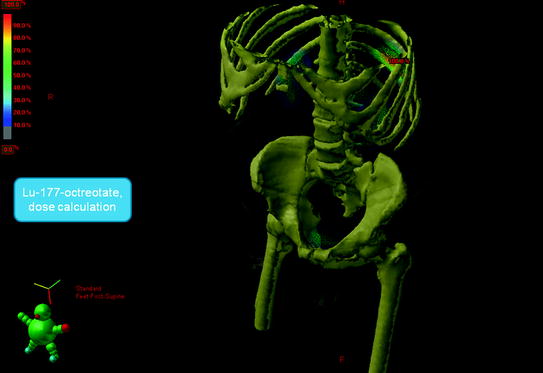

Fig. 1
Typical single photon emission computed tomography (SPECT/CT) findings in a NET patient with multiple liver metastases and single lung and skeletal metastases; this study was performed after a therapeutic Lu-177-DOTA-octreoTATE (DOTATATE) dose

Fig. 2
Serial single photon emission computed tomography (SPECT) registrations, aligned on each other to create a voxel-by-voxel time-activity map, i.e., voxel half-life map

Fig. 3
One of our software tools. The calculated dose distribution can be overlaid, e.g., on CT images, and it is possible to create dose–volume histograms

Fig. 4
The 3D dose distribution on the CT part of the single photon emission computed tomography (SPECT/CT). Here a relative scale is shown, to emphasize skeleton on CT, but it can easily be presented on an absolute scale and with other color scales
Table 1 demonstrates the pretherapeutic and therapeutic organ doses in various organs. Bone marrow dose was <0.5 Gy in all patients where serial pretherapeutic and posttherapeutic scannings were applied. Kidney doses were very similar.
Table 1
Calculated pretherapeutic (Dx) and therapeutic (Tx) absorbed radiation doses for Lu-177-DOTATATE in kidneys, spleen, liver, bone marrow, and tumor tissue based on 4D SPECT/CT registration using aligned 3D voxels as basic information (4.8 mm × 4.8 mm × 4.8 mm size, cumulative activity, voxel mean residence times, cumulative dose)
Patient age | Kidney R Dx | Kidney R Tx | Kidney L Dx | Kidney L Tx | Spleen Dx | Spleen Tx | Liver Dx | Liver Tx | Bone marrow Dx | Bone marrow Tx | Tumor Dx | Tumor Tx |
|---|---|---|---|---|---|---|---|---|---|---|---|---|
1/m 65 | 10.0 | 10.0 | 10.0 | 10.5
Stay updated, free articles. Join our Telegram channel
Full access? Get Clinical Tree
 Get Clinical Tree app for offline access

|
