Phenotypes
1
2
3
4
Anovulation
+
+
−
+
Hyperandrogenemia
+
+
+
−
Polycystic ovarian morphology
+
−
+
+
Classic PCOS
Newer PCOS
The unstable and relatively common finding (20–25 %) of polycystic ovarian morphology in the general population [8, 9] triggered the opposition of Androgen Excess Society which stated that PCOS is a primarily androgen excess disorder and this feature should be a prerequisite for the diagnosis of the syndrome. Subsequently, according to Androgen Excess Society, one of the two newer phenotypes with polycystic ovarian morphology and anovulation could not be defined as PCOS [10]. However, this opinion is not widely accepted and is currently under investigation.
The Polycystic Ovarian Morphology
The polycystic ovarian morphology, as defined in Rotterdam, is conditioned by two elements, the presence of 12 or more follicles (2–9 mm of diameter) and/or ovarian volume more than 10 cm3, in a single or both ovaries. This definition leaves no margin for subjective assessments regarding the diagnosis which can be set even with polycystic morphology in a single ovary. Women taking an oral contraceptive pill cannot be diagnosed as the pill reduces the ovarian volume despite the possible persistence of polycystic morphology [4, 5, 11]. In the case of a dominant follicle (>10 mm) or a corpus luteum, the ultrasonography should be repeated in the next cycle while an abnormal cyst or ovarian asymmetry requires further investigation [4, 5, 12].
The use of state-of-the-art equipment and well-trained operators are some of the technical requirements that should be met for successful examination. Furthermore, the transvaginal approach, whenever possible, and especially in obese women, is highly recommended. Importantly, the scan should be performed during the early follicular phase (days 3–5) of a spontaneous cycle in women with regular cycles and of a progesterone-induced bleeding episode or randomly in women with irregular cycles [4, 5]. The time of the day is meaningful only if Doppler examination is performed due to the diurnal variation in uterine and ovarian blood flow [13, 14].
The current definition of polycystic ovarian morphology makes no reference to the distribution of the follicles, the stromal brightness (echogenicity) and volume as well as to the uterine size and its relationship to the ovarian size, and, finally, to the blood flow through the uterine and ovarian arteries, including the intraovarian stromal blood flow.
The typical polycystic ovary was initially described by Adams et al. as an enlarged ovary with highly vascular and hyperechogenic stroma, compared to the cortex, and with many small follicles arranged in the periphery [15]. The follicles are at least ten and their diameter ranges between 2 and 8 mm, but are usually symmetrical and measure between 2 and 5 mm. The growth of these gonadotropin-dependent antral follicles is halted due to the aberrant folliculogenesis of the syndrome. Interestingly, the cohort of small follicles of 2–5 mm of diameter seems to be a better indicator of the ovarian reserve [16] and is negatively determined by the age [17].
On the other hand, the term multifollicular ovary refers to an ovary with many small follicles of variable size, scattered through an increased amount of stroma, but not in the classic type of “necklace” as in the polycystic ovary. The multicystic ovary may represent a milder disturbance of the ovary where normal folliculogenesis happens to some degree [18]. Multicystic ovaries are common in early adolescence and in the majority regress without evolving to PCOS [19].
Asymptomatic women with only polycystic ovarian morphology are commonly found in the general population up to 32 % of women [20]. These women may conceal some mild abnormalities of androgen secretion, insulin sensitivity, and glucose metabolism [21–23], though the data are still contradictory [20]. The sole presence of polycystic ovarian morphology seems to recede with age, and especially after the age of 35 years [20, 24]. However, when women with polycystic ovarian morphology are subjected to controlled ovarian stimulation and ovulation, as an infertility treatment, they behave like women with PCOS and are faced with an increased risk of hyperstimulation and ovarian hyperstimulation syndrome (OHSS) [25–27]. Indeed, Swanton et al. found that the rates of severe OHSS were similar between women with polycystic ovarian morphology and PCOS and significantly higher compared to controls [25]. In spite of significantly lower doses of FSH, women with both polycystic ovarian morphology and PCOS responded with higher estradiol level numbers of retrieved oocytes to controlled ovarian stimulation [26, 28, 29].
Furthermore, serum, basal anti-Mullerian hormone (AMH) levels of women with polycystic ovarian morphology were found intermediate between controls and women with PCOS, despite the low androgen levels, suggesting a granulosa cell abnormality [30]. Likewise, AMH concentrations and follicle numbers, after controlled ovarian stimulation, were shown higher in women with polycystic ovarian morphology compared to controls and lower compared to PCOS patients with polycystic ovarian morphology and hyperandrogenism [31].
Regardless of the response and the possibility of OHSS, there was no difference in fertilization, implantation, clinical pregnancy, and live birth rates among women with polycystic ovarian morphology and PCOS and controls [25, 26, 32]. Importantly, women with polycystic ovarian morphology had similar oocyte and embryo quality with women with PCOS, but significantly lower miscarriage rates [28].
In conclusion, the ultrasound assessment of polycystic ovarian morphology is very useful for the diagnosis of the PCOS and possibly its severity and prognosis, the surveillance of the controlled ovarian stimulation in such patients, the prediction of outcome following fertility treatments, the diagnosis of OHSS, the decision of turning to in vitro oocyte maturation in these women, and the diagnosis of other genital tract anomalies and even endometrial hyperplasia that are often overlooked [4, 5, 25, 33, 34]. A point to consider during every ultrasound scanning is that the diagnosis of polycystic ovarian morphology does not exclude other underlying causes of infertility as well as internal genitalia malformations.
Follicle Number and Size
The antral follicle count (AFC) is a direct quantitative marker of ovarian reserve and responsiveness [35]. The follicular number shows an annual loss of 0.35–0.95 antral follicles per year following the reproductive ageing of women [36]. There is a high correlation between AFC and reproductive age which is widely applicable in assisted reproduction treatments [37, 38]. The visible follicle by ultrasound means is the result of a sophisticated journey of an oocyte through the reproductive life of a female. A follicle is an oocyte surrounded by granulosa cells. The follicle grows by a small increase in the oocyte volume, a significant proliferation of the surrounding granulosa cells, and an expansion of the antral cavity. There are three stages of follicles: primordial, early growing, and antral [39, 40].
Primordial follicles have a very small size of less than 0.05 mm and are not visible [41]. Early growing follicles are less than 2 mm and comprise of large primary, secondary, preantral, early antral, and small antral follicles [39]. Several months are required for a new growing follicle to reach the preantral stage (0.15 mm) and 70 additional days to reach the size of 2 mm. Early growing follicle growth is unaffected by cyclic hormonal fluctuations and is regulated by subtle interactions between FSH and local factors produced by theca and granulosa cells, as well as the oocyte [42].
Only a small number of preantral follicles progress to antral stage which are more than 2 mm and become selectable during the late follicular phase [43]. From the time they enter the selectable stage during the late luteal phase, follicles become sensitive to cyclic changes of FSH in terms of granulosa cell proliferation. These are the follicles that contribute to the hormonal cyclic profile depicted in the classic diagram of the menstrual cycle. Indeed, as the follicle develops, its responsiveness to gonadotropins progressively increases under the control of local factors acting in an autocrine/paracrine fashion [42].
The number of these selectable follicles, especially the small antral (2–5 mm), is believed to reflect the number of remaining primordial follicles and, thus, the ovarian reserve [44]. Their number is also strongly correlated with serum AMH levels [45]. The larger follicles >6 mm are totally gonadotropin dependent and one of them will evolve to dominant during the next follicular phase, while the rest will become atretic. So, in this phase, all other healthy follicles with granulosa cell activity tend not to exceed 6 mm, suggesting that all larger follicles are possibly atretic and do not reflect the actual reproductive capability of the woman [46, 47]. Exogenous gonadotropin administration during IVF rescues these small antral follicles from atresia and promotes their growth. Eventually, the retrieved oocytes by follicle aspiration come from this cohort of visible follicles.
PCOS is related to an excess in small antral follicles of 2–5 mm [16]. Although the pool of growing primary and secondary follicles in women with the syndrome is two- to threefold that of normal ovaries, the pool of primordial follicles is normal [48]. This excess is drastically involved in the follicular arrest of PCOS, presumably through an auto-inhibiting effect that could involve AMH. Still, the 6–9 mm follicles also appear to be affected by the unfavorable environment of the syndrome [49].
The follicle number, using two-dimensional (2D) ultrasound, is estimated both in longitudinal and anteroposterior cross sections of the ovaries, as the performer slowly moves the transducer from one side of the ovary to the other. After the identification of the ovary, a scout sweep is performed in the two planes and the largest follicle is localized. Then the counting is performed starting from the outer ovarian margin to the opposite. The procedure is repeated with the contralateral ovary [39]. It has been observed that the number of follicles counted by 2D is overestimated compared to oocytes retrieved, and even more in ovaries with many follicles as the polycystic when they are stimulated, possibly because of double counting (repetitions) and inclusion of atretic follicles [39, 50].
The size of follicles in 2D ultrasonography is expressed as the mean of the diameters measured on the two aforementioned sections [4, 5]. However, in clinical practice, three techniques are applied [51]. The first includes a single measurement of the maximal diameter in the longitudinal plane; the second includes an additional measurement of a diameter at 90° to the first; and the third is expanded to the measurement of a perpendicular to the previous two diameters in the transverse plane, after manual rotation of the transducer. In the latter two cases, the diameter is the mean of the two or three diameters, respectively.
Alternatively, the size of a follicle could be defined by its volume. For optimal in vitro fertilization (IVF) outcome, the follicular fluid volume should be more than 1 and up to 7 mL, which corresponds to a spheroid follicle of diameter of 12–24 mm [52]. The follicular volume can be calculated by 2D ultrasound from the mean diameter using the formula of a sphere: 4/3 × π × diameter [53]. When the mean diameter is estimated by the three follicular diameters, as described above, it is more accurate [51]. Follicles scarcely have the shape of a sphere; they usually are more elliptical, and therefore, the formula of a sphere does not provide an accurate estimation of the volume [54].
This matter has been addressed by the three-dimensional (3D) calculation of follicular volume which can be assessed by two ways: manually and automatically. The manual measurement is performed more often by the program Virtual Organ Computer-aided Analysis (VOCAL®). Initially, the data is acquired by an automatic mechanical sweep of the region ensuring that the entire ovary is included. The process is repeated for the contralateral ovary and the data are saved. The data are then processed using VOCAL. Each follicle is delineated manually by tracing around its perimeter and the volume of interest is calculated automatically.
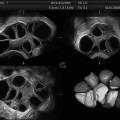
The automatic technique is performed by the program Automatic Volume Calculation (SonoAVC®). The data are captured as described above and then processed by SonoAVC after right positioning. This program identifies every single follicle with a specific color and then automatically calculates the mean diameter (relaxed sphere diameter), the maximum dimensions (x, y, z), and the follicle volume (Fig. 7.1). This later method is highly valid and provides more accurate values than those estimated from 2D measurements and automated measurements of follicular diameter as well as calculated using VOCAL [50, 51, 55].
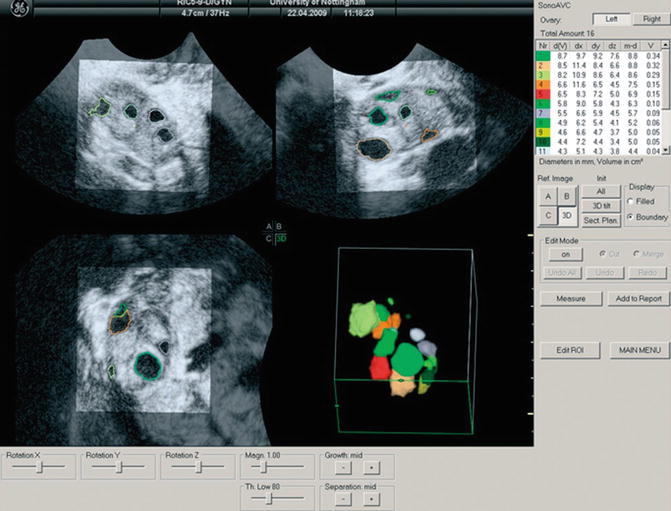
Fig. 7.1
Multiplanar display of an ovarian three-dimensional ultrasound dataset by SonoAVC. Each follicle has a specific color and its measurements are displayed on the right side (Reprinted from Deb et al. [47]. With permission from John Wiley & Sons, Inc.)
Antral follicle count can also be performed by 3D ultrasound. Data are acquired as described above. There are three ways to count the follicles. In the first, the observer counts manually the follicles in a multiplanar view that is using all three perpendicular planes simultaneously in order to enhance the spatial awareness. In the second way, the ovary is defined by VOCAL, inversion mode is applied and the follicles are displayed without the surrounding ovarian tissue, and, finally, the counting is performed in multiplanar view (Figs. 7.2 and 7.3). In the last way, SonoAVC displays every single follicle in a specific color in an inversion mode, again without the ovarian tissue (Fig. 7.1). SonoAVC can distinguish follicles of 1–2 mm of diameter and provides the option of post-procession where manually the observer picks any missed follicles or excludes any that has been included incorrectly. Post-procession seems necessary since SonoAVC misses follicles of random sizes that are easily recognized in the multiplanar view due to their specific color [57].
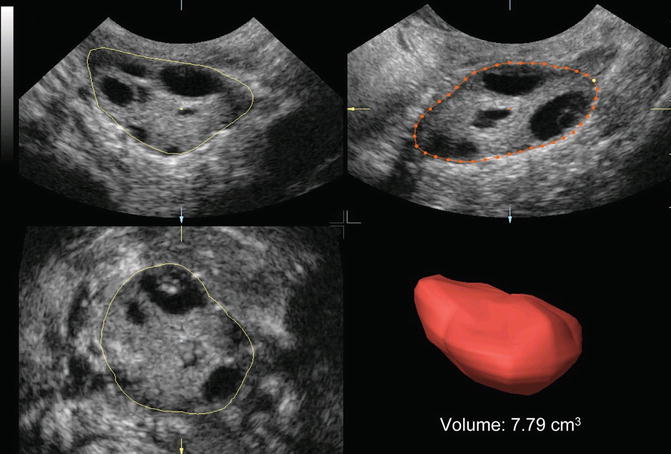
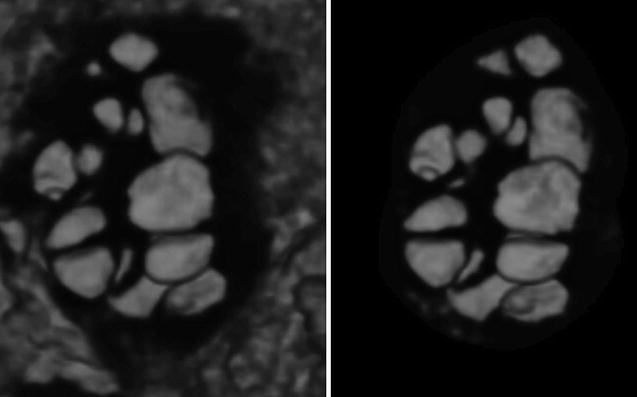
Fig. 7.2
Ovarian volume calculation using VOCAL before the application of inversion mode (Reprinted from Jayaprakasan et al. [56]. With permission from Oxford University Press)
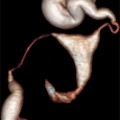
Fig. 7.3
Ovarian volume calculation using VOCAL after application of inversion mode (Reprinted from Jayaprakasan et al. [56]. With permission from Oxford University Press)
Ovarian Volume
Women with PCOS have a larger ovarian volume [12, 15, 16, 58, 59]. The ovarian volume declines with age as the follicle both in women with PCOS and controls, but this decline does not correlate so well with age as the follicle number does [36, 60, 61]. The pattern of the ovarian volume falling in women with PCOS is different because declines less markedly than of controls despite the similar decline in follicle number. This fact suggests that the stroma plays a significant role [61, 62] and also the size of the follicles, because the decrease with age affects mainly the number of small follicles (2–6 mm) but not of bigger follicles (7–10 mm) in women with PCOS [63]. Alsamarai et al. demonstrated a linear decline in ovarian volume and concluded that age-dependent criteria for the diagnosis of PCOS are necessary [61]. This point could be of value in assisted reproduction field as the patients are very often more than 40 years old, but still in danger for OHSS.
The calculation of the ovarian volume is performed either using the formula for a prolate ellipsoid (0.5233 × length × width × thickness) [4, 5] or automatically by the software of the ultrasound equipment just outlining the ovary. The simplified formula, 0.5 × length × width × thickness, is practical and easy to use. The polycystic ovarian morphology is diagnosed when the ovarian volume exceeds 10 cm3 [4, 5]. This consensus definition was based on the findings of studies that investigated the sensitivity and specificity of a diagnostic cutoff level [16, 58, 59]. However, other volume thresholds have been proposed subsequently [64, 65].
Again 3D ultrasound provides a more reliable, accurate, and reproducible assessment of ovarian volume than the 2D-based methods, with better spatial information and the ability to correct any shape irregularities [66–68]. 3D ultrasound also confirmed the greater ovarian volume of women with PCOS [69–72]. There two ways to calculate the ovarian volume: the conventional full planar technique and the VOCAL program. During the conventional method, the observer scrolls through one plane of the multiplanar display and simultaneously delineates the ovary in a different plane [68, 72]. With VOCAL program, the observer manually defines the contour of the ovary, while the dataset is rotated through 180° [72] (Fig. 7.4). Raine-Fenning et al. compared the two techniques and found that measurements with VOCAL program are superior to conventional, though comparable [72, 74].
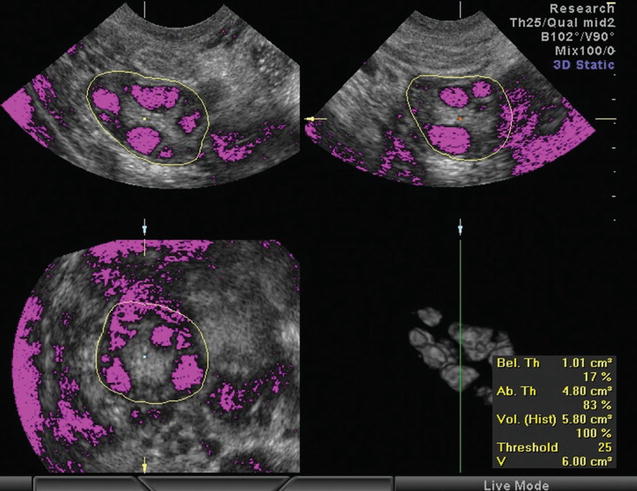
Fig. 7.4
Calculation of stromal volume determining the stromal and follicular area by setting a threshold of voxels (Reprinted from Lam et al. [73]. With permission from Oxford University Press)
Stromal Area, Volume, and Echogenicity
Despite the fact that increased stromal area and echogenicity are not included to the diagnostic criteria of PCOS, they are still characteristic ultrasonographic features of the syndrome [59, 75]. Patients with PCOS present higher stromal area and volume [59, 62, 73, 75–79] with the exception of a Chinese PCOS population [69]. Stromal hypertrophy is a common and specific indicator of ovarian hyperandrogenism [75]. The hypertrophic theca cells in the stroma of women with PCOS produce higher amounts of androgens [77]. Indeed, ovarian stromal area was found to correlate with androgen levels and Free Androgen Index (FAI) [62, 75, 80]. In clinical practice, the measurement of ovarian volume is a good surrogate for the stromal volume, because increased stromal volume is the main cause of ovarian enlargement in PCOS, except for patients taking contraceptive pills [4, 5, 12, 75].
Another marker of stromal hypertrophy is the stromal area to total ovarian area ratio (S/A). S/A is the stromal area defined by the periphery of the hyperechoic stroma divided by the total ovarian area defined by the perimeter of the ovary in the maximum plane section [81, 82]. Women with PCOS have a higher S/A value when compared to women with polycystic ovarian morphology or controls, whereas the last two groups do not differ significantly [79]. Furthermore, S/A ratio in women with PCOS correlates well with androstenedione, testosterone 17a-hydroxyprogesterone, FAI, and insulin levels [75, 79, 80, 82, 83]. S/A ratio could be the most efficient ultrasound performance for hyperandrogenism [34, 82]. In this line, a cutoff value of S/A of 0.32 is the best predictor of elevated androstenedione and testosterone levels. This cutoff value could be used in everyday clinical practice and even included in the diagnostic criteria of the syndrome [82, 83].
2D ultrasound measurement of stromal area can by performed by two ways: the manual and the semiautomatic. In the first method, the area is calculated using the formula for an ellipse: π/4 × length × width (0.78 × length × width or simplified to 0.8 × length × width). In the second method the stromal area is defined by delineating its perimeter and is then calculated automatically by the ultrasound machine [12]. 3D measurement of stromal volume is achieved either after the calculation and subtraction of the total follicular volume from the total ovarian volume [62, 77] (these 3D techniques have already been described in the previous paragraphs) or using VOCAL program and by determining a limit area (number of voxels) which determines the stromal and follicular area (Fig. 7.4). Thus, above and below the limit are calculated the stromal and the follicular area, respectively [77].
Stromal echogenicity had been a key feature for many years [59, 84, 85] until the first more objective assessments showed that there was no significant difference in stromal echogenicity between women with PCOS and controls [76, 86]. 2D ultrasound measurement of stromal echogenicity can be either a subjective operator assessment [59, 84, 85] or an objective calculation derived by the intensity level of the ultrasound pixels within the stroma displayed on the sonographic image [81]. The difference found with the first subjective measurements was attributed to increased volume of ovarian stroma in relation to the lower mean echodensity of the ovary due to the higher number of follicles [76]. Another marker of echogenicity is the stromal index which is the ratio of the mean stromal echogenicity to the mean ovarian (total) echogenicity [86]. Stromal index was found higher in PCOS [76] but this was not confirmed [86].
3D ultrasound assessments of stromal echogenicity were in accordance with the 2D objective calculations which showed no difference between women with PCOS and controls [77, 78, 87, 88]. The 3D assessment of echogenicity is performed by the mean gray (MG) value that is calculated automatically by the VOCAL program (Fig. 7.5). The MG value represents the mean tissue density of a defined area and is calculated by the mean signal intensity of the grayscale voxels [77, 87, 88]. 3D ultrasound is considered more appropriate for the quantification of the stromal echogenicity especially for research purposes [71].
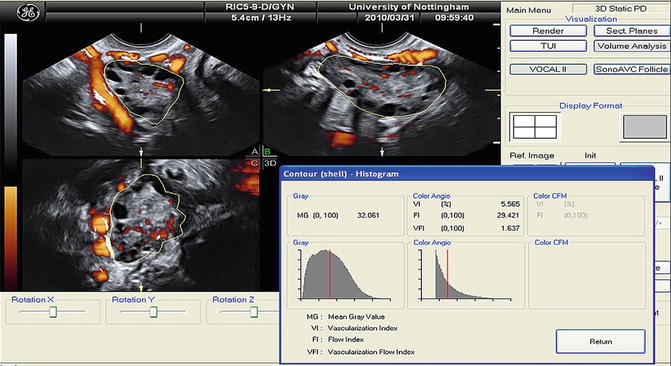
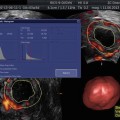
Fig. 7.5
Mean gray value (MG) and 3D power Doppler indices within the ovarian volume delineated using VOCAL (Reprinted from Deb et al. [89]. With permission from Elsevier)
Ovarian Stromal Blood Flow
The ovarian stromal blood flow was traditionally believed to be higher in women with PCOS compared to controls [12, 70, 90–95] until the publication of some contradictory studies [77, 78, 96, 97]. The higher blood flow was explained by the reduced resistance in the ovarian and stromal vessels found by some investigators [92, 93]. Interestingly, the results of both 2D and 3D ultrasound examinations are conflicting. The controversy in literature could be explained by the different study designs, selection of controls, criteria used for the definition of PCOS, the lack of hormonal assessments, the variety in ultrasound equipment and settings, and, finally, the arbitrary selection of vessels in 2D ultrasound [77, 97].
2D ultrasound assessment of blood flow could be subjective through color Doppler maps that are no longer used or objective by measuring flow velocity and resistance with pulsed-wave Doppler (PWD). PWD is used to depict the flow velocity waveform from the vessel of interest. Angle correction is applied whenever necessary to fit the incident beam. The waveforms are then analyzed manually (at least three optimal waveforms in a row) or automatically to calculate peak systolic velocity (PSV), end-diastolic velocity (EDV), resistance index (RI), pulsatility index (PI), and, lately, capacitance index (CI), which is the area under the curve for the diastolic part of the waveform, and S/D ratio that is the ratio of the PSV divided by the EDV [77, 97]. A strong correlation was reported between stromal PI and LH/FSH [98].
3D ultrasound assessment of blood flow is easy to perform. When the power Doppler signal is optimal, the 3D volume box is opened and a 3D sweep scan is performed. Then the VOCAL program quantifies the information using the histogram facility, and the blood flow indices are calculated automatically (Fig. 7.5). Vascularization index (VI) represents the ratio of color voxels within the total dataset relative to both color and gray information, providing, thus, an indication of the number and/or size of the vessels lying in the area of interest and, therefore, the degree of vascularity. Flow index (FI) is the mean power Doppler intensity, and as the intensity of the signal is dependent on the number of erythrocytes within a given volume at any time, this index is considered reflective of the volume flow rate. Vascularization flow index (VFI) represents the ratio of the weighted color voxels to total voxels and gives a unified value for both vascularity and volume flow reflecting the tissue perfusion [99].
These indices are all significantly affected by volume flow, attenuation, vessel number, and erythrocyte density, but in different ways. The VI and VFI seem to have a more predictable relationship, whereas the FI often demonstrates a more complex cubic relationship that is not always logical. Further work is required before a better understanding of 3D power Doppler ultrasound imaging is achieved [100]. However, the findings are controversial even with 3D power Doppler. Some studies showed increased vascularity and blood flow in the ovaries of women with PCOS [88, 101–103] explained possibly by the higher vascular endothelial growth factor (VEGF), while others did not report any significant difference [69, 77, 78, 87, 88]. Higher ovarian VFI was correlated with lower BMI, hyperandrogenism, greater LH/FSH values, ovarian volumes, and follicle numbers [77, 78, 103]. The 3D ultrasound approach is preferable because it provides the possibility to examine the blood flow and vascularization in the whole ovary, avoiding the arbitrary selection of a single vessel, or even to define a region and calculate separately the flow within and around this region [71, 104].
Uterine Size and Perfusion
Literature references upon uterine ultrasound characteristics in PCOS are scarce. The uterine volume has been found either smaller [105, 106] or bigger [15, 107] in women with PCOS and lower in 40 % of adolescent with the syndrome [108], and also in correlation with LH [107]. In few studies, a new criterion was suggested, the ratio of ovarian to uterine volume with an upper limit of 1.0 which was doubted and abandoned [106, 109]. Endometrial thickness was diverse in women and adolescents with PCOS [108, 110, 111] without correlation with the time interval since the last period [108]. Nevertheless, in a recent study, there was no difference in endometrial thickness and volume between women with PCOS and controls [112].
The uterine and endometrial blood flow was found lower in women with PCOS [91, 92, 103, 108, 113–117] with the exemption of a recent study [112]. The lower uterine and endometrial blood perfusion is reflected in higher values of Doppler indices as PI and RI in PCOS and is correlated with obesity and hyperandrogenemia (higher levels of androstenedione, DHEAS, and LH/FSH) [91, 92, 116, 117]. Furthermore, uterine perfusion increases with exogenous estrogen and progesterone as well as antiandrogen administration [113, 118], while there is a significant negative correlation between estrogens and uterine PI [119]. This impaired uterine perfusion was associated with metabolic disorders and risk factors for cardiovascular events [114, 115]. The only study to investigate the endometrial blood flow with 3D Doppler did not reveal any significant difference between PCOS and controls in 2D pulsed-wave (uterine arteries) and 3D power Doppler (endometrial and subendometrial blood flow) indices, apart from significantly disturbed endometrial perfusion in women with PCOS and clinical signs of hyperandrogenemia diagnosed only by 3D Doppler [112].
Ultrasound and Assisted Reproduction Outcome
Related posts:
 Ultrasound in Reproductive Medicine: Is It Safe?
 Evaluation of Tubal Patency (HyCoSy, Doppler)
 Focused Ultrasound for Treatment of Fibroids
 Ovarian Reserve and Ovarian Cysts
 Virtual Hysterosalpingography: A New Diagnostic Technique for the Study of the Female Reproductive Tract
 The Normal Ovary (Changes in the Menstrual Cycle)
Stay updated, free articles. Join our Telegram channel

Full access? Get Clinical Tree


