Introduction Osteoporosis has been defined as “a chronic progressive disease characterized by low bone mass and microarchitectural deterioration of bone tissue, which leads to bone fragility and a consequent increase in fracture risk.”1,2 Osteoporosis usually causes no symptoms unless a person has a fracture. Osteoporotic fractures tend to occur most commonly in sites of the skeleton that are rich in trabecular bone: the wrist, spine, and hip. Osteoporosis is a major risk factor for fractures of the hip, vertebrae, and distal forearm. Osteoporosis has lately been recognized as a disease of growing importance because demographic changes have led to an increased burden of morbidity and mortality due to osteoporotic fracturing. By the age of 80, 40% of women and 20% of men can be expected to have suffered an osteoporotic spine fracture. Osteoporosis can be prevented by lifestyle changes, and several effective drug treatments have recently become available to treat the disease by increasing bone density and reducing fracture incidence. Vertebral fractures are the hallmark of osteoporosis, and occur with a higher incidence earlier in life than any other type of osteoporotic fracture (hip, forearm). About 60% of vertebral fractures occur without symptoms. Symptomatic and asymptomatic vertebral fractures are associated with increased morbidity and mortality. Morbidity, such as decreased physical function and social isolation, is associated with these fractures and has a significant impact on the patient’s overall quality of life. After a lumbar vertebral fracture patients must remain in bed for approximately 1 month and suffer, on average, half a year of limited activity.3 Important factors in therapy management for prevention of both osteoporosis and osteoporotic fractures are preventive measures that can help estimate the risk of fracture. Measurement of bone density is, besides age, the best predictor of fracture risk and facilitates prevention and therapy that is not dependent on an actual fracture for a diagnosis. Recently, considerable improvements have been made in therapeutic interventions to both increase bone density and reduce future fracture risk.58,59 Such therapy regimens include the use of bisphosphonates (etidronate, alendronate, and risedronate) and the selective estrogen receptor modulator. These therapies have been added to hormone replacement therapy, which is known to be effective in preventing bone loss in post-menopausal women. Decades ago, osteoporosis was only diagnosed if a lowtrauma fracture occurred. A precise definition of osteoporosis in terms of bone densitometry was published by a working group of the WHO in 1994 (Table 14.1).60 This definition is based on DXA measurements made in the lumbar spine, proximal femur, and forearm in menopausal white women. The WHO definition is as follows : The SD of 2.5 was defined as the level of BMD in postmenopausal women that identifies 30% of these women as having osteoporosis and who were thought to suffer a vertebral fracture in their lifetime. The BMC is given in grams, and the area of the measured site in square centimeters. By dividing the BMC by the projected area, BMD is given in g/cm2. It is very important to realize that the WHO definitions do not apply to all patients or to all sites measurable or to all techniques (e. g., QCT).4–6 The T- and Z-scores were developed because of the variation in BMD measurement technology among different manufacturers. Therefore, the BMD results are expressed as standard deviations from the referent mean.
Definition
Osteoporosis
T-Score and Z-Score
| WHO definition of osteoporosis | T-score |
| Normal | Score higher than 1T |
| Osteopenia | Lower than < 1T, but not as low as 2.5T |
| Osteoporosis | 2.5T or less |
| Established osteoporosis | 2.5T or less and one or more fragility fractures |
The referent mean for a T-score is the bone mineral density of young normal individuals. The T-score is the number of standard deviations by which an individual’s BMD differs from that of healthy young adults of the same sex. The lower the T-score, the more fragile the individual’s bones are. The T-score is, therefore, a rough indication of the need for treatment in patients 20 years of age and older. In children and adolescents, the Z-score serves an analogous function.
The referent mean for a Z-score is the bone mineral density of age-matched normal individuals. The Z-score is the number of standard deviations by which an individual’s BMD differs from that of healthy age-matched individuals of the same sex. Until peak bone mass has beenreached(i. e., in children and young adults upto approximately 25 years), interpretation can be made only with comparison to an age-matched mean (Z-score).7
In calculating a change over time, the absolute BMD values (g/cm2) must be used. Due to the slow bone mineralmetabolism in individual patients, there must be an intervening period of at least 18-24 months between measures in longitudinal studies to ensure significant change has taken place.8 Alternative methods of interpretation include determining a percentage or percentile of expected—age-or sex-matched—peakbonemass.
At all ages, the relative risk of fracture doubles for each unit decrease in the T-score, regardless of the skeletal location used to calculate that score. It should be remembered that bone mass is a continuous variable. Therefore, the purpose of a bone density measurement cannot be a qualitative diagnosis of osteoporosis as an all-or-nothing finding. The purpose is to achieve a quantitative assessment of fracture risk, which is itself a continuous variable. For radiologists who interpret and report bone density studies an understanding of the clinical background is important for the diagnosis and follow-up of osteoporosis in the patient, as is communication of the results to clinicians.
Vertebral Fragility Fracture
Although whether a patient suffers a fracture depends on a number of factors (tendency to fall, the nature of the fall), about 60-70% of bone strength is related to BMD and determines whether a fracture will occur.
The relative risk of a spinal fracture for every 1 SD reduction in age-adjusted mean BMD has been reported to be2.3 g/m2.9Avertebralfractureinapatientwithosteoporosis is pathognomonic for severe or established osteoporosis. These kinds of pathological fractures, occurring without adequate trauma, are also called vertebral fragility fractures. Vertebral compression fractures in the thoracic or lumbar spine are a common clinical problem, particularly in elderly patients, despite the fact that about 60% of vertebral fractures occur without symptoms. Osteoporosis is the most common cause of compressionfracturesinthisagegroup, butupto39%of all bone metastases occur in the spine and such metastases may also result in a pathological fracture.
Differentiation from benign compression fractures due to osteoporosis often complicates the appropriate clinical staging and treatment planning in patients with known nonosseous malignancies in this age group.
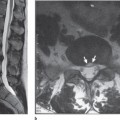
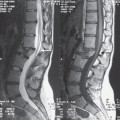
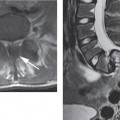
In these patients, contrast-enhanced magnetic resonance imaging (MRI) can help to distinguish benign from malignant vertebral fractures. Basically, chronic benign compression fractures can be diagnosed by the absence of abnormal signal intensity in a compressed vertebral body. Problems could arise if an acute osteoporotic compression fracture has to be differentiated from a malignant compression fracture.
MR imaging findings, such as abnormal signal intensity of the pedicle or posterior element, an epidural or paraspinal mass, and a convex posterior border of the vertebral body, are useful for differentiation of metastatic from acute osteoporotic compression fractures of the spine.
Multiple compression fractures, retropulsion of a posterior bone fragment, a low-signal-intensity band on T1W and T2W images, and spared normal bone marrow signal intensity of the vertebral body are suggestive of acute osteoporotic compression fractures (see Chapter 15).10–18
Epidemiology and Outcome of Osteoporotic Spinal Fractures
Osteoporosis strikes mostly older women and is therefore an increasing problem for the Western world’s aging population. In Europe, one in four women will be over 60 by 2010, and 1% of women aged 65 will suffer a spinal fracture each year. For men aged 65, at least one in 200 will suffer a spinal fracture within a year. By the age of 80, 40% of women and 20% of men can be expected to have suffered an osteoporotic spine fracture that causes chronic pain.19
After lumbar vertebral fractures, the mean number of bed days has been reported to be 25.8 and limited activity days, 158.5. Also, fractures of the thoracic vertebrae result in a substantial amount of illness and disability.3
The Radiologist’s Role in Diagnosis
Screening during Routine Chest Radiography
Radiographic findings suggestive of osteopenia and osteoporosis are frequently encountered in daily radiological practice. It has been reported that, in most cases, spinal osteopenia becomes detectable on conventional radiographs only after a loss of at least 20-40% of the skeletal calcium.21,22 The visual estimation of bone quality may, therefore, be inadequate for the quantification of osteopenia, but remains useful for detecting clinically important asymptomatic vertebral fractures that indicate a high risk for successive fractures.
At any rate, osteoporosis is still underdiagnosed and therefore undertreated; however, routine chest radiography still holdspotential as a screening tool for revealing previously undiagnosed vertebral fractures.23 Osteoporosis patients with one osteoporotic fracture anywhere in the body are predisposed to a 20% higher risk of developing an additional fracture, a risk that is on a par with the WHO criteria for the definition of fracture risk in osteopenia. To make the most of the screening potential of routine chest radiography, relevant vertebral fractures, defined as at least moderate to severe (loss of height of approximately 25% or greater) should be cited in chest reports. Especially in patients over 60 years old, in whom the prevalence of such fractures approaches 25%, routine chest radiographs could be used to screen patients for osteoporosis-related vertebral fractures. Unfortunately, compression fractures are very often not mentioned in radiology reports. It was reported recently that only 55 % of vertebral fractures are mentioned in official radiology reports. Perhaps fully automated digital morphometry of the thoracic spine will increase the sensitivity of this screening method in routine clinical practice in the near future.
Diagnosis of Osteoporosis on Lateral Radiographs of the Spine
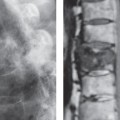
Since the majority of vertebral fractures do not come to clinical attention, radiographic diagnosis is considered to be the best way to identify and confirm the presence of osteoporotic vertebral fractures in clinical practice. Conventional lateral radiographs of the spine are visually evaluated by radiologists to identify vertebral fractures. The severity of such fractures should be assessed semiquantitatively, based on visual evaluation, or quantitatively, using different morphometric criteria. Surprisingly, there is still debate about what defines a vertebral fracture or what might be considered an anatomical variation on lateral spine radiographs since there are no good prospective studies of variations in vertebral morphology. Nevertheless, the identification of vertebral fractures is very important because the risk of suffering a subsequent fracture is 20% higher than with no history of fractures. The radiologist is thus in a strong position to guide theclinicianinevaluatingfracturerisk.24,25 Osteopenia and osteoporosis of the spine lead to increased radiolucency of the vertebrae, which may assume the radiographic density of the intervertebral disk space, or a vertical striation, and a “framed” appearance of the vertebrae, as well as increased (bi-) concavity of the vertebral endplates. These characteristics are summarized in the Saville index (Table 14.2).26 Despite its significant relation to measured bone density, this index never gained widespread acceptance because it was prone to subjectivity and reader experience.22,27
Even though osteopenia may not be diagnosed reliably from spinal radiographs, osteoporosis-induced changes of the shape of vertebral bodies, as endplate impressions or crush fractures, are clearly visible in lateral views. These fractures should be described semiquantitatively as published by Genant et al:28 the severity of a spinal fracture from T4 to L4 is solely assessed by visual determination of the extent of vertebral height reduction and morphological change, and vertebral fractures are differentiated from other nonfracture deformities. Vertebral heights are graded without direct measurements as normal, mildly deformed, moderately deformed, and severely deformed (Table 14.3).
In the near future, digital morphometry could increase the percentage of quantitatively reported thoracic and lumbar spine fractures. There is still a major role for radiologists in the careful assessment and diagnosis of vertebral fractures using standardized grading schemes such as the one described earlier.28
| Grade | Radiographic appearance of vertebral bodies |
| 0 | Normal bone density. |
| 1 | Minimal loss of density: endplates begin to stand out, giving a stencilled effect. |