Mitral Regurgitation
TRANSESOPHAGEAL ECHOCARDIOGRAPHY (TEE) HAS BECOME a standard of care in the cardiac operating room, allowing the anesthesiologist to play an important part in the surgical decision-making process. In that role, few areas are as challenging as the assessment of intraoperative mitral regurgitation (MR). Yet few applications of intraoperative TEE have as much impact on the course of surgery and on patient outcome as the evaluation of MR.
ANATOMY
The mitral valve is bicuspid and consists of a large anterior leaflet and a smaller posterior leaflet (Fig. 8.1). The anterior leaflet covers about two-thirds of the surface area of the valve. The posterior leaflet is C-shaped and wraps around the anterior leaflet accounting for about two-thirds of the circumference of the valve. The leaflets join at the anterolateral and posteromedial commissures. The posterior leaflet is further divided anatomically into three scallops, whereas the anterior leaflet does not have scallops per se. It is important to keep in mind when considering the various TEE imaging planes of the mitral valve that coaptation of the two leaflets forms a semicircular, not linear, path. The valve is encircled by a dynamic fibromuscular ring, the mitral annulus. It is saddle shaped and plays an important role in proper valve closure by reducing its diameter in systole. In various disease states the mitral annulus dilates and tends to flatten, causing increased stress on the mitral leaflets and impairs its function (1). The mitral valve attaches to two papillary muscles, anterolateral and posteromedial, through chordae tendineae. Each papillary muscle sends off chordae tendineae to both mitral leaflets. In systole, the papillary muscles contract to keep the chordae tendineae taut and prevent prolapse of the leaflets into the left atrium (2).
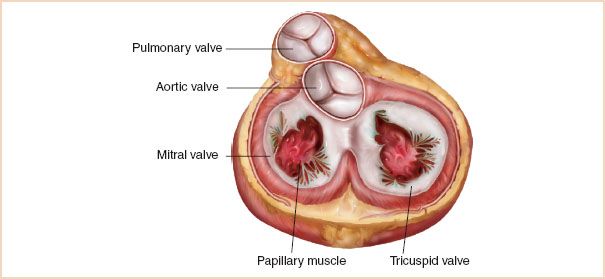
FIGURE 8.1 Anatomy of the mitral valve.
The blood supply to the papillary muscles is variable, but in the majority of patients, the anterolateral papillary muscle receives blood supply from branches of two major coronary arteries, the left anterior descending (LAD) and the left circumflex (LCx), while the posteromedial papillary muscle receives blood supply from a single coronary artery, the right coronary artery (RCA). This is important clinically, because the incidence of posterolateral papillary muscle infarction is much higher than that of anterolateral papillary muscle infarction.
There are three types of chordae tendineae. First-order (or primary) chordae attach to the edge of the leaflets, second-order (or secondary) chordae attach to the body of the leaflets, and third-order (or tertiary) chordae attach to the base of the posterior leaflet. The anterior leaflet of the mitral valve shares the same fibrous attachment as the aortic valve, an area sometimes referred to as the fibrous body or crux of the heart. This relationship is important to consider and surgery to one valve can result in impaired function of the other.
NOMENCLATURE
There exist three nomenclatures of the mitral valve in the literature. The classic anatomic nomenclature refers to the three scallops of the posterior leaflet of the mitral valve as anterolateral, middle, and posteromedial, according to their anatomic location (3). The anterolateral scallop is the closest to the left atrial (LA) appendage. No specific description is given to any part of the anterior leaflet. The most commonly used nomenclature amongst echocardiographers is attributed to Carpentier (4) and defines the three scallops of the posterior leaflet as P1, P2, and P3, where P1 is closest to the LA appendage. It also defines three corresponding areas of the anterior leaflet as A1 (opposite P1), A2 (opposite P2), and A3 (opposite P3). This nomenclature was adopted by the American Society of Echocardiography Council for Intraoperative Echocardiography and the Society of Cardiovascular Anesthesiologists Task Force for Certification in Perioperative Transesophageal Echocardiography, in their published “Guidelines for performing a comprehensive intraoperative multiplane transesophageal echocardiography examination” (5).
A third nomenclature, often called the Duran nomenclature (6), describes the mitral valve segments according to their attachment to the papillary muscles. It refers to the three scallops of the posterior leaflet as P1, PM (middle), and P2, where P1 is closest to the LA appendage. The PM scallop is further subdivided into PM1 laterally and PM2 medially. Duran divides the anterior leaflet into two areas, A1 and A2, opposite the corresponding scallops of the posterior leaflet. The two commissural areas of the valve are defined as C1 (between A1 and P1) and C2 (between A2 and P2). The rationale for this nomenclature is that every part of the mitral valve attached to the anterolateral papillary muscle is given the number one and every part of the mitral valve attached to the posteromedial papillary muscle is given the number two. A schematic representation of the three nomenclatures of the mitral valve is shown in Figure 8.2 (7).
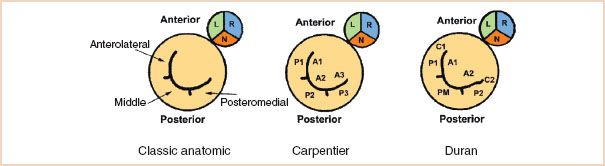
FIGURE 8.2 Schematic representation of the various nomenclatures of the mitral valve. The mitral valve is shown with its relationship to the aortic valve, viewed from the left atrium. See text for details. (Adapted from Lambert AS, Miller JP, Merrick SH, et al. Improved evaluation of the location and mechanism of mitral valve regurgitation with a systematic transesophageal echocardiography examination. Anesth Analg. 1999;88:1205–1212, with permission.)
Each institution or group of practitioners favors one nomenclature over another and it does not matter which one is used, as long as every member of the team agrees on which terminology is used. The reader is encouraged to have a basic understanding of all of them to avoid confusion. For example, P2 refers to a different area of the valve in the Carpentier and Duran nomenclatures.
ETIOLOGY AND MECHANISM OF MITRAL REGURGITATION
MR can be classified according to its etiology (Table 8.1), or more simply, according to the pathophysiologic mechanism leading to the regurgitation. Carpentier proposed the now widely used classification of MR based on leaflet motion (8,9) (Fig. 8.3).
• In type 1 lesions, the leaflet motion is normal. In such cases, the MR jet tends to be central or slightly off-center. Type 1 MR is usually the result of annular dilatation Fig. 8.3A, but less common mechanisms include mitral valve clefts, aneurysms, perforation, or destruction, as a result of endocarditis Fig. 8.3B.
• In type 2 lesions, there is excessive mitral leaflet motion and the MR jet is typically directed away from the diseased leaflet. The spectrum of severity of excessive leaflet motion is illustrated in Figure 8.4. Billowing (or scalloping) refers to a situation where part of a mitral leaflet projects above the annulus in systole, but the coaptation point remains below the plane of the mitral annulus. Prolapse is used to describe the excursion of a leaflet tip above the level of the mitral annulus during systole, causing regurgitation. The term flail is reserved for a situation where a leaflet edge is flowing freely into the left atrium in systole, as a result of one or more ruptured chordae tendineae. The distinction between severe prolapse and flail is sometimes difficult to make because the ruptured chordae may not be visible by echocardiogram. It is also somewhat academic, as the hemodynamic consequences and the surgical treatment of the two are often the same Fig. 8.3C, D.
• Type 3 lesions refer to restricted leaflet motion and are further subdivided into type 3a and 3b. In type 3a, the restriction is “structural” (most often rheumatic) and the leaflet motion is affected in both systole and diastole Fig. 8.3E. In type 3b, the restriction is “functional” and proper coaptation is prevented by systolic tethering of the mitral leaflets as a result of a dilated left ventricle (LV) and/or displaced papillary muscles Fig. 8.3F. Coronary artery disease is often the etiology of type 3b MR and is referred to as ischemic MR. In type 3b, leaflet motion is normal in diastole. Usually in type 3 lesions, the regurgitant jet may be directed towards the diseased leaflet if only one leaflet is affected, but the jet may also be central if both mitral leaflets are equally affected by the disease process. This is often the case in type 3b abnormalities because each papillary muscle supports both leaflets. Structural restriction of leaflet motion commonly coexists with some degree of mitral stenosis. An ischemic (i.e., stiff) papillary muscle may also temporarily restrict leaflet motion, causing failure of coaptation.
TABLE 8.1 Causes of Mitral Regurgitation

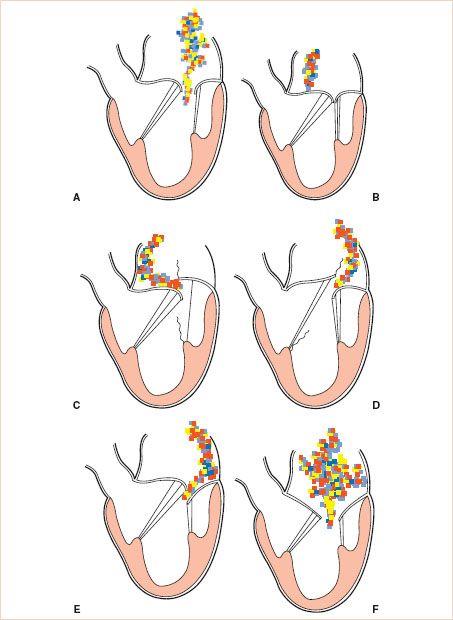
FIGURE 8.3 Carpentier′s classification of mitral regurgitation (MR) based on leaflet motion. In type 1, the leaflet motion is normal and the MR jet tends to be central (A,B). In type 2, there is excessive leaflet motion and the MR jet is typically directed away from the diseased leaflet (C,D). In type 3 lesions, the leaflet motion is restricted and is further subdivided into type 3a (structural) (E) and type 3b (functional) (F). In type 3 lesions, the regurgitant jet may be directed towards the diseased leaflet if only one leaflet is affected, or it may be central if both mitral leaflets are equally affected. (Courtesy Dr. Gregory M. Hirsch.)
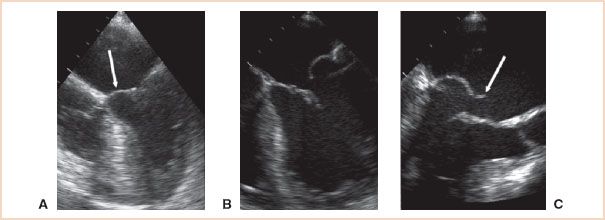
FIGURE 8.4 Excessive leaflet motion. A: Billowing (or scalloping) refers to a situation where part of a mitral leaflet (arrow) projects above the plane of the annulus in systole, but the coaptation point remains below the mitral annulus. B: Prolapse is used to describe the excursion of a leaflet tip above the level of the mitral annulus during systole, causing regurgitation. C: The term flail is reserved for a situation where a leaflet edge (arrow) is flowing freely into the left atrium in systole.
APPROACH TO THE TRANSESOPHAGEAL ECHOCARDIOGRAPHY EVALUATION OF MITRAL REGURGITATION
In the setting of mitral valve surgery, the intraoperative TEE evaluation of MR requires one to answer three basic questions: (a) How severe is the MR? (b) What is the mechanism of the MR and where on the mitral valve is the lesion? (c) Can the valve be surgically repaired?
How Severe is the Mitral Regurgitation?
The severity of MR is classified as trivial, mild, moderate, or severe. This corresponds to 1+, 2+, 3+, and 4+ by angiography. The basic two-dimensional (2D) examination (see Chapter 2 on basic examination) of the heart often provides clues that significant MR may be present. Such clues may be direct, like a large coaptation defect or a structural anomaly of a leaflet, or indirect indicators such as the hemodynamic sequelae of severe MR, like volume overload of the left ventricle and left atrium, or signs of pulmonary hypertension (dilated and hypertrophied right ventricle, septal flattening, dilated pulmonary arteries). A detailed 2D examination of the mitral valve is extremely valuable for precise localization of lesions and is discussed in the following text.
Color Doppler remains the easiest and best method to screen for MR because of its high sensitivity and specificity. It also provides a semi-quantitative assessment of the severity of MR. The general appearance (size and depth of penetration) of the regurgitant jet offers a rough index of the severity of regurgitation, but that appearance is highly dependent on machine settings as well as pressures in the receiving chamber and may lead to confusion. The “experienced eyeball method” tends to work only in mild or severe cases. The ratio of the regurgitant jet area (RJA) over the total left atrial area (LAA) has been reported to correlate better with the severity of MR on cardiac catheterization in almost 94% of a group of 82 patients (10). An RJA/LAA greater than 40% was found in patients with severe MR on cardiac catheterization. However, there are also important limitations to this sign (11–13) and the severity of MR should not be determined only by the size of the Doppler jet.
The narrowest portion of the jet, known as the vena contracta, can be measured and diameters of 5.5 mm or more correlate with severe MR on cardiac catheterization (14) (Fig. 8.5). The use of 7 mm as the cutoff point for severe MR is useful as it provides more specificity but not surprisingly at the cost of decreased sensitivity (15). Note that, in order to be relevant, this measurement should be taken in the midesophageal long-axis (ME-LAX) view.
The direction of the MR jet is also important, not only as a clue to its etiology, but also as a sign of its severity. While central jets may be functional in nature (i.e., they may result from annular dilatation or ventricular dysfunction), eccentric jets (Fig. 8.6, Video 8.1) are almost always due to a structural abnormality of the mitral apparatus itself and they are unlikely to improve after revascularization. Furthermore, wall-hugging jets always warrant a close examination: First, jets that have enough energy to “hug the wall” of the atrium for some distance should be considered hemodynamically significant until proven otherwise (16). Second, wall-hugging jets are subjected to the “Coanda effect.” This is a physical principle by which a fluid jet will get “sucked” against the wall, making it appear smaller by color Doppler than it actually is. Consequently, a wall-hugging jet should be considered severe until proven otherwise.
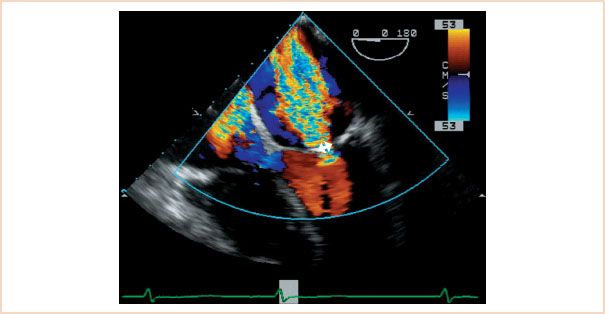
FIGURE 8.5 Measurement of the vena contracta. This is a color Doppler scan of the mitral valve in the midesophageal four-chamber view. The diameter of the base of the mitral regurgitation (MR) jet correlates with the severity of regurgitation.
As mentioned in the preceding text, it is important to remember that any quantitative assessment made by color Doppler is highly dependent on the settings of the echo machine (aliasing velocity, pulse repetition frequency, frame rate, etc.). This is further discussed in the chapter on color Doppler.
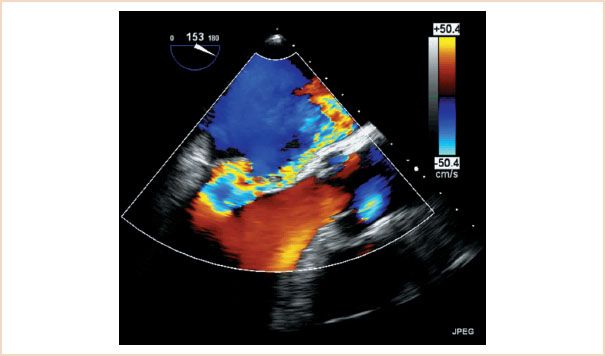
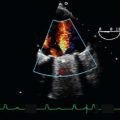
FIGURE 8.6 Eccentric mitral regurgitation (MR) jet. This is a color Doppler scan of the mitral valve in the midesophageal four-chamber view. Note the severe MR jet which “hugs” the medial wall of the left atrium. Wall-hugging jets should be considered severe until proven otherwise.
Spectral Doppler adds to the semi-quantitative assessment of the valve. While the peak velocity of the regurgitant jet is mostly a function of the systolic gradient between the LV and the LA, the density of the MR signal by continuous wave (CW) Doppler is proportional to the number of blood cells detected by the Doppler beam (see Chapter 5 on Doppler). A dense MR jet with a sharp envelope on CW Doppler suggests that a large fraction of the left ventricular (LV) output is going backward into the left atrium. Conversely, a weaker signal with an incomplete envelope suggests a smaller regurgitant fraction (RF).
The evaluation of pulmonary venous flow by pulsed wave (PW) Doppler is also very important and should be a routine part of any assessment of MR. The normal PW Doppler pattern of pulmonary venous flow is forward in systole and in diastole. Significant regurgitation of the LV stroke volume in systole causes blunting or reversal of the systolic component of pulmonary vein flow and this sign is a reliable indicator of hemodynamically significant MR (Fig. 8.7) (17). However, it is important to remember that although pulmonary venous flow reversal is specific, it is not a particularly sensitive method to detect MR. The absence of systolic pulmonary venous flow blunting or reversal does not rule out severe MR, especially in chronic cases where a large and compliant left atrium may dissipate the energy from the regurgitant jet. Table 8.2 summarizes the Doppler parameters typically found in mild, moderate, and severe MR.
Finally, it is important to remember that none of the signs described in the preceding text are enough by themselves to make a diagnosis of severe MR, but taken as a group, they provide much better diagnostic accuracy. Zoghbi et al. (15) provide an excellent review on the use of multiple techniques for assessing MR severity.
More precise quantitative assessments of MR require the use of mathematical calculations, which are described in a later section of this chapter.
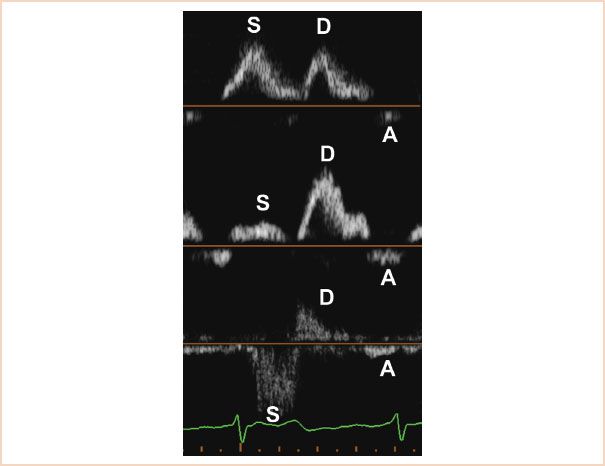
FIGURE 8.7 Pulsed wave Doppler of the pulmonary vein flow. The top panel shows the normal pattern, forward in systole and diastole. The middle panel shows blunting of the systolic flow, associated with increasing degrees of mitral regurgitation. The bottom panel shows the typical pattern of systolic reversal seen in severe MR. Note the nonlaminar aspect of the flow in the reversed S wave, caused by severe MR.
TABLE 8.2 Doppler and Quantitative Values Typically Found in Mild, Moderate, and Severe Mitral Regurgitation
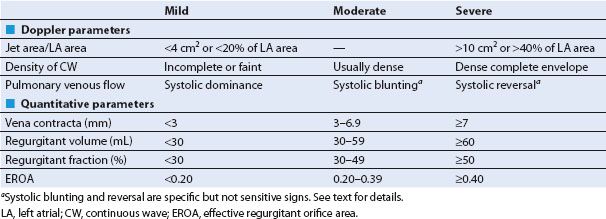
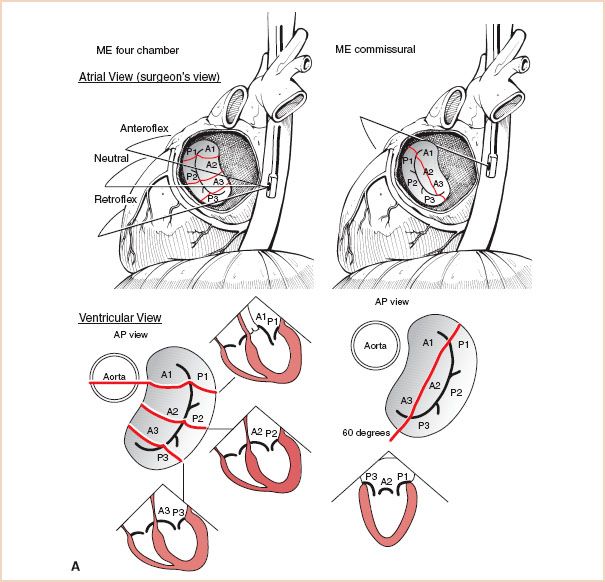
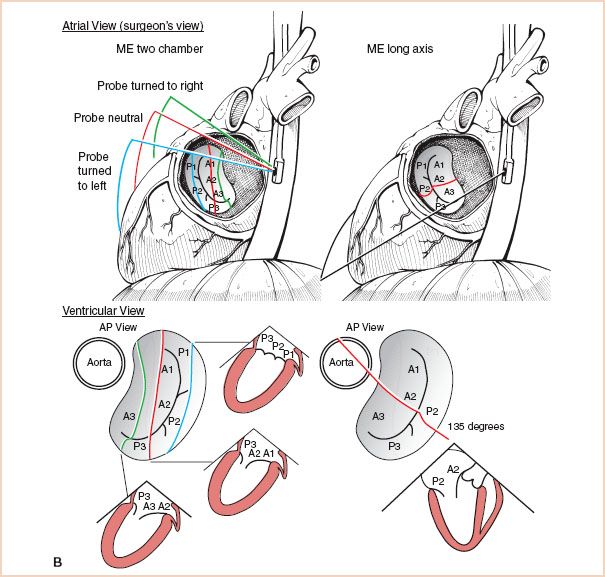
FIGURE 8.8 A: Sequential examination of the mitral valve from midesophageal windows, Midesophageal Four-Chamber and Commissural views: The top of the figure displays the mitral valve from the atrial side, which is similar to direct intraoperative visualization. The bottom of the figure displays the valve from the ventricular side, which corresponds more closely to the TEE cross-sections. B: Sequential examination of the mitral valve from midesophageal windows, Long Axis Views: Again, the valve is depicted from the atrial side at the top, which is similar to direct intraoperative visualization, and from the ventricular side at the bottom, which corresponds more closely to the TEE cross-sections. ME = midesophageal; AP = anteroposterior.
What is the Mechanism of Mitral Regurgitation and Where on the Mitral Valve is the Lesion?
Systematic Two-dimensional Examination of the Mitral Valve
Once it has been established that there is significant MR, the next step is to determine the mechanism of the MR and the precise location of the lesion, so that an appropriate surgical plan can be formulated. The various mechanisms of MR were discussed in the preceding text. The precise localization of lesions involves a systematic 2D echo examination of the mitral valve.
The systematic examination of the mitral valve combines techniques described in several publications (5,7,18) and aims at obtaining multiple redundant views of all parts of the valve and to identify each mitral segment using internal, recognizable cardiac landmarks. Accordingly, the sequence described in the following text and illustrated in Figure 8.8 is recommended:
1. Begin the examination in the midesophageal (ME) four-chamber view at 0 degrees of transducer rotation, with the mitral valve in the center of the screen. The anterior mitral leaflet is medial, adjacent to the aortic valve and the posterior leaflet is lateral. Slight withdrawal (18) or anteflexion (7) of the probe brings the left ventricular outflow tract (LVOT) into the plane of the scan, which demonstrates the anterior segments of the valve (A1/A2, P1/P2). Conversely, with slight insertion (18) or retroflexion (7) of the probe, the LVOT disappears from the scanning plane, allowing the examination of the posterior segments of the valve (A2/A3, P2/P3). The entire mitral valve can therefore be seen at 0 degrees of transducer rotation, by gently anteflexing or retroflexing the probe. A note of caution: Because of anatomic variations, this author does not believe that the average echocardiographer can consistently discriminate between P1 and P2, or between P2 and P3 using only 0-degree views.
2. Obtain a ME mitral commissural view by rotating the imaging array to obtain the best possible cut through the commissures. This is usually achieved between 60 and 90 degrees (5). This cross section typically demonstrates P1 laterally, P3 medially, and variable amounts of anterior leaflet in the middle. The apparent double orifice stems from the semicircular coaptation between the leaflets of the mitral valve. The presence and severity of disease at the level of the commissures can be evaluated here.
3. Next, the ME two-chamber view is obtained by rotating the transducer forward to approximately 80 to 100 degrees. In addition, by turning the shaft of the probe leftward and rightward, three reproducible cross sections can be obtained, allowing further identification of the valve segments (7,18).
4. Then, the ME long-axis view is obtained by rotating the transducer to approximately 130 to 150 degrees. This provides a cut through the center of each mitral valve leaflet, which allows reliable identification of A2 and P2 (5). As this view cuts across the saddle-shaped annular plane at its most superior aspect, it is a preferred view for assessing mitral valve prolapse because it avoids the false positives which occur using the ME four-chamber view.
5. Finally, the probe is advanced into the stomach and the TG basal short-axis view of the mitral valve is obtained (5,7) (Fig. 2.18). This cross section is useful to diagnose clefts and perforations and color Doppler provides additional information on the origin of the regurgitant jet(s).
Technically, it is extremely important to remember that the classic imaging planes described in the preceding text are obtained only when the echo scan crosses through the center of the mitral valve. Indeed, turning of the probe shaft from the ME commissural or ME long-axis views will provide a lot of additional three-dimensional (3D) information from transitional images, but it may be misleading to the novice eye. For example, gently turning the probe to the right in the commissural view will reveal more of the anterior leaflet, showing not only A2 but also extending toward A1 and A3. Turning the probe to the left will reveal more of P2, not only P1 and P3 on either side as expected. Likewise in the long-axis view, a well-centered scan usually demonstrates A2 and P2, but slight rotation of the probe to the right will move the scan toward A3/P3 and slight rotation to the left will move the scan toward A1/P1. In addition, 3D echocardiography has revealed that these relationships do not always hold true, especially when there is rotation or distortion of the heart by chronic disease.
The whole detailed examination can be done very quickly when one becomes familiar with it. The recommended sequence of views mentioned in the preceding text provides sufficient redundancy in the segment identification that in the author’s experience results in high accuracy and consistent reliability. Whatever the sequence of views, the examination should be consistent and systematic. As in other aspects of echocardiography, repetition is important and by learning to recognize the variants of normal and the wide spectrum of pathologies are better appreciated.
QUANTITATIVE EVALUATION OF THE MITRAL VALVE
Regurgitant volume (RV), regurgitant fraction (RF), and regurgitant orifice area (ROA) can be calculated using the continuity principle. For a detailed discussion of this principle, please see Chapter 6 on hemodynamic assessment.
• RV is the difference between the amount of blood that enters the left ventricle in diastole and the amount of blood that exits through the aortic valve in systole. It is typically obtained by calculating the stroke volume across the LVOT (VTILVOT × AreaLVOT) and subtracting it from the forward stroke volume which crosses the mitral valve in diastole (VTIMV × AreaMV). An alternative site such as the pulmonary artery can also be used. Calculation of RV is limited by the fact that the mitral valve opening is oval, not round, and its surface area changes throughout diastole. One can also use the proximal isovelocity surface area (PISA) method to calculate the RV, as described in the following text.
• The RF (the percentage of LV blood that flows backward into the left atrium in systole) is the ratio of the RV over the volume that flows forward across the mitral valve in diastole (i.e., the total stroke volume).
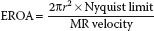
• Calculation of the effective regurgitant orifice area (EROA) is achieved by the PISA method, which can also be used in the evaluation of mitral stenosis and it is described in detail in Chapter 9. PISA was popular some years ago (19), but because of numerous limitations associated with the technique, it is falling out of fashion. In brief, PISA takes advantage of the flow dynamics of blood as it is forced into the regurgitant orifice. Approaching the orifice, the blood cells accelerate along a series of concentric hemispheres which can be visualized by color Doppler. At the aliasing velocity (Nyquist limit) the color turns from red to blue (Fig. 8.9). This point provides both the velocity and the radius of the hemisphere. By knowing the velocity and radius of the hemisphere, one can calculate the volumetric flow at that radius (= area × velocity = 2πr2 × Nyquist limit). Then one measures the peak velocity of the MR jet by CW Doppler to calculate the EROA.
The PISA method is based on a number of assumptions, which create important limitations (20): First it assumes that the orifice is round, which may not be the case. Also, this method’s estimation of cross-sectional area as 2πr2 assumes that the PISA “shells” are true hemispheres, not cones or flattened shells. Utsunomiya et al. (21) established that PISA shells are closest to being true hemispheres when their radius is approximately 11 to 15 mm. The Nyquist limit and the color baseline should be adjusted accordingly to minimize error. Also, for eccentric jets, an angle correction must be used, as described in Chapter 9 on mitral stenosis.
Finally, when certain clinical conditions are met, a simplified PISA formula can be used. Indeed, when the Nyquist limit is set at 40 cm/s and the gradient across the MR jet is 100 mm Hg, the whole formula simplifies down to:

Note that if the r2 value is greater than 1, it is reasonable to assume that the MR is severe.
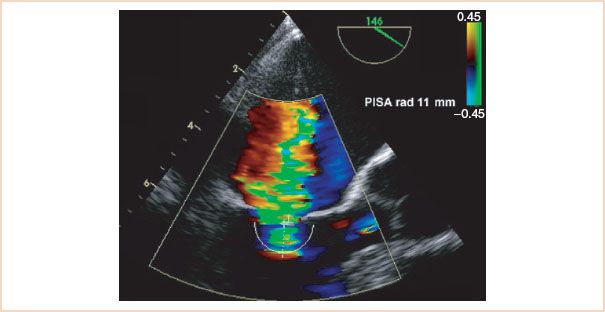
FIGURE 8.9 Estimated regurgitant orifice area by the proximal isovelocity surface area (PISA) method. The radius of the hemisphere where the cells reach the aliasing velocity is measured and used in the PISA equation.
Related posts:
Stay updated, free articles. Join our Telegram channel

Full access? Get Clinical Tree


