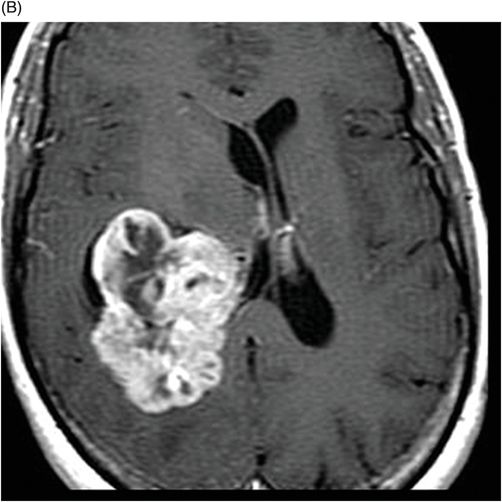
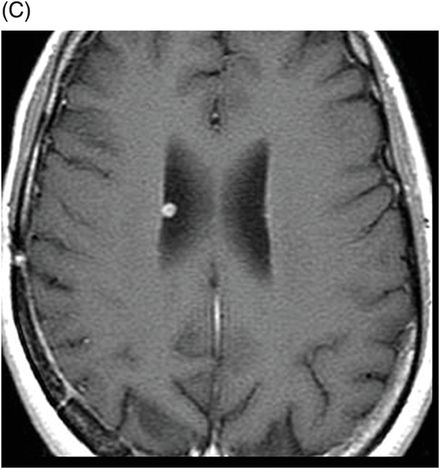
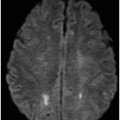
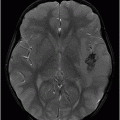
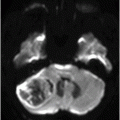
(A) Axial MPGR-T2* and (B) Axial DWI and (C) ADC images through the level of the atrium of the lateral ventricle.
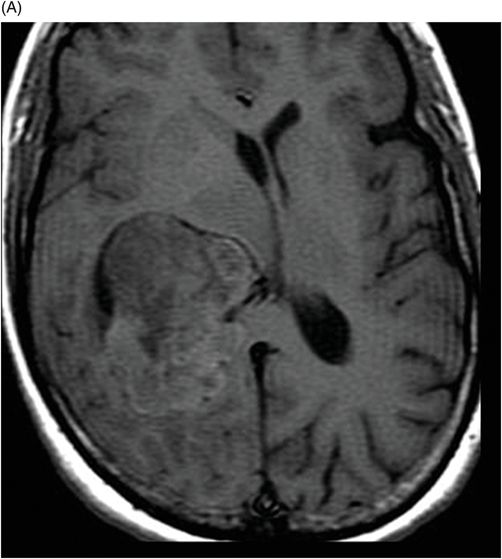
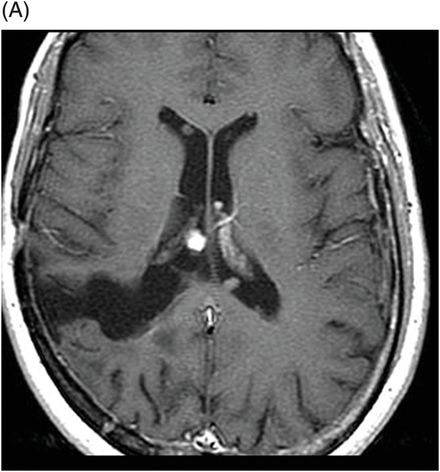
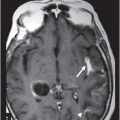
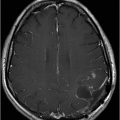
(A) Axial non-contrast T1-weighted and (B) Axial contrast-enhanced T1-weighted images through the level of the atrium of the lateral ventricle.
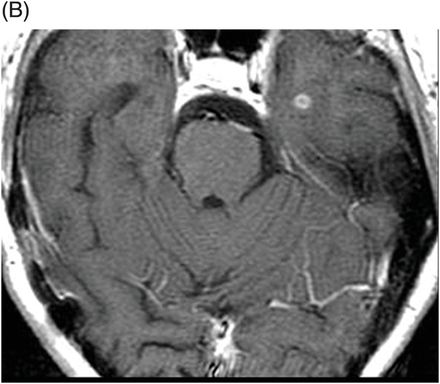
(A–C) Axial contrast-enhanced T1-weighted images through the level of the lateral ventricles.
Intraventricular Hemangiopericytoma/Solitary Fibrous Tumor
Primary Diagnosis
Intraventricular hemangiopericytoma/solitary fibrous tumor
Differential Diagnoses
Meningioma
Choroid plexus metastasis
Choroid plexus carcinoma
Imaging Findings
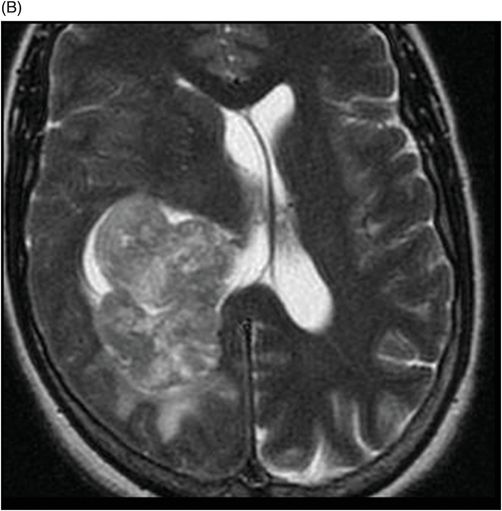
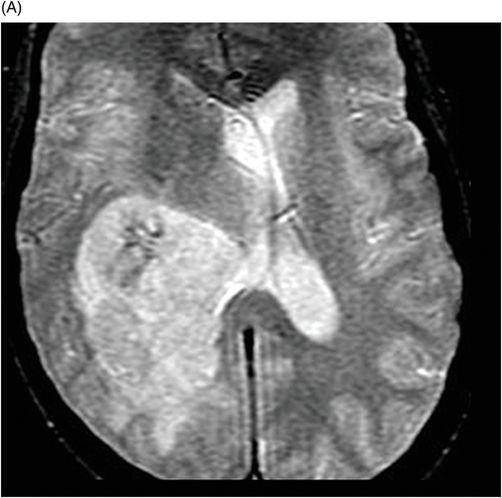
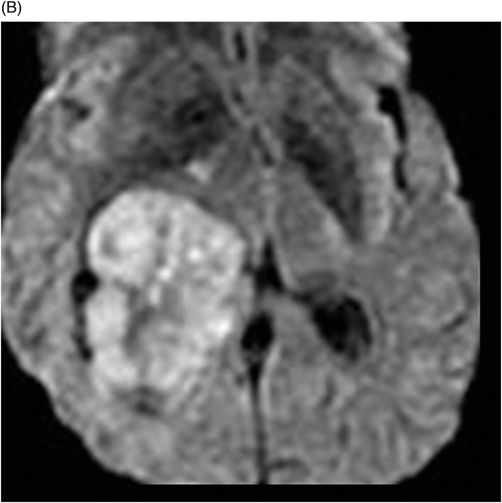
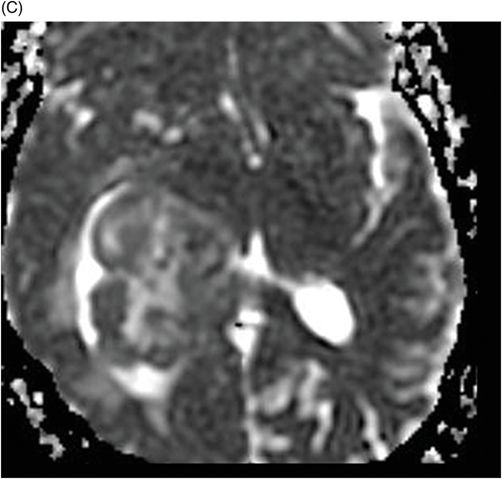
Fig. 108.1 (A) Sagittal T1 non-contrast and (B) Axial T2 images showed a bulky, intraventricular, lobulated mass with dilatation of the temporal horn of the lateral ventricle and midline shift, surrounded by vasogenic edema in the adjacent brain parenchyma. Fig. 108.2 (A) Axial MPGR-T2* MR images showed small foci of hypointensities within the lesion that could be due to hemorrhage or calcification. (B) Axial DWI and (C) ADC images showed restricted diffusion at the periphery of the mass and a central area of facilitated diffusion. Fig. 108.3 (A) Axial non-contrast T1-weighted MR image again showed heterogeneous signal intensity in the lesion. (B) Axial contrast-enhanced T1-weighted MR image showed marked heterogeneous contrast enhancement of the mass with non-enhancement central area, suggestive of necrosis. Fig. 108.4 (A–C) Axial contrast-enhanced T1-weighted MR images, three years after total surgical resection of the mass, demonstrated multiple nodular intraventricular enhancing lesions, compatible with recurrence of the primary diagnosis.
Stay updated, free articles. Join our Telegram channel

Full access? Get Clinical Tree


