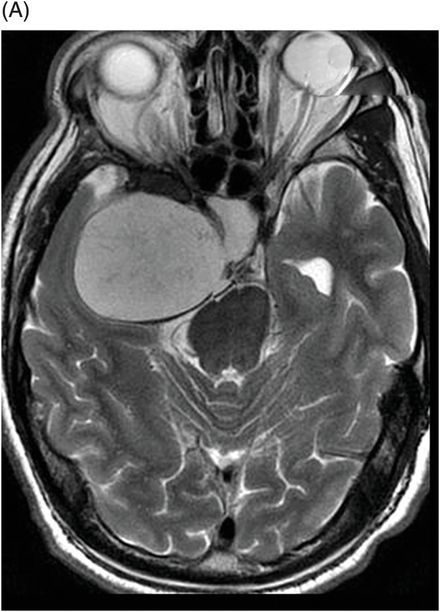
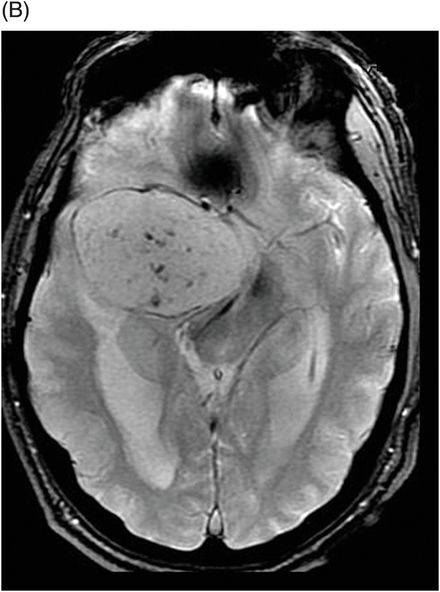
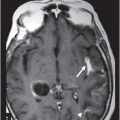
(A) Axial T2WI and (B) MPGR-T2* through the temporal lobes.
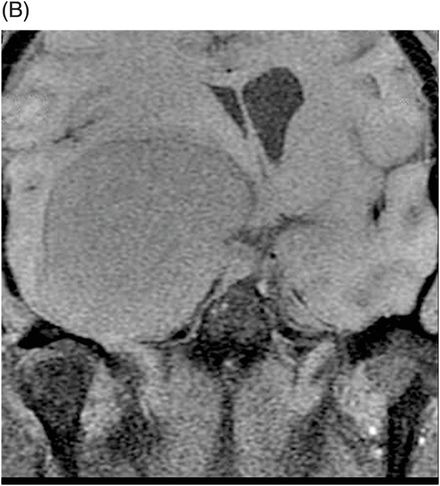
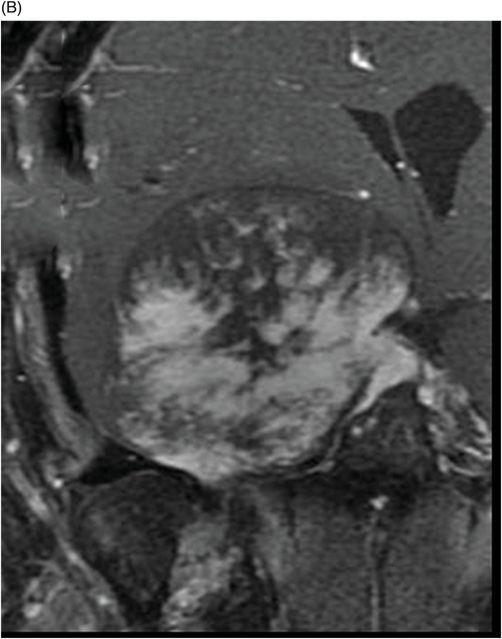
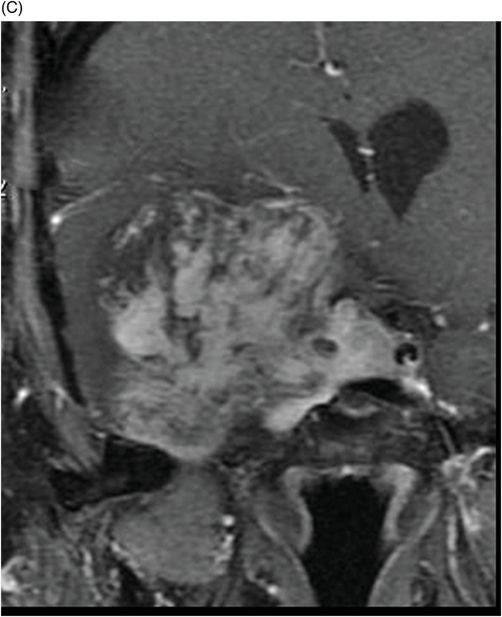
(A–C) Coronal T1 postcontrast dynamic images through the level of the right temporal lobe.
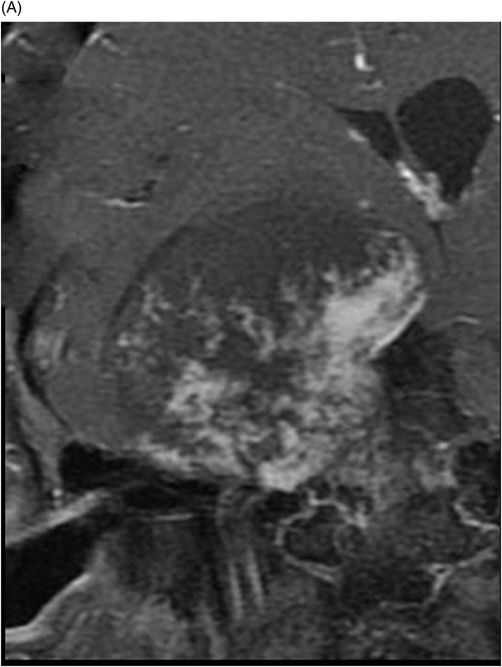
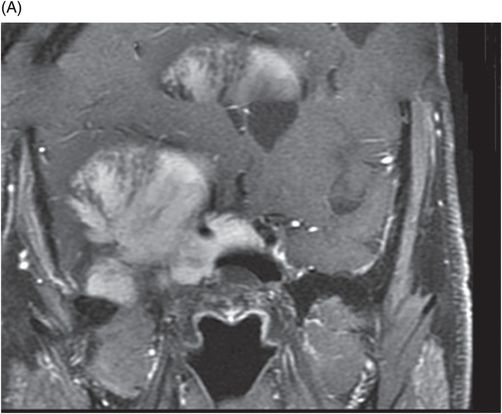
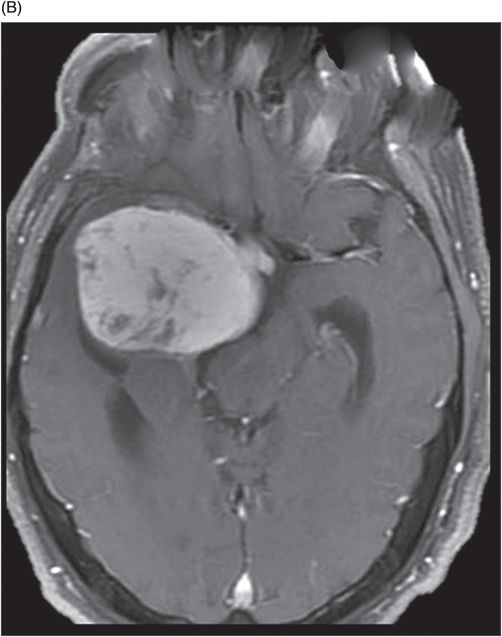
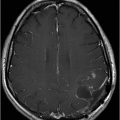
(A) Coronal and (B) Axial delayed T1WI postcontrast through the temporal lobes (after Figs. 112.1–112.3).
Sagittal further delayed T1WI postcontrast (after Figs. 112.1–112.4) through the right temporal lobe.
Cavernous Sinus Hemangioma
Primary Diagnosis
Cavernous sinus hemangioma
Differential Diagnoses
Schwannoma
Meningioma
Chordoma
Chondrosarcoma
Imaging Findings
Fig. 112.1 (A) Sagittal and (B) Coronal T1WI demonstrated a large mass involving the right parasellar region, exhibiting T1WI hypointense signal. Fig. 112.2 (A) Axial T2WI demonstrated marked hyperintensity. (B) T2* sequence demonstrated multiple prominent flow voids. The mass dislocates the right internal carotid artery medially and anteriorly. Fig. 112.3 (A–C) Coronal dynamic contrast-enhanced images demonstrated progressive filling-in enhancement. Fig. 112.4 (A) Coronal and (B) Axial delayed T1WI (obtained after Figs. 112.1–112.3) demonstrated greater enhancement. Fig. 112.5 Sagittal further delayed T1-weighted image (obtained after Figs. 112.1–112.4) revealed nearly homogeneous enhancement.
Stay updated, free articles. Join our Telegram channel

Full access? Get Clinical Tree


