A Practical Approach to the Echocardiographic Evaluation of Ventricular Diastolic Function
IN COMPARISON TO SYSTOLE, THE diastolic phase of the cardiac cycle has only recently acquired appropriate recognition as an important, independent component of overall cardiac performance. Diastole is no longer perceived simply as a passive stage of ventricular filling interposed between each contraction. Adequate ventricular filling is actually dependent upon a complex interaction between ventricular relaxation, compliance, and systolic function, in addition to an important late diastolic contribution from atrial contraction.
Following the advent of cardiac catheterization in the 1960s, quantification of ventricular mechanics and ventricular diastolic properties accelerated with the introduction of pulse wave Doppler echocardiography (PWD) in the early 1980s. The relative feasibility, safety, and practicality of echocardiography has helped to delineate diastolic dysfunction over the last several decades, as a major pathophysiologic component of several cardiac disorders including acute and chronic congestive heart failure (CHF) (1). In addition, Doppler echocardiographic modalities have been used to predict functional class and prognosis (2). Recent echocardiographic studies have also suggested that diastolic dysfunction may contribute to perioperative hemodynamic instability and adverse outcomes following cardiac surgery (3). This chapter presents a practical approach to understanding the importance and utility of traditional and newer echocardiographic modalities in assessing ventricular filling and diastolic dysfunction.
BASICS OF DIASTOLIC PHYSIOLOGY
The diastolic phase of the cardiac cycle is defined as the period from aortic valve (AV) closure to mitral valve (MV) closure (Fig. 7.1). Diastole can be further divided into an initial isovolumic relaxation period, followed by early rapid left ventricular (LV) inflow responsible for 80% to 90% of diastolic filling, diastasis, and finally, atrial systole (4). LV filling during diastole is dependent on a complex interaction of numerous factors including ventricular relaxation, diastolic suction, viscoelastic forces of the myocardium, pericardial restraint, ventricular interaction, MV dynamics, load heterogeneity, intrathoracic pressure, heart rate/rhythm, and atrial function (5).
Diastolic dysfunction is often defined clinically as an impaired capacity of the ventricles to fill at low pressure and usually involves an abnormality in ventricular relaxation and/or chamber compliance. LV relaxation is associated with re-sequestration of calcium from the cytosol to the sarcoplasmic reticulum, via a complex energy-dependent process that is required to deactivate the contractile elements and subsequently allow the myofibrils return to their original, precontraction length (6). Ventricular relaxation is classically evaluated with high-fidelity, manometer-tipped catheters that measure the rate and duration of the LV pressure decrease after systolic contraction during isovolumic relaxation (Fig. 7.2A) (7). The time constant of relaxation (τ) is a clinically and experimentally acceptable technique for assessing isovolumic relaxation, although limitations have been described (6). LV chamber compliance is dependent upon the passive properties of the ventricle, and is determined from the exponential relationship between the change in volume and the change in pressure during diastolic filling (dV/dP) (Fig. 7.2B) (7).
The LA contribution to LV end-diastolic volume (LVEDV) can also be an important determinant of filling. The LA serves not only as a blood reservoir and passive conduit, but also as an active pump during contraction at end-diastole. The LA contribution to LV diastolic filling is usually <20% in young healthy patients, yet may approach 50% in patients with decreased LV filling associated with early diastolic dysfunction.
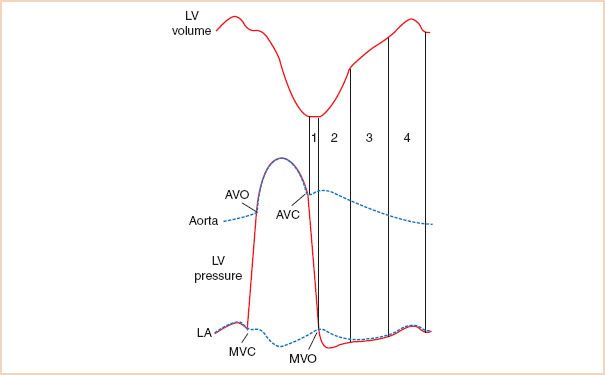
FIGURE 7.1 Diastolic phase of the cardiac cycle. During isovolumic relaxation (1), left ventricular (LV) pressure falls rapidly following aortic valve closure (AVC). When LV pressure decreases below left atrial (LA) pressure, the mitral valve opens (MVO) initiating early, rapid LV filling (2). Equilibration of LV and LA pressures results in diminished transmitral flow during diastasis (3) until atrial contraction (4) which normally contributes <20% of the total LV end-diastolic volume. Diastole terminates with MV closure (MVC) prior to isovolumic contraction and the AV opening (AVO) which permits LV ejection. (Reproduced with permission from Plotnick GD. Changes in diastolic function—Difficult to measure, harder to interpret. Am Heart J. 1989;118:637–641.)
ECHOCARDIOGRAPHIC EVALUATION OF LEFT VENTRICULAR DIASTOLIC FUNCTION
Conventional, direct assessment of diastolic function requires invasive measurements (high-fidelity, intraventricular, micromanometer catheters) or sophisticated technology (three-dimensional sonomicrometry, cardiac magnetic resonance imaging, ultrafast computed tomography) (6). Pulmonary artery catheterization can be useful for assessing global cardiac performance; however, evaluation of diastolic function is limited by the inability to directly measure LV pressure, volume, or transmitral flow. In contrast, echocardiography provides a relatively safe, practical, and noninvasive means to evaluate diastolic function.
Two-dimensional and M-mode Echocardiography
Indirect evidence of diastolic function can be obtained during a comprehensive two-dimensional (2D) echocardiographic examination by assessing LV ejection fraction and LVEDV. Echocardiographic evidence of LV hypertrophy without dilatation and with normal systolic function indicates the presence of diastolic heart failure (DHF) in a symptomatic patient. LA enlargement (>4 cm) is often associated with elevated LV filling pressures (8).
Doppler Echocardiographic Evaluation of LV Filling: Transmitral Inflow
The utilization of Doppler echocardiography to measure transmitral blood flow (TMDF) velocities provides valuable information toward the assessment of diastolic function. The PWD recording of TMDF velocities is obtained by placing the sample volume at the MV leaflet tips (Fig. 7.3). A typical TMDF velocity profile has a biphasic pattern. An initial peak flow velocity (E-wave) occurs during early diastolic filling and a later peak flow velocity (A-wave) occurs during atrial systole. Blood flow during the interposed period of diastasis is usually minimal, since little LV filling occurs during this phase. Several indices of diastolic function have been derived from the TMDF profile and correlated with more classic measures of diastolic function including angiography, radionucleotide techniques, and direct measures of intraventricular pressures (Table 7.1) (6,9).
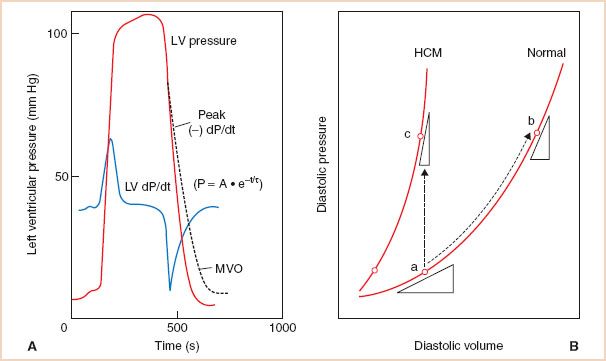
FIGURE 7.2 A: Left ventricular (LV) relaxation can be invasively evaluated by measuring the minimum value of the first derivative of ventricular pressure with respect to time (−dp/dtmin) or preferably, by calculating the time constant (τ) of isovolumic LV pressure decline according to the equation shown. An increase in τ (dashed line) generally indicates impaired LV relaxation (myocardial ischemia, hypertrophic heart disease, negative inotropes) which can be associated with decreased LV filling and diminished cardiac performance. P, LV pressure; A, LV pressure at −dp/dtmin; t, time after −dp/dtmin; e, natural logarithm; MVO, mitral valve opening. B: LV pressure–volume (P–V) relationships. LV compliance (dV/dP) is described by the tangent drawn to the P–V curve at a particular point. A decrease in LV compliance results in an increase in LV filling pressure depicted as either a shift of the pressure–volume (P–V) curve upward and to the left when myocardial stiffness increases (point a–c), or to a steeper portion of the curve when volume increases (point a–b). (Reproduced with permission from Zile M, Smith V. Relaxation and diastolic properties of the heart. In: Fozzard H, Haber E, Jennings R, Katz A, Morgan H, eds. The Heart and Cardiovascular System: Scientific Foundations, 2nd ed. New York, NY: Raven; 1991:1353–1367.)
TMDF velocities are determined by the transmitral pressure gradient (TMPG) which is dependent upon several variables including heart rate and rhythm, early filling loads, atrial contractility, MV disease, ventricular septal interactions, the intrinsic LV lusitropic state, and ventricular compliance (10). With normal aging, delayed LV relaxation at any given LV pressure, creates a lower initial TMPG, which results in proportionally less early filling (lower peak E-wave velocity) and a greater, compensatory late filling (higher peak A-wave velocity) accounting for 35% to 40% of LV diastolic inflow. Conversely, more efficient LV relaxation and elastic recoil observed in young adults is associated with predominant early LV filling corresponding with a greater initial TMPG, and a smaller contribution (10% to 15%) from atrial contraction. Alternatively, TMPG elevation in patients with decreased LV compliance is primarily due to a progressively increasing LA pressure (LAP). Thus alterations in LV relaxation and compliance along with consequential changes in LAP alter the TMPG and resulting TMDF profiles. The isovolumic relaxation time (IVRT, the time from cessation of systolic ventricular outflow to the onset LV inflow) is also affected by alterations of diastolic function. A shortened IVRT (<60 milliseconds) indicates premature MV opening and can be observed in patients with elevated LAP. Delayed MV opening (IVRT > 110 milliseconds) occurs with impaired LV relaxation. The deceleration time (DT, the interval from the peak E-wave velocity to the zero baseline) generally reflects the mean LAP and LV compliance (11). A relatively short DT (<140 milliseconds) can be seen in patients with reduced LV compliance, whereas a prolonged DT is associated with poor LV relaxation.
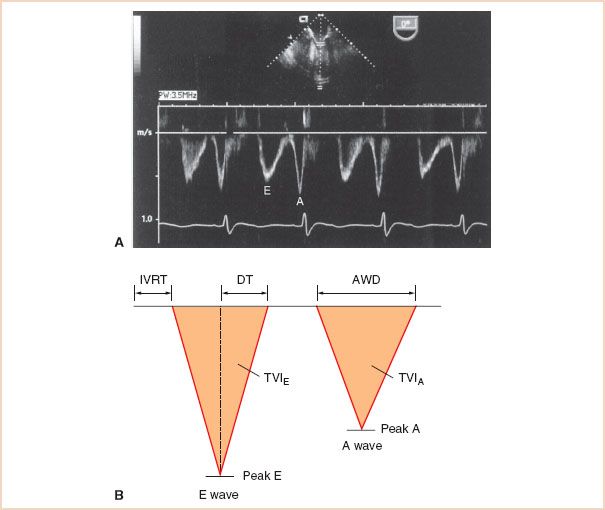
FIGURE 7.3 A: Transmitral Doppler flow velocity (TMDF) profile using transesophageal echocardiography. The TMDF profile is obtained by placing a pulse wave Doppler sample volume (1 to 2 mm) at the tips of the mitral valve (MV). The initial rapid phase of early left ventricular (LV) filling (E) is followed by a variable period of minimal flow (diastasis) and finally late diastolic filling during atrial contraction (A). B: Schematic of TMDF profile depicting relevant indices of diastolic function. Several indices of LV diastolic function can be obtained from the TMDF profile including the E- and A-wave peak velocities and ratio, the E- and A-wave time velocity integrals (TVI, area under each Doppler envelope) and corresponding E/A TVI ratio, the A-wave duration (AWD), the E-wave deceleration time (DT, the time interval from the peak E-wave velocity to the zero baseline), and the isovolumic relaxation time (IVRT, the time from cessation of systolic ventricular outflow to the onset of transmitral LV inflow).
Changes in LV relaxation and compliance contribute to the spectrum of Doppler LV filling patterns that are observed with progressive diastolic dysfunction. The initial abnormality of diastolic filling in most disorders of cardiac physiology is impaired myocardial relaxation exceeding that expected with aging alone. Impaired LV relaxation occurs with myocardial ischemia/infarction, LV hypertrophy, hypertrophic cardiomyopathy, and in the early stages of infiltrative disorders (12). The TMDF profile associated with impaired relaxation is typically characterized by a prolonged IVRT and a decreased initial TMPG (Fig. 7.4) (13). Consequently, the peak E-wave velocity decreases relative to the peak A-wave velocity when LV relaxation is impaired (E/A < 1), since the MV tends to open before relaxation is complete. In addition, the duration of LV relaxation is prolonged resulting in a prolonged DT (5) since the LA–LV pressure gradient takes longer to equilibrate. There is a subsequent, compensatory flow increase during atrial contraction accounting for the increased peak A-wave velocity, time velocity integral (TVI), and duration due to the relatively high atrial preload. Thus, the TMDF velocity profile with impaired relaxation is characterized by “E/A reversal” (decreased peak E-wave velocity and increased peak A-wave velocity), prolonged IVRT, and prolonged DT.
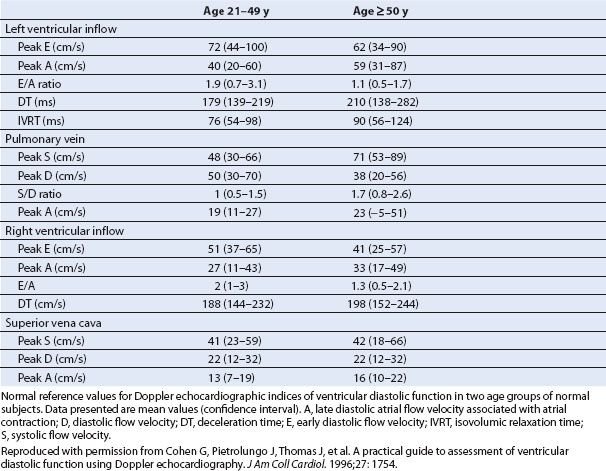
TABLE 7.1 Left and Right Ventricular Doppler Echocardiographic Indices of Diastolic Function Filling Dynamics in Normal Subjects
Diastolic dysfunction associated with markedly decreased LV compliance and severely increased LAP is often described as a “restrictive” LV filling disorder (12). The TMDF profile associated with a restrictive pattern of LV diastolic dysfunction is characterized by an elevated peak E-wave velocity relative to the A-wave velocity due to the elevated LAP (Fig. 7.4) (13). Even though impaired relaxation co-exists with decreased compliance when diastolic dysfunction has progressed, the consequential increase in LV end-diastolic pressure (LVEDP) results in a markedly elevated LAP and an elevated peak E-wave velocity, consistent with very rapid filling during early diastole. The IVRT is shortened as the MV opens prematurely due to the elevated LAP. The DT is also abnormally short, as early transmitral flow into the poorly compliant LV results in rapid equilibration of LA and LV pressures that may even be associated with diastolic mitral regurgitation (MR) (12). Finally, the peak A-wave velocity and duration tend to be compromised by poor atrial contractility and the rapid increase in LV pressure, which can prematurely terminate late mitral inflow. Thus, a restrictive TMDF velocity profile is characterized by an elevated peak E-wave velocity and decreased peak A-wave velocity (E/A ratio > 2) along with a shortened IVRT and DT.
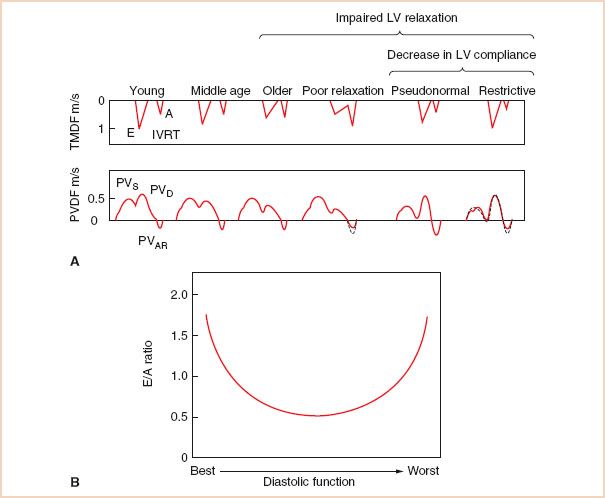
FIGURE 7.4 A: The impact of progressive left ventricular (LV) diastolic dysfunction on transmitral (TMDF) and pulmonary venous Doppler flow (PVDF) velocity profiles. Note that all pulsed Doppler indices of the TMDF and PVDF profiles present a parabolic distribution over the progression from normal to advanced diastolic dysfunction. The transmitral pressure gradient is initially elevated in normal, young individuals due to vigorous LV relaxation and elastic recoil, before diminishing when relaxation becomes impaired, and finally increasing again when left atrial pressure increases due to an elevated LV end-diastolic pressure in the restrictive pattern of LV diastolic dysfunction. Respective changes are noted in the PV profile. E, E-wave; A, A-wave; IVRT, LV isovolumic relaxation time; PVAR, late diastolic retrograde velocity; PVS1, first systolic component; PVS2, second systolic component; PVD, diastolic component. (Modified with permission from Appleton C, Hatle L. The natural history of left ventricular filling abnormalities: assessment by two-dimensional and Doppler echocardiography. Echocardiography. 1992;9:437–457.) B: Parabolic distribution of transmitral E/A velocity ratios associated with progressive diastolic dysfunction.
Typically there is a progression of diastolic dysfunction from impaired relaxation to restrictive pathophysiology. During this transition, the TMDF profile may assume a pseudonormalized pattern that resembles normal LV filling (Fig. 7.4A) (13). The pseudonormalized filling pattern represents a moderate stage of diastolic dysfunction where a “normal” early TMPG is generated by the balance between compromised LV relaxation and gradually increasing filling pressures as LV compliance decreases. Consequently, for varying degrees of diastolic dysfunction, the spectrum of E/A velocity ratios assumes a parabolic shape beginning with a vigorous LV relaxation pattern seen in young, athletic individuals and terminating with a similar appearing restrictive pattern consistent with severe diastolic dysfunction (Fig. 7.4B). The intermediate, pseudonormalized stage of diastolic dysfunction is therefore characterized by normal values for peak E-wave and A-wave velocities, IVRT, and DT. Reducing preload by utilizing reverse Trendelenburg positioning, partial cardiopulmonary bypass (CPB), a Valsalva maneuver (14), or by administering nitroglycerin may also reveal underlying impaired LV relaxation in a patient with pseudonormalized transmitral inflow (15). Normal individuals usually respond to preload reduction with a more proportional decrease in both E- and A-wave velocities (12). Preload reduction may also be useful in grading the severity of diastolic dysfunction (15). For example, a restrictive pattern is considered “irreversible, end-stage” if it does not pseudonormalize in response to preload reduction (4).
Doppler Echocardiographic Evaluation of LA Filling: Pulmonary Venous Flow
The evaluation of LA filling can provide important insight into the assessment of LV diastolic function especially when combined with data obtained from the TMDF. A typical pulmonary venous Doppler flow (PVDF) profile consists of an antegrade systolic velocity which may appear monophasic, or biphasic especially in the presence of low LAP probably owing to temporal dissociation of atrial relaxation and mitral annular motion (Fig. 7.5) (16). The first systolic component, PVS1, is dependent upon LA relaxation and the subsequent decrease in pressure. The later peaking PVS2, reflects right ventricular (RV) stroke volume, LA compliance, the effects of early ventricular systole on LAP and any concomitant MR. An additional, large antegrade velocity occurs during diastole (PVD) following early transmitral inflow while the LA serves as an open conduit between the PV and the LV. The late diastolic retrograde velocity, also known as pulmonary venous atrial flow reversal (PVAR), occurs during LA systole and is dependent upon LA contractility, heart rate, and compliance of the LA, PV, and LV (10).
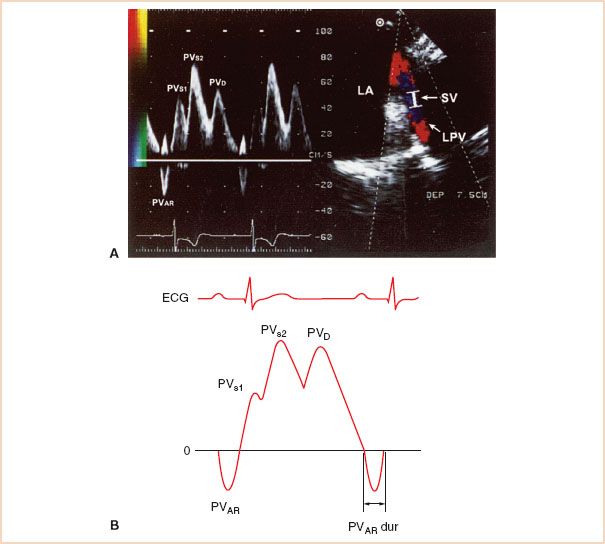
FIGURE 7.5 A: Pulmonary venous Doppler flow velocity (PVDF) profile. LA filling can be assessed by placing a PWD sample volume (2 to 4 mm.) approximately 1 cm into a pulmonary vein (PV) orifice where it joins the left atrium (LA). B: Schematic of PVDF profile depicting relevant indices of diastolic function. Indices of left ventricular (LV) diastolic function obtained from the PVDF include the peak S/D velocity ratio, as well as the peak A-wave reversal velocity and duration. LAA, left atrial appendage; LUPV, left upper pulmonary vein; PVAR, late diastolic retrograde velocity; PVAR dur, PVAR–wave duration; PVS1, first systolic component; PVS2, second systolic component; PVD, diastolic component; SV, sample volume; LPV, left pulmonary vein.
Normally, the PV systolic peak amplitude and TVI are equal to or slightly greater than the corresponding PVD values (Table 7.1) (9). A reduced systolic fraction (systolic TVI divided by the sum of systolic and diastolic TVI) less than 40% has been correlated with increased mean LAP (17). In addition, the normal PVAR (≈90 to 115 milliseconds) duration is the same or less than the transmitral A-wave duration (≈120 to 140 milliseconds) (11). In general, LA contraction should result in a greater net forward blood volume and flow toward a normal, compliant LV compared with any retrograde flow back toward the PV. A PVAR velocity that exceeds the mitral A-wave by >35 cm/s or PVAR duration >30 milliseconds longer than the transmitral A-wave duration usually indicates an age-independent elevation in LVEDP (18).
The analysis of PVDF compliments the assessment of TMDF in the evaluation of various stages of diastolic dysfunction (Fig. 7.4). The PVDF profile consistent with impaired LV relaxation is characterized by a reduced PVD velocity that parallels the mitral E-wave velocity, and a compensatory increase in the PVS velocity, resulting in a pattern of systolic predominance. Conversely, the systolic antegrade velocity is reduced when LV filling is restrictive, because of the elevated LAP and decreased LV compliance resulting in a pattern of systolic blunting. A greater proportion of antegrade flow occurs during diastole, although the PVD DT is usually shortened analogous to the rapid deceleration of the transmitral E-wave velocity. The PVAR velocity and duration may be prolonged in the presence of restrictive pathophysiology due to decreased LV compliance and associated increase in LAP, which can promote retrograde flow. Alternatively, the PVAR velocity may be diminished in patients with severe, irreversible restrictive filling, due to atrial mechanical failure (19). The pseudonormalized PV Doppler flow velocity profile is often characterized by a pattern of relative systolic blunting and a prolonged PVAR duration and velocity compared with the transmitral A-wave duration depending upon the LAP and degree of reduced LV compliance (Fig. 7.4). In this scenario, the PVDF pattern may be helpful in distinguishing a pseudonormal from normal TMDF profile. However, in normal young adults and athletes who do not rely on a significant LA contribution for LV filling, the LA behaves more like a “passive conduit,” and PVS blunting may be commonly observed (19).
Influence of Physiologic Variables on LA and LV Doppler Flow Profiles
The TMDF and PVDF profiles are considered useful for evaluating LV diastolic function in both nonsurgical and surgical patient populations. The utility of these echocardiographic parameters throughout the perioperative period is limited, however, by the unavoidable effects of changes in preload, afterload, heart rate, and rhythm on peak velocities and proportions of early and late filling (20). Increases in preload will often be associated with a more proportionate increase in the transmitral peak E-wave velocity, a shortened IVRT, and steeper DT. The opposite changes will occur with decreases in preload. MR may produce a transmitral Doppler flow velocity profile with an increased E-wave velocity due to the elevated LAP and increased volume flow rate across the MV. Isolated LV systolic dysfunction may be also be associated with an increased transmitral peak E-wave velocity and reduced A-wave since diastolic filling occurs at a steeper portion of the LV pressure–volume curve (21). Finally, the location of the PWD sample volume and respiratory pattern can also affect the TMDF profile (22).
Tachycardia causes fusion of the transmitral E- and A-wave velocities and a pseudo-increase in the A-wave velocity and duration especially if the E- at A-wave velocity is greater than 20 cm/s (10). Dysrhythmias and pacing may also be associated with unique alterations in the TMDF and PVDF profiles. For example, atrial flutter may present with “flutter waves” in the TMDF profile. In patients with atrial fibrillation (AF), the transmitral and PVAR-waves are absent and the E-wave peak velocity and DT vary with the length of the cardiac cycle. AF may also be associated with a loss of PVS1, and a decreased PVS2 relative to the dominant PVD (23). Peak acceleration rate of the E-wave velocity (24), transmitral E-wave DT shortening, and the duration and initial deceleration slope time of PVD may still correlate with increased LV filling pressure in the presence of AF (23).
Newer Echocardiographic Techniques for Assessing LV Diastolic Function: Mitral Annular Doppler Tissue Imaging and Color M-mode Transmitral Propagation Velocity
Mitral Annular Motion Assessed with Doppler Tissue Imaging
Recently, newer echocardiographic techniques for assessing LV diastolic function have been described that reportedly are less vulnerable to the effects of acute changes in loading conditions. Mitral annular motion is evaluated with Doppler tissue imaging (DTI), a technique which utilizes a low velocity, high amplitude signal to eliminate high velocities associated with blood flow, and provides a signal with high temporal and velocity range resolution (25). Initial studies describing the utilization of DTI to evaluate mitral annular motion used transthoracic echocardiography and a four- or two-chamber apical acoustic window. A midesophageal four-chamber view obtained with a TEE probe is also an appropriate window to position a PWD sample volume (2.5 to 5 mm) on the lateral corner of the mitral annulus (Fig. 7.6). Alternatively, the septal side of the mitral annulus can be evaluated although the tissue velocities tend to be lower and blood flow velocities in the LV outflow tract may obscure the tissue Doppler profile (26). The PWD Doppler beam should be aligned as parallel as possible to the longitudinal axial motion of the LV. It is important to realize that these recorded velocities not only represent the rate of myocardial fiber shortening and lengthening of a specifically selected segment at the level of the mitral annulus, but are also influenced by velocities associated with translation and rotation of cardiac structures (27). The lowest wall filter and minimal optimal gain should be used to eliminate blood flow velocity signals produced by transmitral flow. Finally the Nyquist limit, sweep speed, and size of the Doppler profile should be adjusted for optimal visualization.
The mitral annular DTI profile has a systolic component, which has been shown to correlate with ejection fraction (26), and a biphasic diastolic component that appears as an exact mirror image of the TMDF profile except that the tissue velocities are much lower in magnitude (8 to 15 cm/s). The initial, early diastolic tissue velocity (E′) begins simultaneously with mitral inflow, yet its peak precedes the peak transmitral E-wave velocity and ends before LV inflow termination (28). In the absence of gross geometric distortion and severe regional wall motion abnormalities, E′ reflects tissue velocities associated with changes in LV volume and is primarily influenced by the rate of myocardial relaxation and elastic recoil. In the normal patient, the peak E′ velocity is greater than the later diastolic tissue velocity (A′), which tends to reflect LA systolic function (29).
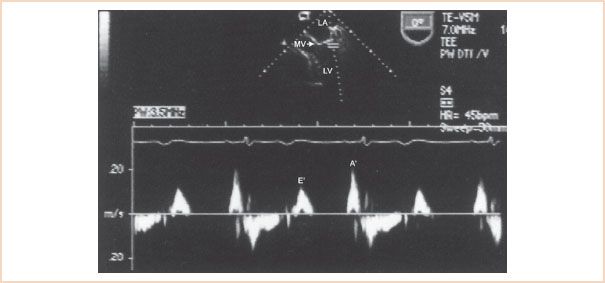
FIGURE 7.6 Mitral annular motion assessed with Doppler tissue imaging (DTI). The PWD sample volume is positioned at the level of the lateral mitral valve (MV) annulus to obtain the DTI profile. The mitral annular DTI profile has a biphasic diastolic component that includes an initial early (E′) and a later (A′) diastolic tissue velocity. LA, left atrium; LV, left ventricle.
Related posts:
Stay updated, free articles. Join our Telegram channel

Full access? Get Clinical Tree


