A Walk Through the Spatial Frequency Domain
Objectives
At the completion of this chapter, the student should be able to do the following:
Key Terms
The spatial frequency domain is crucial to magnetic resonance imaging (MRI) because all but the very earliest methods of MRI (such as the sensitive point method) scan the spatial frequency information about the image, not the image plane itself.
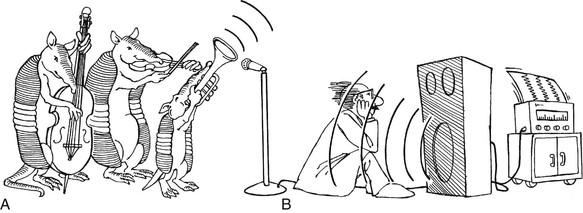
A useful analogy is the human auditory system. When a microphone is attached to a strip chart recorder and is used to listen to a musical ensemble, the result is a tracing of sound intensity as a function of time; the microphone simply responds to changes in air pressure at its sensor.
When a member of the audience hears the same performance, the individual instruments of the ensemble are perceived as they play in concert (Figure 13-1). This is because the human auditory system converts the variations of loudness observed by the microphone into a temporal frequency representation from which the brain extracts higher-level information about the instrumentation.
In MRI, the imaging system measures the information about the image slice differently than the human visual system would if the slice were directly visible. A method of analyzing the spatial frequency components and converting them into spatial location information is needed to reconstruct the image. The usual method is the Fourier transform (FT).
The purpose of this chapter is to extend the introduction to spatial frequency in the preceding chapter and to discuss the FT. Chapter 14 demonstrates how the MRI system actually measures spatial frequencies.
Spatial Frequency
The term spatial frequency domain comes from the field of electrical engineering. The term k-space comes from physics. They refer to the same thing. Either is correct and both are in common use. The former is far more descriptive; however, k-space is firmly entrenched in MRI and therefore is used here to emphasize the subject under discussion.
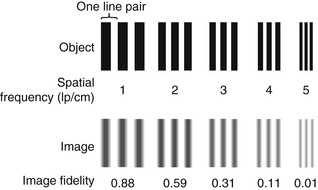
Consider a series of high-contrast bar patterns to be imaged (Figure 13-2). One bar and its equal width interspace are called a line pair.
The number of line pairs per unit length is the spatial frequency, and for MRI systems it is expressed in line pair per centimeter (lp/cm). A low spatial frequency represents large objects, and a high spatial frequency represents small objects.
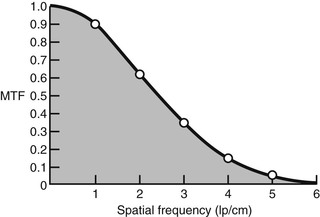
The image obtained from the low-frequency bar pattern more faithfully reproduces the object than that of the high spatial frequency bar pattern. The less faithful reproduction with increasing spatial frequency describes the limitation of spatial resolution of an imaging system and is indicated graphically as a modulation transfer function (MTF).
A graph of the ratio of image-to-object at the spatial frequencies in Figure 13-2 results in the MTF curve of Figure 13-3. For MRI, the MTF is obtained from the FT of an edge or impulse. The 10% MTF value is usually stated as the limiting spatial resolution of an MRI system, and that value depends on matrix size and field of view (FOV). Limiting spatial resolution is approximately 10 lp/cm for head/body images and 20 lp/cm for surface coil imaging.
A spatial frequency is a number of cycles in space or per unit distance. Cycles of what? The answer is a bit tricky. In the previous chapter, the complex nature of the magnetic resonance (MR) image was not emphasized, but now it is very important.
A complex number is one that has two dimensions, such as north-south and east-west or azimuth and range. The two dimensions are called the real part and the imaginary part. These names are unfortunate; there is nothing more or less tangible about one part than the other, at least in the MRI context. This is simply a mathematical convenience.
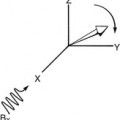
Complex numbers are important in MRI. For example, as the net magnetization vector precesses in the XY plane, it takes two numbers to specify where it points at any given time. One number gives the X coordinate and the other number gives the Y coordinate. Thus if the X-axis value is assigned to the real part of a complex number and the Y-axis value to the imaginary part of a complex number, the position of the net magnetization vector can be represented by a single complex number.
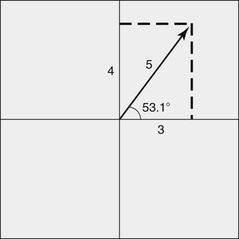
Two coordinate systems are commonly taught in geometry. One is the Cartesian coordinate system, in which a point in a plane is represented by its X and Y coordinates. The other system is polar coordinates, in which a point is represented by its distance from the origin and the angle that the line connecting it to the origin makes with the X-axis (Figure 13-4). Polar coordinates fit MRI naturally.
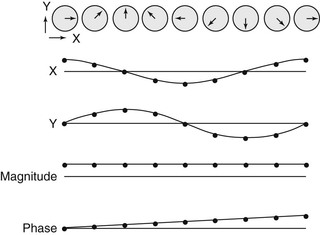
When the net magnetization vector precesses in the XY plane, its length is essentially constant when compared with its rotation (change in angular orientation) in the XY plane. If polar coordinates are used to describe the position of the net magnetization vector in the XY plane, the length of the vector is constant but the angle changes as the vector precesses. Temporal frequency is measured in cycles per second (hertz [Hz]). One cycle equals 360°.
It is important to be clear about whether you are talking about frequency or angular frequency. Angular frequency has units of radians per second (360° = 2π radians = 6.28 radians). Often the gyromagnetic ratio, γ, is expressed in radians and calculations involving it can be off by a factor of six if you are not careful.
It is relatively easy to imagine the net magnetization vector rotating as a function of time as it precesses. If the net magnetization vectors positioned along the patient have different angles, that represents a spatial frequency (Figure 13-5).
Any object can be viewed as a weighted sum of spatial frequencies. There are mathematical conditions under which this statement is not true, but any patient who met those conditions would have an acute need for treatment far in excess of an MRI.
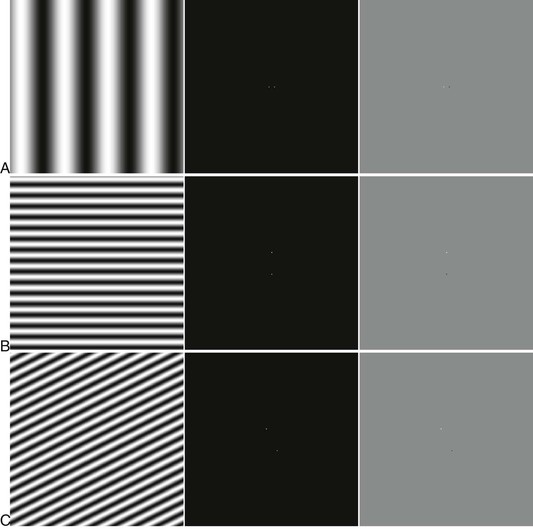
A few examples of real and imaginary FT pairs are shown in Figure 13-6. Notice the similarity between these images and Figures 8-10 through 8-13. The important thing to notice about these examples is that if the spatial frequencies in an object can be measured, the object can be described. In a formal sense, that is usually done by the FT.
During imaging, each MR signal is Fourier transformed to fill a single line of k-space (Figure 13-7). High-amplitude phase-encoding gradients fill the periphery of k-space and contribute to spatial resolution. Low-amplitude phase-encoding gradients fill the center of k-space and contribute to contrast resolution.
Stay updated, free articles. Join our Telegram channel

Full access? Get Clinical Tree


