Adult Brain Tumors
Bruno Telles
Francesco D’Amore
Mahesh V. Jayaraman
Jerrold L. Boxerman
Meng Law
Mark S. Shiroishi
Alexander Lerner
Primary brain tumors are uncommon. They account for less than 2% of all malignant neoplasms (1) in adults, with a similar prevalence reported in the United States (2) compared to other parts of the world (3). In absolute numbers, there is an incidence of 6.4/100,000 (men and women) per year. About 0.6% of the population will be diagnosed with brain or other nervous system neoplasm at some point in their lifetime, based on 2009–2011 data (4). In 2014, the estimated number of deaths caused by these tumors (brain and other nervous system neoplasms) in the United States number 143,204. Despite the relative rarity of these lesions, the challenge they present is uniquely problematic. In distinction from most forms of cancer, the overall death rate from malignant brain tumors has not significantly declined over the past 25 years, despite the advances in diagnostic tools, microneurosurgery, drug treatment, and decades of huge expenditures on research.
An increased incidence in brain tumors has been reported recently, primarily in benign neoplasms. This may result, at least in part, from recent improvements in diagnostic techniques and changes in neoplasm reporting practices (5). Treatment for elderly patients, the most affected age group, is often a subject of debate due to both perceived risks and costs. However, we believe that such treatment must be individualized, and age alone clearly should not preclude the use of more aggressive therapies, as reported by Nayak and colleagues (1,6).
The interpreting radiologist should have a solid background of knowledge in other clinical neuroscience fields, such as neuroanatomy, pathophysiology, and neuropathology, which in combination with the imaging findings and demographic information, is necessary to generate an appropriate differential diagnosis and provide meaningful guidance for the multidisciplinary team treating the patient. Aside from the initial recognition and characterization of these lesions, the mechanical effects and structural deformities resulting from intracranial neoplasms are also of great importance because the cranium has extremely limited compliance to accommodate increases in intracranial pressure. Therefore, the neuroradiologist must be able to appreciate the consequences resulting from the combined effects of tumors and their edema, many of which are potentially life-threatening, such as transtentorial or uncal herniation. With the advent and refinement of magnetic resonance imaging (MRI), intracranial neoplasms and their effects can be more readily recognized, so that appropriate therapy can be instituted without delay and at an earlier time point in their natural history. This capability has further improved with the introduction of high-field equipment during the last decade (clinical 3-Tesla (T) and research 7-T MRI scanners).
Among all the primary intracranial neoplasms, the neuroepithelial tumors are the most common cancers, representing almost two-third of all these lesions. Meningothelial origin tumors also have a high prevalence, and occur more frequently with increasing age. Tumors arising from cranial and spinal nerves, central nervous system (CNS) lymphomas, and germ cell tumors are less common and are discussed later in this chapter (1). The widely used classification of brain neoplasms has been developed by the World Health Organization (WHO), which includes over 100 different tumor types and subtypes in the CNS, with the latest version published in 2007. There are eight new tumor entities and four new variants included in this new version of WHO classification, with the most important neuroradiologic features of these newly described neoplasms presented in this chapter (1,7,8). Recent major discoveries regarding biologic and molecular features of CNS tumors have raised the question of how all of this nonhistologic data will be assimilated into the WHO classification (9).
At the time of this writing, it is widely acknowledged that MR has become the only imaging study used in the evaluation of intracerebral tumors with two main exceptions—the scenario in which it is simply not available, and for the patient in whom MRI is contraindicated. The most important reason for the reliance on MR in the search for brain tumors lies in its inherently high sensitivity for these lesions. As MR technology continues on its path of continued innovation in hardware, software, image processing, and contrast agents, and as data emerge to suggest that MR can even serve as a surrogate for genomic and proteomic markers of significance (10,11), it is virtually unimaginable that MR will yield its position of dominance anytime soon.
Fundamentals of Lesion Localization and Characterization
When imaging a patient with a known or suspected brain tumor, the radiologist’s goals are to identify and localize the lesion, provide a reasonable and accurate differential diagnosis, and guide further diagnostic and therapeutic interventions. Although advances in MRI have made great strides, the basic principles in identifying a primary brain tumor have remained unchanged (Fig. 8.1). However, the potential for MR in brain tumor imaging is far greater than in the past. Recognition of specific anatomic clues and signal intensity patterns on MR that correlate to known pathology further increases the possibility of identifying specific histopathologic tumor types, and in the great majority of cases results in a more succinct differential diagnosis. In reality, most lesions are fairly obvious and simple
tasks like measurements can be performed by anyone involved in the care of the patient with a brain tumor. However, it is the role of the neuroradiologist to go further and provide a detailed analysis of the findings. This facilitates a more concise differential diagnosis and a more thoughtful treatment plan, ultimately adding significant value to the patient’s management.
tasks like measurements can be performed by anyone involved in the care of the patient with a brain tumor. However, it is the role of the neuroradiologist to go further and provide a detailed analysis of the findings. This facilitates a more concise differential diagnosis and a more thoughtful treatment plan, ultimately adding significant value to the patient’s management.
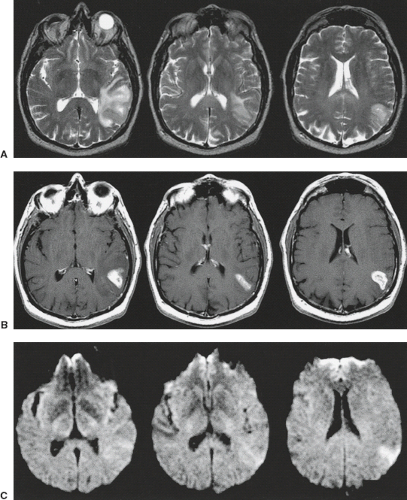 FIGURE 8.1 Tumor, not acute infarction, proven by magnetic resonance. T2-weighted images (A) demonstrate a left posterior temporal–parietal lesion involving the cortex and white matter with sulcal effacement and mild ventricular compression. Partial enhancement after contrast (B) is seen. Diffusion-weighted images (C) fail to demonstrate restriction of diffusion. Notwithstanding the fact that the lesion falls into the territory of the left middle cerebral artery, the diagnosis of acute infarction should be eliminated from consideration because an infarction with mass effect does not enhance significantly, and an infarction with mass effect should have restricted diffusion. |
When evaluating a mass lesion, the first task of the radiologist is to determine if the lesion is intra-axial or extra-axial. This compartmental localization of an intracranial mass lesion is of paramount importance and is fundamental to diagnosis because it completely determines the appropriate pathway for correct differential diagnosis and discussion and it obviously impacts treatment planning. At its most basic level of use, multiplanar MRI has clearly improved our ability to make that distinction. The correct assessment of the relationship of a mass to the ventricular system is also made easier by using coronal and/or sagittal planes in addition to the traditional axial plane of scanning (Fig. 8.2), which aids in differential diagnosis. That said, it is the attention to detail that underscores the value of MR in this fundamental consideration.
One can divide the key MR signs of extra-axial mass lesions into two categories: those that merely suggest the extra-axial location of a brain mass, and other findings that are in fact specific for extra-axial localization (Table 8.1). It is absolutely essential for the radiologist to be cognizant of these findings and their significance. Findings suggestive of but not specific for extra-axial localization include the following: peripheral location along the inner table of the skull (Figs. 8.3 and 8.4), associated
bone change in overlying calvarium (Fig. 8.5), and enhancement of adjacent meninges (Fig. 8.6). All of these “suggestive” findings can also be found in the presence of superficial intra-axial lesions (Fig. 8.7), and so they mainly serve to prompt a closer inspection of the images for the more specific signs. On the other hand, the absence of these findings may be confirmatory in some cases in the decision that a given lesion is intra-axial.
bone change in overlying calvarium (Fig. 8.5), and enhancement of adjacent meninges (Fig. 8.6). All of these “suggestive” findings can also be found in the presence of superficial intra-axial lesions (Fig. 8.7), and so they mainly serve to prompt a closer inspection of the images for the more specific signs. On the other hand, the absence of these findings may be confirmatory in some cases in the decision that a given lesion is intra-axial.
TABLE 8.1 Magnetic Resonance Findings in Extra-axial Mass Lesions | ||||||||||
|---|---|---|---|---|---|---|---|---|---|---|
|
 FIGURE 8.2 Central neurocytoma, value of sagittal for lesion localization. Axial diffusion-weighted (A), T2*-weighted GRE (B), FLAIR (D), T2-weighted (E), and T1-weighted postcontrast MR (F) demonstrate a hypercellular, heterogeneous mass centered in the region of the lateral ventricles. Sagittal FIESTA (C) confirms that the neurocytoma is entirely intraventricular and separate from the adjacent corpus callosum. |
The more important and, in fact, cardinal feature of an extra-axial lesion is clear separation of the mass from the brain surface. This distinction between the mass and the brain surface is made on the basis of identifying the interface between the lesion and the brain by an interposed cleft or “boundary layer.” These boundary layers can consist of cerebrospinal fluid (CSF) within the subarachnoid space, pial blood vessels, cortical draining veins traversing the subarachnoid space (Fig. 8.8) or (if the lesion is epidural) a sheet of dura, all of which may or may not be visible on MR between the tumor mass and the brain. CSF clefts are recognized as crescentic bands whose intensity follows
that of the spinal fluid, being most visible as high intensity on T2-weighted images (Fig. 8.4). It should be noted that CSF clefts are frequently identified only over a portion of the brain–tumor interface, particularly near edges of the mass in question. Vascular clefts are recognized as rounded or curvilinear signal voids at one or more locations on the margin of the lesion on spin-echo sequences. Vascular clefts may represent either the normal arteries and veins located on that surface of the brain or may be due to increased blood flow from the tumor draining into abnormally prominent veins on the brain surface. An additional, highly important “boundary layer” that should also be sought out when assessing an intracranial mass is the cortical gray matter itself (Fig. 8.9). Because edema in underlying cerebral white matter often accompanies adjacent extra-axial neoplasms, and the edema preferentially accumulates in the white matter with its more prominent extracellular space, the edematous white matter should be separated from the mass by intervening cortex if the lesion is extra-axial (Figs. 8.4, 8.10–8.12).
If the tumor touches the edema (i.e., the edematous white matter), then the tumor must be in the gray matter (i.e., intra-axial). This is an extremely useful but often underappreciated finding in lesion localization.
 FIGURE 8.3 Epidural lymphoma with extracranial and intracranial components. T1-weighted (A) and T2-weighted (B) images show a homogeneous, low-intensity, extra-axial, intracranial mass with significant subcutaneous extracranial component. Mass enhances homogeneously (C), as well as within skull marrow, consistent with transcalvarial tumor extension. |
 FIGURE 8.4 Meningiomas demonstrating characteristic features of an extra-axial mass. Axial T2-weighted (A,C) images demonstrate a cerebrospinal fluid cleft between the brain and the lesions, which confirms the extra-axial location. Also note the flow voids on a sagittal T2-weighted image (D, arrow) between the mass and adjacent brain, as well as adjacent vasogenic edema, best seen on T2-weighted images (C,D). After the contrast injection, these lesions display marked homogeneous enhancement (B,E,F). Hyperostosis is also noted of the overlying calvarium (B). |
 FIGURE 8.5 Meningioma with adjacent bone invasion. Postcontrast T1-weighted images (A,B) show an intensely enhancing extra-axial parietal mass with a nodule of enhancing tissue within the marrow of the calvarium. Computed tomography (C) demonstrates a sequestrumlike bone change due to direct tumor invasion. |
 FIGURE 8.6 Superficial intra-axial, extra-axial and cranial vault metastasis, with associated meningeal enhancement. Sagittal FLAIR (A) images show extensive white matter edema in the parietal lobe. Coronal and sagittal T1-weighted postcontrast images (B) and axial T1-weighted postcontrast images (C) show edema and areas of intraparenchymal enhancement. These findings are consistent with intra-axial and extra-axial metastases with dural and leptomeningeal enhancement and cranial vault involvement. |
 FIGURE 8.7 Superficial intra-axial metastasis with meningeal enhancement. Sagittal (A) and axial (B) T1-weighted images show extensive white matter edema in the posterior frontal lobe. T2-weighted images (C) show edema and a focus of low intensity that indicates solid metastasis. After contrast (D), an enhancing mass is seen. The mass abuts edematous white matter with no intervening cortex and does not displace subjacent brain. This intra-axial mass is associated with meningeal enhancement (D). |
 FIGURE 8.8 Dural metastases, prostate carcinoma. Coronal T1-weighted images after intravenous contrast show a superficial enhancing tumor with a nodular component clearly depressing high vertex brain tissue. Note that the enhancing tissue is even superior to overlying veins and superior sagittal sinus, indicating extra-axial origin. Also note the absence of tumor in the overlying calvarium, confirming that the site of metastasis is dura rather than bone. |
 FIGURE 8.9 Cystic meningioma. Axial T1-weighted (A) and T2-weighted (B) images show a largely cystic mass. Superficial enhancing nodule (C) led to the erroneous diagnosis of pleomorphic xanthoastrocytoma, an intra-axial neoplasm. The extra-axial localization, made by identification of a rim of displaced cortex on axial images (A,B), is the key to the correct diagnosis. |
 FIGURE 8.10 Superficial intra-axial tumors. Note the absence of normal cortical gray matter between the lesions (A,B) and the subjacent white matter. There is also massive perilesional edema in the second lesion (B). These findings are seen more frequently in intra-axial lesions. |
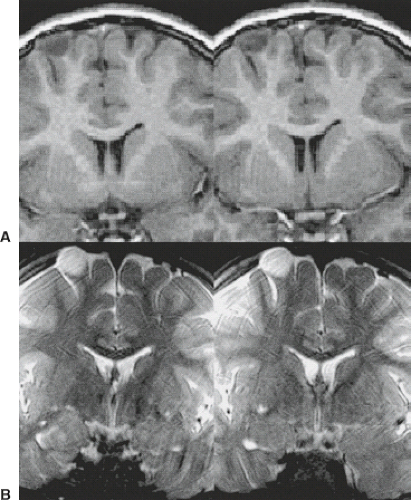 FIGURE 8.11 Superficial exophytic dysembryoplastic neuroectodermal tumor, intra-axial localization. High-resolution coronal T1-weighted (A) and T2-weighted images (B) show a rounded mass eroding the inner table of the calvarium. Despite the exophytic nature of the lesion, the absence of gray matter between the mass and subjacent white matter localizes the tumor to an intra-axial location. |
 FIGURE 8.12 Peripheral but intra-axial mass (breast carcinoma metastasis). Proton density–weighted (A) and T2-weighted (B) images demonstrate a heterogeneous mass extending all the way to the periphery of the frontal pole with subjacent edema and mass effect. Note that the lesion extends right to the edematous white matter rather than being separated from the white matter by intervening cortex, indicating the intra-axial localization of the lesion. Diffuse enhancement of the mass (C,D) and clear meningeal enhancement (C, arrowheads) are features that can be seen in both intra-axial and extra-axial neoplasms. |
 FIGURE 8.13 Dural-based metastases with brain invasion. The rind of the extra-axial tumor is of low intensity on T2-weighted (A) and fluid-attenuated inversion recovery (B) images and is associated with extensive brain edema and cystic intra-axial changes. After contrast (C), the meningeal tumor with invasive component is clearly demonstrated. |
The enhancement of extra-axial lesions often makes their anatomic compartmentalization obvious. We recommend the routine use of intravenous contrast in the search for all intracranial mass lesions. Tissue characterization of masses already noted to be situated in the extra-axial compartment is also a valuable secondary benefit of contrast enhancement (see later sections of this chapter).
Having noted all of these factors, we must acknowledge that occasionally even the compartmental localization of some masses represents a diagnostic dilemma, despite a detailed analysis by the neuroradiologist. Sometimes, the question arises as to whether lesions are multicompartmental (i.e., extra-axial lesions invading the intra-axial compartment (Figs. 8.13–8.15)). These difficult cases should serve as reminders that careful scrutiny of MR images is essential to ascertain the correct diagnosis and to minimize patient morbidity from surgical treatment.
 FIGURE 8.14 Extra-axial cerebellopontine angle meningioma with associated intra-axial radiation necrosis. The extra-axial left cerebellopontine angle mass has typical features of meningioma on T2-weighted (A) and postcontrast T1-weighted (B,C) images. However, extensive and unusually heterogeneous edema on T2-weighted images is concerning and shown to be due to intra-axial enhancing tissue, consistent with radiation necrosis in underlying pons. |
The multiplicity of lesions within the brain is another important determinant in lesion characterization that would make primary brain tumor less likely. In adult patients, the most common solitary brain lesion is still a metastatic lesion. Therefore, the radiologist should scrutinize the entire imaging study, including the marrow signal and both intra- and extra-axial compartments, for additional lesions. The presence of multiple lesions in an adult patient makes metastatic disease more likely, and the radiologist should suggest a search for primary lesion, which may include imaging the chest, abdomen, and pelvis to search for a primary carcinoma. Multifocal lesions may also be seen in infectious etiologies, or in other tumor-mimicking entities such as demyelinating disease. Occasionally, primary brain tumors such as glioblastoma multiforme (GBM) may be multicentric or multifocal or may result in ependymal or leptomeningeal seeding; however, even in these cases, metastases often remain high in the differential diagnosis.
Lesion Characterization
Unfortunately, the progress of MRI in the area of specificity in brain tumor evaluation has not paralleled its gains in
sensitivity and anatomic depiction, although several new techniques are promising in potentially improving diagnostic specificity. With that in mind, MRI provides significant information about intrinsic tissue characterization, a capability that should be fully exploited by the neuroradiologist in determination of tumor type. This ability to discriminate differences in tissue corresponding to variations in signal intensities parallels findings on gross pathology in many cases (Tables 8.2 and 8.3) and applies to several aspects of tumor imaging. For instance, one of the major pathologic changes in astrocytomas and one of the few prognostically significant factors in histopathology, aside from general tumor cell type and overall grade, is the presence of necrosis. The identification of intratumoral necrosis is considered a poor prognostic sign and found in the more aggressive astrocytomas, and should be sought by the neuroradiologist interpreting MR of brain tumors. Necrosis may be either hemorrhagic or nonhemorrhagic. The effects of necrosis on MRI are complex and varied (Table 8.4); however, it is often identified with near certainty when T1-weighted, T2-weighted, and FLAIR sequences are used. In general, necrosis may be either high intensity or low intensity on T1-weighted images, as well as on T2-weighted images, due to the presence of naturally occurring paramagnetic cations and free radicals. These substances usually shorten relaxation times, whereas regions of cystic necrosis prolong relaxation times (12). Cystic necrosis demonstrates signal intensities consistent with high water content although virtually always different from CSF on fluid-attenuated inversion recovery (FLAIR) (Fig. 8.16), and hemorrhagic necrosis parallels in most ways the complex intensities relevant to paramagnetic blood-breakdown products (Fig. 8.17) with some important differences (Fig. 8.18). Among the newer MRI techniques, diffusion-, perfusion-, and permeability-weighted imaging, as well as MR spectroscopy (MRS), may all play a role in assisting further characterization of a lesion (see later discussion).
sensitivity and anatomic depiction, although several new techniques are promising in potentially improving diagnostic specificity. With that in mind, MRI provides significant information about intrinsic tissue characterization, a capability that should be fully exploited by the neuroradiologist in determination of tumor type. This ability to discriminate differences in tissue corresponding to variations in signal intensities parallels findings on gross pathology in many cases (Tables 8.2 and 8.3) and applies to several aspects of tumor imaging. For instance, one of the major pathologic changes in astrocytomas and one of the few prognostically significant factors in histopathology, aside from general tumor cell type and overall grade, is the presence of necrosis. The identification of intratumoral necrosis is considered a poor prognostic sign and found in the more aggressive astrocytomas, and should be sought by the neuroradiologist interpreting MR of brain tumors. Necrosis may be either hemorrhagic or nonhemorrhagic. The effects of necrosis on MRI are complex and varied (Table 8.4); however, it is often identified with near certainty when T1-weighted, T2-weighted, and FLAIR sequences are used. In general, necrosis may be either high intensity or low intensity on T1-weighted images, as well as on T2-weighted images, due to the presence of naturally occurring paramagnetic cations and free radicals. These substances usually shorten relaxation times, whereas regions of cystic necrosis prolong relaxation times (12). Cystic necrosis demonstrates signal intensities consistent with high water content although virtually always different from CSF on fluid-attenuated inversion recovery (FLAIR) (Fig. 8.16), and hemorrhagic necrosis parallels in most ways the complex intensities relevant to paramagnetic blood-breakdown products (Fig. 8.17) with some important differences (Fig. 8.18). Among the newer MRI techniques, diffusion-, perfusion-, and permeability-weighted imaging, as well as MR spectroscopy (MRS), may all play a role in assisting further characterization of a lesion (see later discussion).
 FIGURE 8.15 Invasive meningioma (extra-axial and intra-axial components). Axial T1-weighted (A) and T2-weigthed (B) images show a heterogeneous right occipital mass with significant edema and mass effect. No clear cerebrospinal fluid, venous, or gray matter cleft is identifiable. After intravenous contrast (C,D), the mass enhances homogeneously underlying the occipital lobe and within the interhemispheric fissure. Frondlike interdigitations of enhancing tumor represent invading tumor into the intra-axial compartment. |
TABLE 8.2 Causes of Low Intensity in Tumors on T2-Weighted Magnetic Resonance Images | ||||||
|---|---|---|---|---|---|---|
|
TABLE 8.3 Causes of High Intensity in Tumors on T1-Weighted Magnetic Resonance Images | ||||||
|---|---|---|---|---|---|---|
|
TABLE 8.4 Effects of Tumor Necrosis on Signal Intensity | ||||
|---|---|---|---|---|
|
The association of cysts with certain neoplasms has long been used as an aid to differential diagnosis by neuroradiologists (Table 8.5). Preoperative cyst delineation is also helpful to the neurosurgeon when planning the surgical approach. It is problematic that most neoplasms have prolonged T1 and prolonged T2, just like CSF, so that most tumors are low intensity on T1-weighted images and high intensity on T2-weighted images. This does not necessarily indicate cystic structure, however. Morphology is just one of several criteria for the diagnosis of a cyst by MRI (Table 8.6). Cysts are generally very sharply demarcated, round, or ovoid masses, but there are many
exceptions to these features (13). The identification of cystic areas on MRI also requires careful scrutiny of lesion intensity relative to CSF on all images. FLAIR imaging, a T2-weighted sequence with suppression of the signal intensity of CSF (or any fluid with the T1 of CSF), can be particularly useful in proving the cystic content of a lesion. If a lesion is exactly isointense to CSF on T1-weighted, T2-weighted, and FLAIR images (Fig. 8.19), then one can state very confidently that the lesion is cystic, a pattern followed by arachnoid cysts and many cysts associated with extra-axial masses. Unfortunately for the radiologist, tumor cysts and cystic necrosis within neoplasms are often proteinaceous or contain dilute concentrations of paramagnetic substances that can shorten T1 enough to alter intensity on these images (14). Therefore, these regions are hyperintense to normal CSF on FLAIR (Figs. 8.20–8.22). Fluid–debris intensity levels are a pathognomonic sign of cystic tissue and are often quite striking and frequent in cases of cystic tumors (Figs. 8.22 and 8.23). Another definite sign that reveals the cystic nature of a lesion is the presence of artifacts due to fluid motion within the lesion. This may occasionally be seen as “ghost” images propagated along the phase-encoding direction on conventional images or more commonly as areas of signal loss due to dephasing. Flow-sensitive techniques can illustrate this dramatically (15) and can occasionally be useful adjuncts in evaluating tumors with MRI. Diffusion-weighted imaging (DWI) can also aid in differentiating cystic necrotic regions from bacterial brain abscesses (Fig. 8.24), which have reduced diffusion (16).
exceptions to these features (13). The identification of cystic areas on MRI also requires careful scrutiny of lesion intensity relative to CSF on all images. FLAIR imaging, a T2-weighted sequence with suppression of the signal intensity of CSF (or any fluid with the T1 of CSF), can be particularly useful in proving the cystic content of a lesion. If a lesion is exactly isointense to CSF on T1-weighted, T2-weighted, and FLAIR images (Fig. 8.19), then one can state very confidently that the lesion is cystic, a pattern followed by arachnoid cysts and many cysts associated with extra-axial masses. Unfortunately for the radiologist, tumor cysts and cystic necrosis within neoplasms are often proteinaceous or contain dilute concentrations of paramagnetic substances that can shorten T1 enough to alter intensity on these images (14). Therefore, these regions are hyperintense to normal CSF on FLAIR (Figs. 8.20–8.22). Fluid–debris intensity levels are a pathognomonic sign of cystic tissue and are often quite striking and frequent in cases of cystic tumors (Figs. 8.22 and 8.23). Another definite sign that reveals the cystic nature of a lesion is the presence of artifacts due to fluid motion within the lesion. This may occasionally be seen as “ghost” images propagated along the phase-encoding direction on conventional images or more commonly as areas of signal loss due to dephasing. Flow-sensitive techniques can illustrate this dramatically (15) and can occasionally be useful adjuncts in evaluating tumors with MRI. Diffusion-weighted imaging (DWI) can also aid in differentiating cystic necrotic regions from bacterial brain abscesses (Fig. 8.24), which have reduced diffusion (16).
 FIGURE 8.16 Extensive necrosis in high-grade glioma. Axial diffusion (A), ADC map (B), sagittal fluid-attenuated inversion recovery (FLAIR) (C), axial FLAIR (D), and T1-weighted postcontrast (E) images demonstrate cystic necrosis in a glioblastoma multiforme. Note also the irregular, thick enhancement of the posterior rim. |
 FIGURE 8.17 Hemorrhagic non-germinomatous testicular tumor metastases. A: T1-weighted magnetic resonance (MR). B: T1-weighted postcontrast MR. C: T2-weighted MR. D: T2*-weighted GRE MR image. The intratumoral hemorrhagic necrosis (A,C) displays the high intensity of methemoglobin, dependent levels of intracellular deoxyhemoglobin, and irregular strands of hypointensity within and along the periphery of the lesion. Mild heterogeneous contrast enhancement (B) and marked GRE blooming is noted (D). The high intensity in perilesional white matter represents edema (C). |
 FIGURE 8.18 Hemorrhagic necrosis in a supratentorial primitive neuroectodermal tumor. A: T1-weighted magnetic resonance (MR) (600/20). B: T2-weighted MR (3,000/90). The intratumoral hemorrhagic necrosis displays the high intensity of methemoglobin (1), dependent levels of intracellular deoxyhemoglobin (2), and minimal irregular strands of hypointensity (open arrows) within and at parts of the periphery of the lesion. The high intensity in perilesional white matter (B, closed arrows) represents both edema and infiltrating tumor. |
TABLE 8.5 Frequently Cystic Tumors | ||||||||||||
|---|---|---|---|---|---|---|---|---|---|---|---|---|
|
Hemorrhage is uniquely depicted by MRI because of the paramagnetic properties of many of the blood-breakdown products. On MRI, old hemorrhage is easily distinguished from other fluid (like CSF) because of the paramagnetic properties of methemoglobin, one of the major constituents of chronic intracranial hemorrhage (17). The characteristic tendency of certain primary intracranial neoplasms (e.g., glioblastoma, ependymoma, and oligodendroglioma) and metastases (e.g., melanoma, lung carcinoma, renal cell carcinoma, choriocarcinoma) to hemorrhage can be an important clue to the diagnosis (18,19), and so sensitivity and specificity are desirable for seeing the appearance of hemorrhage (Table 8.7).
TABLE 8.6 Magnetic Resonance Criteria for Cystic Lesions | ||||||||
|---|---|---|---|---|---|---|---|---|
|
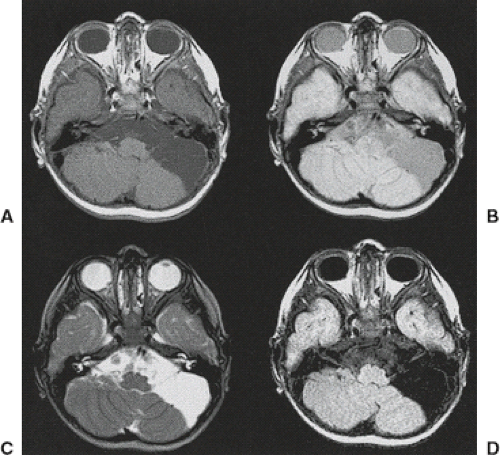 FIGURE 8.19 Fluid-attenuated inversion recovery (FLAIR) for cystic content, arachnoid cyst. The mass in the left cerebellopontine angle is exactly isointense to normal cerebrospinal fluid on T1-weighted (A), proton density–weighted (B), and T2-weighted (C) images. Corresponding FLAIR images (D) confirm that the lesion is precisely isointense to cerebrospinal fluid, thereby proving the diagnosis of arachnoid cyst. |
Although it is important to discover hemorrhage, it is also critical to define its etiology, and CT is of limited value for this. The signal intensity pattern of intratumoral hemorrhage differs from that of benign intracranial hematomas (20) in several ways (Table 8.8). Signal intensity is extremely heterogeneous in tumor bleeds (Fig. 8.25) due to the combination of simultaneously appearing stages of evolving blood (from continual or repeated intermittent bleeding), frequent intracellular blood–fluid or intracellular blood–extracellular blood levels from bleeding into cystic or necrotic portions of
tumor (Figs. 8.26, 8.27), and mixed areas of tumor with edema and hemorrhage (20). Blood may not evolve as rapidly if it is within tumor tissue (20) in comparison with the evolution of benign hematomas (Fig. 8.28). This delay in evolution (seen usually as persistent deoxyhemoglobin, which is normally found only within the first 3 to 5 days after hemorrhage) may be related to the well-documented intratumoral hypoxia found in human neoplasms (21) or due to repeated episodes of bleeding (22). Long after hemorrhage into tumor tissue, there is often a marked reduction or irregularity of the expected hemosiderin on T2-weighted images around the bleed (20) compared with the prominent hypointensity at the periphery of chronic benign intracranial hematomas. A clear sign of neoplasm as the underlying cause of the bleed is the identification of nonhemorrhagic tumor tissue itself (18). Persistence of prominent high intensity on T2-weighted images in the parenchyma surrounding tumor hemorrhage, even when the blood is chronic, is a common and ominous sign (Fig. 8.29) that necessitates follow-up MRI or biopsy (20). In addition, tumor-associated hemorrhage tends to have a larger collar of vasogenic edema, often greater than twice the size of the hemorrhage as compared with bland hemorrhage (23). In the presence of any of these signs accompanying intracranial hemorrhage, one cannot ascribe the hemorrhagic event as being due to a benign cause, and a workup to exclude neoplasm must be performed.
tumor (Figs. 8.26, 8.27), and mixed areas of tumor with edema and hemorrhage (20). Blood may not evolve as rapidly if it is within tumor tissue (20) in comparison with the evolution of benign hematomas (Fig. 8.28). This delay in evolution (seen usually as persistent deoxyhemoglobin, which is normally found only within the first 3 to 5 days after hemorrhage) may be related to the well-documented intratumoral hypoxia found in human neoplasms (21) or due to repeated episodes of bleeding (22). Long after hemorrhage into tumor tissue, there is often a marked reduction or irregularity of the expected hemosiderin on T2-weighted images around the bleed (20) compared with the prominent hypointensity at the periphery of chronic benign intracranial hematomas. A clear sign of neoplasm as the underlying cause of the bleed is the identification of nonhemorrhagic tumor tissue itself (18). Persistence of prominent high intensity on T2-weighted images in the parenchyma surrounding tumor hemorrhage, even when the blood is chronic, is a common and ominous sign (Fig. 8.29) that necessitates follow-up MRI or biopsy (20). In addition, tumor-associated hemorrhage tends to have a larger collar of vasogenic edema, often greater than twice the size of the hemorrhage as compared with bland hemorrhage (23). In the presence of any of these signs accompanying intracranial hemorrhage, one cannot ascribe the hemorrhagic event as being due to a benign cause, and a workup to exclude neoplasm must be performed.
TABLE 8.7 Hemorrhagic Tumors | ||
|---|---|---|
|
 FIGURE 8.20 Fluid-attenuated inversion recovery (FLAIR) evaluation of cystic content (right ependymal cyst) that follows CSF signal on all sequences—axial and coronal T2-weighted images (A,C), axial FLAIR (B) image, and axial DWI (D). There is a cystic-appearing mass along and extending into the right lateral ventricle without diffusion restriction. Occasionally, the cyst may be hyperintense to CSF on FLAIR if there is a high protein content. Fast imaging employing steady-state acquisition (FIESTA) is another important sequence to demonstrate the cystic nature of the lesion and to better characterize its wall (E). |
 FIGURE 8.21 Cystic necrosis in high-grade glioma. T1-weighted (A) and T2-weighted (B) images demonstrate a right insular lesion without calcifications or hemorrhage evident on gradient-echo image (E). Contrast-enhanced image (F) further suggests central necrosis. Fluid-attenuated inversion recovery image (C) demonstrates that fluid within the lesion is not isointense to cerebrospinal fluid (i.e., hyperintensity) due to the proteinaceous content of the neoplastic cystic necrosis. No significant diffusion restriction is noted (D). |
 FIGURE 8.22 Cystic necrosis and hemorrhage in a thyroid metastasis. A: Axial T2-weighted MR. B: Axial T2*-weighted GRE MR image. Note the fluid–debris level inside this lesion, that also exhibits prominent perilesional edema, features that are frequently seen in hemorrhagic and necrotic tumors. |
 FIGURE 8.23 Cystic necrosis in metastases. T1-weighted (A) and T2-weighted (B) images demonstrate left frontal and parietal metastases. Note intralesional fluid–debris levels, proving the cystic nature of the lesions, with ventral fluid being apparently isointense to cerebrospinal fluid. Contrast-enhanced images (C) further suggest central necrosis. Fluid-attenuated inversion recovery (D) demonstrates that ventral fluid within the lesions is not isointense to cerebrospinal fluid (i.e., hyperintensity) due to the proteinaceous content of the neoplastic cystic necrosis. |
 FIGURE 8.24 Diffusion-weighted imaging assisting in the differentiation of inflammatory/infectious disorders from neoplastic lesions. Axial FLAIR (A), DWI (B), and T1-weighted postcontrast (C) images of the upper row demonstrate a ring-enhancing lesion displaying a characteristic homogeneous restricted diffusion, typical features of pyogenic abscess. In the bottom row, coronal T2-weighted (D), axial DWI (E), and a different patient with axial T1-weighted postcontrast (F) images also show findings which may inflammatory or infectious etiology. However, this lesion demonstrates heterogeneous peripheral restricted diffusion (fungal abscess). Similar findings may be seen in necrotic neoplasms. |
TABLE 8.8 Intratumoral Hemorrhage Versus Benign Intracranial Hematomas | ||||||||||||
|---|---|---|---|---|---|---|---|---|---|---|---|---|
|
 FIGURE 8.25 Hemorrhagic metastasis. A: FLAIR MR image. B: T2*-GRE MR. A heterogeneous and irregular mass exhibiting surrounding edema is present in the right posterior frontoparietal region demonstrating a fluid level. The anterior portion of the mass demonstrated nonhemorrhagic components of the tumor. Persistent edema, in the setting of an old hemorrhage, and enhancing nonhemorrhagic tumor tissue, allow for differentiation between benign and tumor-associated hemorrhage. (Courtesy of Victor Hugo Rocha Marussi, MD; Sao Paulo/Brazil.) |
 FIGURE 8.26 Cystic hemorrhagic metastasis. A: Axial T2-weighted MR. B: Axial T2*-weighted GRE MR image. Note the fluid–debris level within this hemorrhagic lesion in the right frontoparietal region with extensive perilesional edema, features that are frequently seen in cystic hemorrhagic tumors. |
 FIGURE 8.27 Intratumoral hemorrhage with complex signal intensities (retinoblastoma metastasis). A: Sagittal T1-weighted magnetic resonance (MR) imaging (600/25). B: Axial T2-weighted MR (2,500/80). C: Necropsy specimen. The right inferior frontal hemorrhagic mass shows marked heterogeneity on MR (B,C), with several different stages of hemorrhage: (1) methemoglobin, (2) deoxyhemoglobin, and (3) ferritin/hemosiderin. High-intensity edema (C,4) and fluid level (C, arrow) contribute to the complex appearance. The tumor is grossly hemorrhagic on pathology. (C: Courtesy of Dr. Lucy Rorke, Philadelphia, Pennsylvania.) |
 FIGURE 8.28 Intratumoral hemorrhage with delayed evolution of blood (lung carcinoma metastasis). A: T1-weighted magnetic resonance (MR) (600/20). B: T2-weighted MR (2,500/80). C: T1-weighted MR (600/20) after 7 days. D: T2-weighted MR (2,500/80) after 7 days. E: T1-weighted MR (600/20) after 17 days. F: T2-weighted MR (2,500/80) after 17 days. The dependent layer of deoxyhemoglobin (open arrow) with ventral fluid (closed arrow) represents hemorrhage into a cystic or necrotic tumor. Note the persistence of deoxyhemoglobin after 17 days (normally, deoxyhemoglobin disappears by 3 to 5 days), indicating slowed evolution of blood-breakdown products. This is probably due to marked and persistent intratumoral hypoxia. |
Some components of tumors may have specific and (occasionally) pathognomonic signal intensities other than hemorrhage. Fat-containing neoplasms (e.g., teratoma, dermoid, lipoma) are easily identified on MRI because fat is high intensity on T1-weighted images and intermediate intensity on conventional T2-weighted images and parallels the intensity of subcutaneous fat. The high signal of fat on fast spin-echo techniques makes this distinction somewhat more difficult. A more specific clue to the diagnosis of fat in tumors is the “chemical shift artifact,” which is related to the difference in resonant frequencies between fat and water protons. This artifact is displayed as a region of signal void at fat–water
interfaces and hyperintensity at water–fat interfaces along the frequency-encoding axis (Fig. 8.30). Fat-selective suppression methods also can play a role in the distinction of etiologies of hyperintense tumors on T1-weighted images (Fig. 8.31). Melanin in tumors (see Metastatic Disease) is also seen as high intensity on T1-weighted images, but it is intermediate intensity on T2-weighted images (Fig. 8.32) (24), distinct from amelanotic tumors and from hemorrhage based on this unique combination of signal intensities (Table 8.9). Unfortunately, melanoma metastases are commonly both hemorrhagic and melanotic (Fig. 8.33), which makes the imaging less specific. Profound hypervascularity associated with tumors markedly narrows the differential diagnosis to hemangioblastoma, glioblastoma, anaplastic oligodendroglioma, or rarely hypervascular metastases like renal cell carcinoma (Figs. 8.34 and 8.35). These large vessels are shown on spin-echo images as linear or
serpentine regions of signal void within and about neoplastic masses and are an important sign for the diagnostician and the surgeon. Another useful sign for differential diagnosis is seen in markedly hypercellular neoplasms, especially those with only minimal cytoplasm. These tumors are, characteristically, relatively low intensity on T2-weighted images and approximate the intensity of normal gray matter (Fig. 8.36). This is a characteristic MR feature of lymphoma and undifferentiated small round cell tumors, such as medulloblastoma, pineoblastomas (PBs), and neuroblastomas. Other tumor types also typically have low intensity on T2-weighted images, including mucinous adenocarcinomas (Figs. 8.37 and 8.38) (particularly from the gastrointestinal or genitourinary tracts or occasionally lung). Metastases from small-cell lung cancer can also have somewhat lower signal intensity on T2-weighted images owing to their hypercellular nature. Similarly, highly cellular astrocytic (generally higher grade) neoplasms have lower water content.
 FIGURE 8.29 Intratumoral hemorrhage with minimal ferritin/hemosiderin and persistent perihematoma high intensity (anaplastic astrocytoma). A: Sagittal T1-weighted magnetic resonance (MR) (600/20). B: Sagittal T2-weighted MR (3,000/80). Even though hematoma is chronic (A, B, arrows), note the very minimal and irregular ferritin/hemosiderin on the T2-weighted image (B). Persistent hyperintensity in the temporal lobe around the chronic hematoma on the T2-weighted image (B) indicates tumor plus edema. C: A brain autopsy section from anaplastic astrocytoma with hemorrhage and necrosis shows persistent expansion of the involved parenchyma and mass effect despite the chronic nature of the hemorrhage. (C: Courtesy of Dr. N. K. Gonatas, Hospital of the University of Pennsylvania, Philadelphia, Pennsylvania.) |
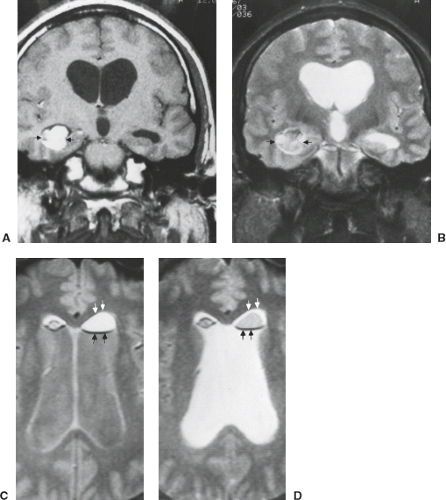 FIGURE 8.30 Tumoral fat on the basis of the signal intensity pattern and chemical shift artifact. A: Coronal T1-weighted magnetic resonance (MR) (600/20). B: Coronal T2-weighted MR (2,800/80). C: Proton density–weighted MR (2,800/30). D: T2-weighted MR (2,800/80). Intraventricular rupture of a high-intensity temporal dermoid (A,B, arrows) is indicated by fat floating within the lateral ventricles (C,D). Note that the signal intensity of the material parallels that of subcutaneous fat and shows a chemical shift artifact (C,D, arrows) (high intensity at the water–fat interface and signal void at the fat–water interface along the frequency-encoding gradient, which is oriented anterior–posterior). |
 FIGURE 8.31 Ruptured dermoid, use of fat suppression. Sagittal T1-weighted magnetic resonance images without (A) and after (B) fat suppression show a midline superior cerebellar cistern hyperintense mass with foci of hyperintensity in the vermian subarachnoid space (A) that all become low intensity after fat suppression (B). |
 FIGURE 8.32 Tumoral melanin in melanoma metastasis. A: Coronal T1-weighted magnetic resonance (MR) (600/20). B: Axial T2-weighted MR (2500/80). C: Histopathologic specimen (hematoxylin and eosin, ×100). The densely melanotic, nonhemorrhagic melanoma metastasis (A,B, arrows) is hyperintense on the T1-weighted image (A) and isointense or only minimally hypointense to cortex on the T2-weighted image (B). This mass was densely melanotic (C, dark reddish-brown staining) with no evidence of iron on microscopic examination. |
TABLE 8.9 Intratumoral Melanin Versus Hemorrhage | ||||||||||||||||||
|---|---|---|---|---|---|---|---|---|---|---|---|---|---|---|---|---|---|---|
| ||||||||||||||||||
 FIGURE 8.33 Melanoma metastases with both hemorrhage and melanin content. Brain autopsy sections (A) show hemorrhagic melanoma metastasis in the mid-parietal gyrus. A microscopic section from another case (B) exhibits nests of neoplastic cells containing melanin (fine brown pigment), in addition to hemosiderin-containing macrophages (coarse brown pigment) and fresh blood. (A: Courtesy of Dr. N. K. Gonatas, Hospital of the University of Pennsylvania, Philadelphia, PA.) |
 FIGURE 8.34 Renal cell carcinoma metastasis as a hypervascular hemorrhagic mass. Sagittal T1-weighted images (A1,A2) show an intra-axial mass with a hemorrhagic component. T2-weighted images (B1,B2) confirm intra-axial localization, demonstrate hemorrhagic and nonhemorrhagic components with extensive edema, and note important regions of signal void in the nonhemorrhagic portion of the lesion (B1). Marked enhancement of the nonhemorrhagic component (C1,C2) is seen on magnetization transfer–suppressed T1-weighted images. The differential diagnosis of hypervascular intra-axial masses is very limited; the presence of hemorrhage makes renal cell metastasis (or glioblastoma) far more likely than hemangioblastoma. |
 FIGURE 8.35 Anaplastic oligodendroglioma. The lesion shows several specific features that allow characterization of the lesion. First, there is irregular heterogeneous signal intensity with central fluidlike signal on T1-weighted (A–C), T2-weighted (D), and postcontrast (E) images, suggesting necrosis. Second, there are several linear and focal regions of signal void (B–D), indicating hypervascularity. Third, there is relatively low intensity on the T2-weighted images in the solid nonnecrotic portion of the mass (isointense to cortex), suggesting hypercellularity (D). Fourth, there is a large amount of “edema” and mass effect. Fifth, thick irregular enhancement is present (E). Anaplastic oligodendrogliomas are virtually identical to glioblastomas on magnetic resonance. Necrosis, neovascularity and hypercellularity are shown on the histopathologic specimen in this case (F). |
Tumor Enhancement and the Blood–Brain Barrier
The brain is highly dependent on a constant internal milieu. This critical function is accomplished mainly by the unique endothelial cells (ECs) of brain capillaries, which form a continuous wall that restricts the movement of many substances from the bloodstream to the interstitial space of the brain, exhibiting some important and vital functions, such as maintenance of brain homeostasis, regulation of influx and efflux of various molecules, and protection from harm, all of them determined by its specialized multicellular structure (25). These capillary cells are part of a very complex physiologic phenomenon known as the blood–brain barrier (BBB), a
concept postulated first by Goldmann in 1913 (26) but not conclusively demonstrated until the 1960s by electron microscopy (27). The cerebral blood vessels are formed by the ECs which represent the primary elements of the BBB. ECs of the BBB differ from those in other tissues due to their unique continuous intercellular tight junctions (TJs), lack of fenestrations, and extremely low rates of transcytosis, limiting both the paracellular and transcellular movement of molecules through the EC layer (25). In addition to TJs in cerebral capillary endothelium, these cells are also surrounded by a sheath of astrocytic foot processes (Fig. 8.39). The passage of molecules through the BBB is regulated by a series of specific transporters, which allow for delivery of nutrients to the brain and extrusion of potential toxins (25). An insult to this finely regulated equilibrium results in increased permeability or breakdown of the barrier, resulting in extravasation of plasma proteins and vasogenic edema. In this context, metalloproteinases (MMP), an enzyme family found among components of the neurovascular unit (NVU), play an important role: it has been shown that inhibition of these enzymes yields a decreased infarct size and prevents BBB breakdown after a focal ischemic stroke (28,29,30). Permeability can be also mediated by the expression of vascular endothelial growth factor (VEGF), with isoform A reported to increase permeability in gliomas and isoform B reported to prevent BBB breakdown (31,32). Astrocytes have numerous crucial roles in addition to BBB maintenance, and act as modulators in synaptic transmission via gliotransmitters and synaptogenesis (33), serve as progenitors of neural cells (34,35), and act as professional phagocytes.
concept postulated first by Goldmann in 1913 (26) but not conclusively demonstrated until the 1960s by electron microscopy (27). The cerebral blood vessels are formed by the ECs which represent the primary elements of the BBB. ECs of the BBB differ from those in other tissues due to their unique continuous intercellular tight junctions (TJs), lack of fenestrations, and extremely low rates of transcytosis, limiting both the paracellular and transcellular movement of molecules through the EC layer (25). In addition to TJs in cerebral capillary endothelium, these cells are also surrounded by a sheath of astrocytic foot processes (Fig. 8.39). The passage of molecules through the BBB is regulated by a series of specific transporters, which allow for delivery of nutrients to the brain and extrusion of potential toxins (25). An insult to this finely regulated equilibrium results in increased permeability or breakdown of the barrier, resulting in extravasation of plasma proteins and vasogenic edema. In this context, metalloproteinases (MMP), an enzyme family found among components of the neurovascular unit (NVU), play an important role: it has been shown that inhibition of these enzymes yields a decreased infarct size and prevents BBB breakdown after a focal ischemic stroke (28,29,30). Permeability can be also mediated by the expression of vascular endothelial growth factor (VEGF), with isoform A reported to increase permeability in gliomas and isoform B reported to prevent BBB breakdown (31,32). Astrocytes have numerous crucial roles in addition to BBB maintenance, and act as modulators in synaptic transmission via gliotransmitters and synaptogenesis (33), serve as progenitors of neural cells (34,35), and act as professional phagocytes.
 FIGURE 8.36 Tumor with dense hypercellularity and scant cytoplasm as low intensity (lymphoma). A: T1-weighted magnetic resonance (MR) (600/20). B: T2-weighted MR (2,800/80). C: Histopathologic specimen (hematoxylin and eosin, low-power field). D: Histopathologic specimen (hematoxylin and eosin, high-power field). The right cerebellar lymphomatous mass (A,B, arrows) is of relatively low intensity on the T2-weighted image (B), consistent with its dense hypercellularity and minimal cytoplasm (high nucleus:cytoplasm ratio) revealed by microscopy (C,D). |
 FIGURE 8.37 Mucinous carcinoma metastases from colon carcinoma. Sagittal T1-weighted (A), sagittal FLAIR (B), coronal T1-weighted postcontrast (C), and axial T2-weighted images demonstrate a right cerebellar mass with peripheral enhancement and central necrosis. The central nonenhancing region demonstrates low signal intensity on T2-weighted images (D). No diffusion restriction seen on DWI (E). |
 FIGURE 8.38 Mucinous carcinoma metastases from colon carcinoma. Axial T2 (A,B), fluid-attenuated inversion recovery (C,D), gradient echo (E,F), T1 precontrast (G,H), and T1 postcontrast (I,J) images demonstrate a right cerebellar mass with peripheral enhancement and central necrosis. The central nonenhancing process demonstrates low signal intensity on the T2-weighted images. In addition, the lack of susceptibility artifact on the gradient-echo images excludes hemorrhage, further allowing refinement of the differential diagnosis. Mucinous metastases from adenocarcinomas of the lung or gastrointestinal or genitourinary tract can appear this way. |
 FIGURE 8.39 The normal blood–brain barrier. A: Artist’s conception, cerebral capillary structure. B: Normal cerebral capillary, electron microscopy. Cerebral capillaries are enveloped by astrocytic foot processes and have endothelial cells with partially fused membranes (“tight junctions,” A), seen at the lower right of the electron micrograph (B) of a normal rat brain capillary cross section. C,D: Microscopic imaging of normal and angiogenic blood vessels. C: Scanning electron microscopic (SEM) imaging of a polymer cast of normal microvasculature, showing the simple, organized arrangement of arterioles, capillaries, and venules. D: SEM image of cast of tumor microvasculature, showing disorganization and lack of the conventional hierarchy of blood vessels. Arterioles, capillaries, and venules are not identifiable as such. (A: Courtesy of Dr. P. Cancilla, Los Angeles, CA. B: Modified from Goldstein and Betz, with permission. C,D: McDonald DM, Choyke PL. Imaging of angiogenesis: from microscope to clinic. Nat Med 2003;9:713–725, with permission.) |
Aside from EC structure and other unique morphologic features of cerebral capillaries, several carrier systems and specialized enzyme-mediated systems are found in these cells, which also represent part of the barrier. BBB interfaces are not found in some regions of the brain, notably the choroid plexus, pituitary gland, and circumventricular organs such as median eminence, area postrema, and pineal gland (36). Capillaries in these regions lack TJs, as they do in dura and pia mater. The outermost layer of arachnoid has TJs and acts as a barrier between CSF and brain (37). Blood–CSF barriers are also present in the choroid plexus; that is, intravascular substances enter the choroid extracellular space at a much faster rate than they enter the CSF surrounding the choroid.
In normal brain and areas of intact BBB, the capillaries are impermeable to intravascularly injected contrast agents. On
MR images, only those regions of tissue that lack an intact BBB enhance in the conventional sense. Note that tumor enhancement on MRI is due to accumulation of the paramagnetic contrast in the water-containing interstitial space. The contrast agent enhances the relaxation of the water protons nearby, that is, the water in the enhancing tissue is visualized as high intensity on T1-weighted images (in the case of gadolinium-containing agents). The rationale for tumor enhancement is multifactorial but relatively simple. Generally speaking, tumors have a tendency to evoke the formation of capillaries within and sometimes adjacent to their tissue. Glioma cells interact with vessels by invading and migrating along the pre-existing vasculature. Subsequently, co-option of the host vessels occurs and the tumor starts to grow (38). As the tumor continues to expand, growth factors such as the VEGF, tend to promote angiogenesis and increase vascular permeability, causing a structural and functional BBB disruption (39,40,41,42,43,44,45,46). This angiogenesis supports further growth (47). Notably, the new blood vessels are leaky and dilated (48), as well as disorganized, tortuous, and demonstrate anomalies in the endothelial wall (40,41,42,49,50,51,52). Inflammatory cascade in pericytes may contribute to BBB breakdown in neoplastic diseases (53). The enhancement pattern thus reflects this extremely variable and complicated series of events. Generally, tumors containing vessels lacking an intact BBB demonstrate enhancement on post contrast imaging. Metastatic lesions possess non-CNS capillaries that are similar to their tissue of origin, so brain metastases virtually always enhance. Extra-axial tumors (e.g., meningiomas) arise from tissues whose capillaries lack TJs, and consequently these tumors enhance. Enhancing tumor vascularity and vascular permeability may also be assessed with dynamic susceptibility contrast (DSC) and dynamic contrast-enhanced (DCE) MR perfusion techniques (Figs. 8.40 and 8.41). It is believed that the presence or absence of capillary endothelia with TJs is the most important factor in predicting enhancement (36); however, the volume of available extracellular space is also an important contributor (54). Ultimately, several factors are necessary for contrast enhancement to occur: absence of the BBB, adequate delivery of the contrast agent (i.e., perfusion), sufficient extracapillary interstitial space for the accumulation of contrast agent, appropriate contrast agent dosage, spatial resolution and imaging parameters to allow its detection, and sufficient time for the contrast agent to accumulate in the region in question. Note that formation of tumor capillaries deficient in BBB constituents, rather than active destruction of the BBB, is presumed to account for tumor enhancement. Moreover, the enhancement of a particular tumor may not merely be an “all-or-none” phenomenon; instead, the function of the BBB should be thought of as a continuum, and capillary structure (and other factors) may be aberrant to different degrees in tumors. Therefore, enhancement may be immediate or delayed, transient or persistent, dense and homogeneous, or minimal and irregular. Contrast enhancement in the traditional sense can be thought of as a snapshot in time, reflecting the degree of contrast agent accumulation in the extravascular, extracellular space at one instant in what is a continuous process. Permeability imaging (see later discussion) quantifies the rate of contrast agent extravasation (e.g., ktrans), providing a measure of BBB permeability and a possible metric for tumor angiogenesis. Perhaps one of the most important points for the radiologist to remember is that the lack of enhancement does not necessarily signify the absence of tumor. In other words, one cannot use enhancement to “separate tumor from edema” in infiltrative gliomas as the tumor is often present in areas that do not enhance.
MR images, only those regions of tissue that lack an intact BBB enhance in the conventional sense. Note that tumor enhancement on MRI is due to accumulation of the paramagnetic contrast in the water-containing interstitial space. The contrast agent enhances the relaxation of the water protons nearby, that is, the water in the enhancing tissue is visualized as high intensity on T1-weighted images (in the case of gadolinium-containing agents). The rationale for tumor enhancement is multifactorial but relatively simple. Generally speaking, tumors have a tendency to evoke the formation of capillaries within and sometimes adjacent to their tissue. Glioma cells interact with vessels by invading and migrating along the pre-existing vasculature. Subsequently, co-option of the host vessels occurs and the tumor starts to grow (38). As the tumor continues to expand, growth factors such as the VEGF, tend to promote angiogenesis and increase vascular permeability, causing a structural and functional BBB disruption (39,40,41,42,43,44,45,46). This angiogenesis supports further growth (47). Notably, the new blood vessels are leaky and dilated (48), as well as disorganized, tortuous, and demonstrate anomalies in the endothelial wall (40,41,42,49,50,51,52). Inflammatory cascade in pericytes may contribute to BBB breakdown in neoplastic diseases (53). The enhancement pattern thus reflects this extremely variable and complicated series of events. Generally, tumors containing vessels lacking an intact BBB demonstrate enhancement on post contrast imaging. Metastatic lesions possess non-CNS capillaries that are similar to their tissue of origin, so brain metastases virtually always enhance. Extra-axial tumors (e.g., meningiomas) arise from tissues whose capillaries lack TJs, and consequently these tumors enhance. Enhancing tumor vascularity and vascular permeability may also be assessed with dynamic susceptibility contrast (DSC) and dynamic contrast-enhanced (DCE) MR perfusion techniques (Figs. 8.40 and 8.41). It is believed that the presence or absence of capillary endothelia with TJs is the most important factor in predicting enhancement (36); however, the volume of available extracellular space is also an important contributor (54). Ultimately, several factors are necessary for contrast enhancement to occur: absence of the BBB, adequate delivery of the contrast agent (i.e., perfusion), sufficient extracapillary interstitial space for the accumulation of contrast agent, appropriate contrast agent dosage, spatial resolution and imaging parameters to allow its detection, and sufficient time for the contrast agent to accumulate in the region in question. Note that formation of tumor capillaries deficient in BBB constituents, rather than active destruction of the BBB, is presumed to account for tumor enhancement. Moreover, the enhancement of a particular tumor may not merely be an “all-or-none” phenomenon; instead, the function of the BBB should be thought of as a continuum, and capillary structure (and other factors) may be aberrant to different degrees in tumors. Therefore, enhancement may be immediate or delayed, transient or persistent, dense and homogeneous, or minimal and irregular. Contrast enhancement in the traditional sense can be thought of as a snapshot in time, reflecting the degree of contrast agent accumulation in the extravascular, extracellular space at one instant in what is a continuous process. Permeability imaging (see later discussion) quantifies the rate of contrast agent extravasation (e.g., ktrans), providing a measure of BBB permeability and a possible metric for tumor angiogenesis. Perhaps one of the most important points for the radiologist to remember is that the lack of enhancement does not necessarily signify the absence of tumor. In other words, one cannot use enhancement to “separate tumor from edema” in infiltrative gliomas as the tumor is often present in areas that do not enhance.
It has long been recognized that the intravenous injection of contrast agents aids in the CT delineation of many intracranial disease processes, especially neoplasia. Similarly, intravenous contrast is definitely indicated for complete evaluation by MRI. Distinction of nonspecific high-intensity foci attributed to ischemia and aging in the deep white matter from metastases or lymphoma can be virtually impossible unless one uses intravenous contrast. Small lesions, especially metastases to cortex, can be missed without contrast enhancement, and metastases may be indistinguishable from other chronic insults in elderly patients in the absence of contrast (Fig. 8.42). Patterns of contrast enhancement and relationship to mass effect often alter differential diagnosis. Leptomeningeal and subependymal metastases are certainly much better detected with intravenous contrast if one is relying on conventional images, but
more recent data show FLAIR to be highly sensitive and perhaps even more sensitive than contrast-enhanced T1-weighted images (55).
more recent data show FLAIR to be highly sensitive and perhaps even more sensitive than contrast-enhanced T1-weighted images (55).
 FIGURE 8.40 Anaplastic astrocytoma with high cerebral blood volume (CBV) discordant with enhancement. The right thalamic grade III astrocytoma (A: axial T2-weighted image) shows just areas of faint enhancement (B: Axial T1-weighted postcontrast with fat saturation) at the lateral aspect of the lesion. However, the optimal site for biopsy was revealed on rCBV map (C) with the highest values seen in the posteromedial aspect of the lesion where only mild enhancement was noted. (Courtesy of Renato Mendonca, Sao Paulo.) |
 FIGURE 8.41 Glioblastoma with high cerebral blood volume (CBV) discordant with regional enhancement. The right temporal and occipital glioblastoma shows classic irregular ring enhancement in the occipital pole (A) but relatively normal CBV in that region (B). The optimal site for biopsy in the right temporal lobe was revealed by CBV abnormality in a different area where only mild enhancement was noted (C,D). |
 FIGURE 8.42 Separating chronic nonmalignant microvascular changes from metastatic lung carcinoma using intravenous gadolinium. Axial fluid-attenuated inversion recovery (FLAIR) (A,B) and postcontrast T1 weighted image (C,D) show multiple small punctate areas of enhancement with minimal adjacent edema (arrows). These lesions are difficult to separate from underlying chronic microvascular changes on the FLAIR images, illustrating the importance of intravenous gadolinium in the evaluation of suspected metastases. |
Newer higher relaxivity gadolinium-based contrast agents (GBCA) such as Gadavist and MultiHance have demonstrated improvement in percentage lesion enhancement, yielding better lesion characterization (56,57,58,59,60,61,62,63,64,65). Heightened sensitivity to contrast enhancement has been shown by using the magnetization transfer saturation technique to suppress background parenchyma (66), although this method has not been universally accepted because of secondary, unwanted nonpathologic enhancement and an overall reduced signal-to-noise ratio.
Advanced Lesion Characterization Tools: Diffusion, Perfusion, Permeability, Spectroscopy, Functional MRI, and Molecular Imaging
There are several advanced MRI techniques that have become widely available including DWI and diffusion tensor imaging (DTI), perfusion and permeability imaging, MRS, and functional MR imaging (fMRI). These techniques, often referred to as the advanced imaging methods, can play an important role in several areas of neuroradiology, such as imaging of tumors, cerebrovascular disease, infectious disease, epilepsy, Alzheimer’s disease, and psychiatric disorders (67). In this section, the most important clinical applications of these sequences and technical considerations are highlighted. Brain tumor imaging is one of the most important applications of advanced imaging with at least six common goals in preoperative and posttreatment setting: (1) differentiation of neoplasm versus non neoplastic process; (2) differentiation of primary brain tumor versus metastatic disease or lymphoma; (3) grading of glial neoplasms; (4) optimal guidance for biopsy; (5) differentiation of recurrent tumor versus treatment-related changes; and (6) posttreatment evaluation of tumor (67). Posttreatment imaging of high-grade gliomas and metastases represent a rapidly evolving field, and although the advanced techniques cited above have emerged as promising in the differentiation of recurrent tumor from treatment-related changes, at present, these techniques have not been validated in clinical trials.
Perfusion Imaging
Perfusion-weighted imaging (PWI) encompasses both DSC MRI and DCE MRI, as well as arterial spin-labeling (ASL), which will be discussed later on this chapter. In brain tumors, DSC perfusion is most conventionally used to measure cerebral blood volume (CBV) and DCE is used to measure vascular permeability.
Dynamic Susceptibility Contrast MRI and Cerebral Blood Volume
DCE MRI is a first-pass bolus technique monitored by a series of T2-weighted or T2*-weighted MR images (68), sometimes referred to as perfusion-weighted or bolus tracking (68), which is based on indicator-dilution methods that can estimate some parameters using magnetic susceptibility properties of paramagnetic contrast agents (e.g., gadolinium chelates). DSC MRI perfusion reflects tumor vascular morphometry and the relative cerebral blood volume (rCBV) and appears to be the most useful, robust, and commonly used perfusion metric derived from DSC MRI in patients with brain tumors that has been correlated with tumor grade and vascular density (68,69). rCBV has also been shown to correlate positively with choline (a marker of proliferative tumor activity) (70), correspondingly increasing with evolution of a low-grade to a high-grade glioma (71). In addition, rCBV may help to differentiate primary CNS lymphoma (PCNSL) and GBM (72) and certain metastases from high-grade astrocytomas (73,74), aid in the differentiation of posttreatment changes from tumor recurrence (74,75), and predict early local recurrence or malignant transformation (76). rCBV has also been proposed as a guide for the stereotactic biopsy of the portions of gliomas most likely to yield the highest grade (77). rCBV thresholds have been proposed for distinguishing low-grade from high-grade gliomas and predicting which low-grade lesions may have a propensity for malignant transformation (78), and rCBV measurements may also help to distinguish low-grade oligodendrogliomas from astrocytomas (79). Furthermore, rCBV has been incorporated into integrated MRI-based strategies that are accurate in the differentiation of several intra-axial brain masses (80). At the time of this writing, rCBV images have become standard in most brain tumor imaging protocols, both at the initial time of diagnosis for characterization, as well as in follow-up scans to search for recurrent tumor.
Dynamic Contrast-Enhanced MRI and Vascular Permeability
DCE MRI is a technique that provides radiologists with several metrics which are useful in quantitative or semi-quantitative assessment of the BBB integrity and leakiness of tumor microvasculature (68). It should be noted that the primary DCE MRI variable of interest in most brain tumor studies is ktrans, generally
used as a surrogate of vascular permeability in oncologic studies. The ktrans value may be increased in neoplasms that produce various vascular permeability factors. It has been demonstrated that ktrans correlates with glioma grade (81,82) and that there exists a direct relationship between ktrans and length of survival in high-grade gliomas. Moreover, substantial changes in ktrans have been documented in high-grade gliomas very soon after initiation of antiangiogenic chemotherapy, well before any notable change in tumor volume, and before correlated changes in CBV, suggesting that this tool may serve as an imaging biomarker for therapeutic response to angiogenesis inhibitors (83). Ongoing clinical trials are exploring the role of permeability imaging, as well as perfusion MRI and MRS, in the monitoring of high-grade glioma therapy.
used as a surrogate of vascular permeability in oncologic studies. The ktrans value may be increased in neoplasms that produce various vascular permeability factors. It has been demonstrated that ktrans correlates with glioma grade (81,82) and that there exists a direct relationship between ktrans and length of survival in high-grade gliomas. Moreover, substantial changes in ktrans have been documented in high-grade gliomas very soon after initiation of antiangiogenic chemotherapy, well before any notable change in tumor volume, and before correlated changes in CBV, suggesting that this tool may serve as an imaging biomarker for therapeutic response to angiogenesis inhibitors (83). Ongoing clinical trials are exploring the role of permeability imaging, as well as perfusion MRI and MRS, in the monitoring of high-grade glioma therapy.
Arterial Spin-Labeling (ASL)
ASL has emerged recently as a useful MRI technique for evaluation of cerebral perfusion. Arterial blood water is labeled using radiofrequency pulses in ASL and therefore does not require contrast agent administration. Additionally this technique has reduced scan duration, higher SNR, and potential for CBF (cerebral blood flow) quantification (84,85). Jiang et al have conducted a prospective study of brain tumors without any prior treatment to evaluate the potential application of ASL as an alternative for DSC perfusion in brain neoplasms (including primary brain tumors, meningiomas, and metastases). All patients underwent both 3D ASL and DSC examinations on the same 3 T scanner, and showed evidence of close correlation between these two techniques. Although further studies using a larger sample size would be necessary to confirm their findings, this method appears to represent a viable and noninvasive method for evaluation of brain tumors (85).
MR Spectroscopy
H-MRS is an in vivo noninvasive technique that aims to detect tumor recurrence on a biochemical level, and has been used during the last decades in the evaluation of the posttreatment brain tumors, especially gliomas (69,86). Relatively normal spectra in adults tend to have a relative predominance of N-acetylaspartate (NAA) as the dominant peak. When choline peaks predominate, especially when the choline-to-NAA ratio exceeds 2:1, the spectral signature suggests cellular proliferation, as can be seen in tumors (87); suppression of all key metabolite spectral peaks, with or without presence of lactate, suggests tissue necrosis (88). Myo-inositol (mI) levels may also correlate with glioma grade, with a trend toward lower mI levels in the presence of anaplastic astrocytomas and GBMs compared with those of low-grade astrocytomas (89). High-grade neoplasms such as GBM tend to exhibit the following typical features on MRS: elevated peaks of choline due to high cellular turnover, presence of lipids/lactate peaks due to anaerobiosis in necrotic regions, and reduced NAA levels reflecting the neuronal damage (69).
Although there was great initial enthusiasm for MRS, many would concede that it has failed to meet those lofty expectations. First, there can be overlap between normal spectra and tumor-type spectra, especially among low-grade astrocytic tumors. In addition, areas of radiation necrosis can have relative choline peak elevation, and histologically both radiation necrosis and recurrent or residual tumor can be seen to coexist. Active demyelination as seen in multiple sclerosis or acute disseminated encephalomyelitis can also present with marked choline peak elevation (90). Nevertheless, although enthusiasm for MRS has waned, it can be a useful adjunct to conventional MR sequences in patients with brain tumors (80), and imaging strategies combining PWI and MRS have been shown to be useful in select cases for distinguishing surgical from nonsurgical lesions and solitary metastases from high-grade gliomas (91,92).
Diffusion-Weighted Imaging
DWI is a technique that is sensitive to microscopic proton diffusion in tissue. Whereas DWI is most often used to identify acute arterial ischemia, other processes that interfere with or “restrict” the movement of water can cause notable changes on DWI, including encephalitis, pyogenic abscesses, and occasionally demyelinating disease. In addition to diffusion rate, DWI signal intensity includes a T2-weighted component as well, and hence true restricted diffusion is typically ascertained by corroborating DWI signal hyperintensity with reduced values on apparent diffusion coefficient (ADC) maps. Slightly reduced diffusion can be seen in highly cellular tumors such as lymphoma (Fig. 8.43), meningioma, and GBM due to the relative paucity of interstitial space and water. Practically speaking, however, it must be noted that the degree to which diffusion is reduced is far subtler and often more heterogeneous than the dramatic reduced diffusion in acute arterial infarction. Moreover, the hypercellular nature of these neoplasms is easily ascertained from the signal intensity patterns on conventional images.
Several reports have suggested an inverse correlation between ADC value and glioma grade for grade II through IV astrocytomas, which likely reflects increased cellularity and relatively decreased extracellular water (93,94,95,96,97). Histograms of tumor ADC values have been shown to facilitate analysis of tumor ADC values and may aid in the distinction of low-grade astrocytomas from oligodendrogliomas (98), although group-to-group differences of statistical significance are often not applicable to individual cases. ADC has also been proposed as a surrogate marker for treatment response of gliomas and metastases to radiation and chemotherapy that can be observed earlier than relatively slow changes in the volume of tumor enhancement on sequential MRI scans. Successful intervention tends to increase tissue ADC, whereas decreasing ADC tends to be a harbinger of tumor recurrence. Very rapid increases in ADC have been shown to precede the development of radiation necrosis (99,100,101,102,103).
DTI techniques sample water motion in at least six noncollinear directions, providing information about both the rate and the direction of water proton motion (104). White matter tracts in normal brain are highly structured, with the myelinated fiber tracts imparting a strong orientational bias toward microscopic water diffusion, which is therefore termed anisotropic. DTI has been explored in a number of disease states that disrupt fiber tract structure. Less-compact white matter pathways exhibit lesser degrees of anisotropy, and all types of white matter typically show greater degrees of anisotropy than are seen in gray matter structures. DTI provides a means to detect alterations in the integrity of white matter structures, although its importance in individual clinical cases has yet to be fully determined.
Because infiltrating gliomas would theoretically disrupt the ordered white matter pathways to a greater degree than vasogenic edema, DTI has been proposed as a method for delineation of glioma margins and regions of tumor infiltration (105,106), and changes in fractional anisotropy (FA) in gliomas have been correlated with the degree of tumor cell infiltration determined histologically (107). In some reports, peritumoral DTI metrics enabled the differentiation of solitary intra-axial metastatic brain tumors from infiltrating gliomas, and FA-based infiltration indices enabled distinction of presumed tumor-infiltrated edema from purely vasogenic edema (108,109) but most reports have found little statistical difference between FA in infiltrating tumor and vasogenic edema (108,110) and in pure edema and tumor-infiltrated edema when data from gliomas, meningiomas, and metastases were compared (111). The use of DTI for tumor margin delineation may therefore be speculative (112).
DTI also provides a means of visually depicting actual white matter pathways (diffusion tensor tractography [DTT]) (Figs. 8.44 and 8.45) (113,114), which may be useful for
providing guidance in neurosurgical procedures by preoperatively depicting important white matter tracts, helping to determine the infiltration of white matter tracts by tumor, and providing evidence of degeneration of white matter tracts distal to tumor sites (wallerian degeneration). DTT has been used for visualization of tumor location relative to eloquent white matter tracts and has been found to be beneficial in the neurosurgical planning and postoperative assessment of gliomas (115,116). That said, DTI has not necessarily been uniformly accepted at the time of this writing by the neurosurgical community as an important clinical tool in mass lesion resection.
providing guidance in neurosurgical procedures by preoperatively depicting important white matter tracts, helping to determine the infiltration of white matter tracts by tumor, and providing evidence of degeneration of white matter tracts distal to tumor sites (wallerian degeneration). DTT has been used for visualization of tumor location relative to eloquent white matter tracts and has been found to be beneficial in the neurosurgical planning and postoperative assessment of gliomas (115,116). That said, DTI has not necessarily been uniformly accepted at the time of this writing by the neurosurgical community as an important clinical tool in mass lesion resection.
 FIGURE 8.43 Diffusion weighted-imaging. Axial T2-weighted image (A) shows a right thalamic mass isointense to gray matter on T2WI with avid enhancement (B). Despite hypercellularity causing low T2-weighted signal intensity, note only a mild diffusion restriction on DWI (C), when compared to dramatic diffusion restriction in acute stroke (D–F) (in this case, secondary to varicella zoster virus). |
 FIGURE 8.44 Diffusion tensor imaging. Left frontal gliomas on fluid-attenuated inversion recovery (FLAIR) (A,D) displacing corticospinal and middle longitudinal fasciculus fibers, as demonstrated by color-encoded fractional anisotropy map (C,F) and diffusion tensor imaging tractography (B,E), which may be helpful for guiding resection of these neoplasms. |
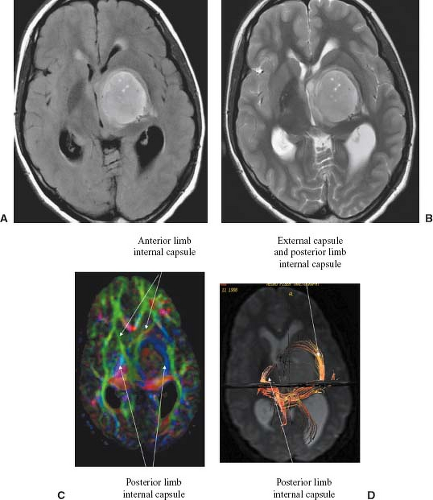 FIGURE 8.45 Intrathalamic glioma on fluid-attenuated inversion recovery (A) and T2 (B) displaces internal and external capsule fibers, as demonstrated by color-coded fractional anisotropy map (C) and diffusion tensor imaging tractography (D), helpful for guiding resection of this deep-seated neoplasm. (Courtesy of L. Tannenbaum, Edison, NJ.) |
Functional MRI
fMRI follows from the neurovascular coupling between neuronal electrical activity and cerebrovascular physiology as localized brain activity causes increases in cerebral blood flow and CBV that tend to overcompensate for the metabolic demand for oxygen, thereby increasing the blood oxygenation level and decreasing the amount of paramagnetic deoxyhemoglobin. This results in increased echo-planar T2-weighted fMRI signal, and this effect gives the technique the name blood oxygenation level–dependent fMRI (see Chapter 33). Changes in blood oxygenation are typically detected by using high-speed gradient-echo echo-planar imaging sequences that are sensitive to the paramagnetic state of deoxygenated hemoglobin, and fMRI techniques can be used to obtain completely noninvasive tomographic maps of human brain activity responding to various stimulus paradigms, including visual, motor, and sensory (117,118).
The ability to identify eloquent cortex in close proximity to brain tumors is a critical component of surgical planning prior to resection (Fig. 8.46). It is also important to determine the hemisphere dominant for speech and language function before surgical resection of many tumors. The use of electrocortical stimulation during awake neurosurgical procedures remains the gold standard for mapping functional areas, but the preoperative use of fMRI is gaining popularity as a supplemental surgical planning tool (119,120,121,122). Although randomized trials or outcome studies that definitively show benefits to the final outcome of the patient when applying fMRI presurgically have not been performed, results have suggested that the combined use of fMRI and DTI can provide a better estimation of the proximity of tumor borders to eloquent brain systems subserving language, speech, vision, and motor and premotor functions and that preoperative planning with these combined techniques may improve surgical outcomes compared to those previously reported in the literature (123,124). Several caveats must be included in dictating such cases for clinical use, most notably that the sensitivity of fMRI to brain activation is highly dependent on field strength, and that the depiction of functioning brain is highly operator-dependent.
 FIGURE 8.46 Task activation fMRI for preoperative planning, right frontal anaplastic astrocytoma. Series of images from fMRI study maps primary sensorimotor cortex and supplemental motor area in relationship to astrocytoma. Multiplanar reformatting shows primary motor function is posterior and superior to tumor margin. |
Emerging MR Imaging Techniques
Digital subtraction of postcontrast from precontrast MR images is a technique that has the potential to improve visualization and provide a more accurate delineation of the enhancing tumor extent compared to unsubtracted postcontrast images, also allowing for better differentiation from the hemorrhagic tumoral component. T1 subtraction maps could be implemented relatively rapidly in clinical trials and might play a role in facilitation of automated, computer-aided lesion segmentation and detection of tumor recurrence.
Additionally, there are a variety of promising physiologic imaging techniques on the horizon, such as 23Na MRI which is able to detect changes in tissue sodium concentration and chemical exchange saturation transfer (CEST) imaging which is sensitive to endogenous mobile proteins and peptides, that may become a part of treatment response assessment in the future (125).
Primary Brain Tumors
According to the Central Brain Tumor Registry of the United States (CBTRUS) report, 66,240 cases of primary brain and CNS tumors are expected to be diagnosed in 2014, of which 22,810 expected to be malignant and 44,430 nonmalignant (126). Tumor classification is an inexact science because of incomplete understanding of tumor histology, molecular genetics, and sometimes even clinical features. Histopathology still remains crucial for the accurate diagnosis of brain tumors and the assessment of their prognosis and treatment; however, its impact remains controversial for both tumor classification and grading. The WHO periodically edits and updates their classification in order to address these controversies, adding multiple new entities and variants in 2007 (7).
Gliomas account for 28% of all tumors and 80% of all brain malignant neoplasms (126,127,128). Most adult gliomas are supratentorial, whereas most of these tumors in childhood are infratentorial. More men than women are affected, and brain tumors are found more commonly in whites than in blacks (4). Classically, astrocytomas could be separated in two different groups based on their imaging appearance: (1) localized (Table 8.10)—pilocytic astrocytoma (PA), subependymal giant cell astrocytomas, and pleomorphic xanthoastrocytoma (PXA); (2) infiltrative (Table 8.11)—representing the vast majority of cases and that include the low-grade (grade II) and high-grade (grades III and IV) gliomas.
Symptoms and signs are linked to direct tissue destruction, infiltration, or secondary increase in intracranial pressure. As will be discussed later on this chapter, MRI plays an important role in the preoperative evaluation, in terms of tumor detection, grading, and lesion delineation, as well as in the posttreatment evaluation. At present, DWI and DSC MR PWI have been used as a part of a preoperative neuroradiologic evaluation in combination with histopathology, demonstrating a strong correlation between glioma grade and rCBV (129), and attempting to establish the correct tumor lineage (oligodendroglial or nonoligodendroglial components) and predict clinical outcomes (68,130,131).
TABLE 8.10 Classification of Astrocytic Brain Tumors | ||||||||
|---|---|---|---|---|---|---|---|---|
|
TABLE 8.11 Diffuse Astrocytic Brain Neoplasms | ||||||||||||||||||||||||||||||
|---|---|---|---|---|---|---|---|---|---|---|---|---|---|---|---|---|---|---|---|---|---|---|---|---|---|---|---|---|---|---|
|
Histopathologic Grading of Astrocytic Neoplasms
WHO grade is one of the most important of the aforementioned criteria and the primary factors for this classification are cell density, nuclear and cytoplasmic pleomorphism, mitoses, necrosis, and vascular endothelial and pericytic proliferation. Using structural sequences and PWI, MR is able to estimate the tumoral cellular density, presence of necrosis, and vascular proliferation; however, pleomorphism and mitoses are characterized only by pathologic examination. Grade I tumors have none of these features, except for slight increased cellularity and minimal cellular pleomorphism, featuring a low proliferative potential and there is a high probability of successful surgical treatment. Grade IV is assigned to those tumors showing a high mitotic rate, cytologic malignant features, and frequent necrosis and is associated with rapid disease evolution to a fatal outcome. Grade IV tumors not only demonstrate cytologic atypia (common in diffuse astrocytoma grade II), anaplasia, and mitotic activity (such as in anaplastic astrocytoma grade III) but also microvascular proliferation (7). In conclusion, although histologic classification and grading play a key role in tumor diagnosis, they have significant limitations. It is well known that these tumors may have coexisting areas with different degrees of anaplasia. Moreover, malignant transformation of lower-grade tumors is not infrequent and often malignant features may appear in specific portions of the mass at a given time, presenting a challenge for accurate pathologic diagnosis. It is also important to realize that pathology interpretations vary greatly among experienced tumor pathologists, even for the most important findings like necrosis, endothelial proliferation, and mitotic figures (132). Additionally, involvement of eloquent areas may limit the surgical approach, thus altering prognosis. Inclusion of the tumors’ genetic profile in initial evaluation may not only improve diagnostic accuracy but may also identify those patients who can benefit the most from a targeted therapy (133).
Infiltrative Astrocytic Tumors
Fibrillary astrocytomas are the most common and well-known grade II neoplasms, characterized by the presence of fibrillary astrocytes within a loose microcystic matrix. Gemistocytic and protoplasmic astrocytomas are other variants in this group. They differ from each other not only in regard to the imaging findings, but also in aspects of management, clinical behavior, and overall survival (OS) rates (134). In adults, these tumors are found most often in the cerebral hemispheres (i.e., in a supratentorial location), whereas in children, infiltrative astrocytomas are typically found in the brainstem. As opposed to the fibrillary astrocytes, the protoplasmic astrocytes are found in the gray matter. Mixed gliomas (e.g., oligoastrocytoma) may also occur infrequently.
Prognosis also varies by the age of the patient. In general, when these tumors are found in older patients, they are more frequently anaplastic, more aggressive, and more symptomatic. On the other hand, in younger patients, infiltrative astrocytomas are usually asymptomatic for a longer period of time, show slower rates of growth, and tend to be more well differentiated histologically (135). Similarly, tumor dedifferentiation occurs more frequently and over a shorter period of time in older patients. Discovery of several different molecular pathways of glioma progression with identification of specific gene loci involved in this process has provided new insights, which may provide targets for future chemotherapeutic regimens (136,137).
Fibrillary (Diffuse) Astrocytoma
Astrocytoma (WHO grade II) represents the well-differentiated subtype of infiltrative astrocytomas and accounts for 25% to 30% of hemispheric gliomas in adults and perhaps up to 30% of cerebellar gliomas found in childhood (18). Although astrocytoma represents the benign end of the spectrum of infiltrative astrocytomas and shows a more indolent course than glioblastoma and anaplastic astrocytoma, the overall prognosis of such lesions is still grim, with median survival rates reported as approximately 7 to 8 years (138,139). Furthermore, it is recognized that about 10% of these low-grade lesions “dedifferentiate” into more malignant forms over time (139). When astrocytomas recur, progression to anaplastic astrocytoma is seen in 50% to 75% of cases (139). Mutations in IDH1 are present in approximately 70% to 80% of grade II or III gliomas (140). Degenerative microcyst formation may be encountered in these well-differentiated neoplasms, but macroscopically they are solid tumors. Microscopically, there is usually a clear region of hypercellularity situated within white matter, often with considerable cellular heterogeneity, even in the absence of frank anaplasia. However, the lesions can be so subtle that reactive astrocytic change is also considered. The tumor can show marked infiltration of structures without significant distortion of gross morphology.
MRI demonstrates adult astrocytomas as relatively homogeneous mass lesions of the cerebral hemisphere, although heterogeneity can be seen in a proportion of cases. Because these tumors are typically hypocellular (Fig. 8.47), they are high in water content and therefore hyperintense on T2-weighted images (Fig. 8.48). These lesions usually lack significant
peritumoral “edema,” which distinguishes them from more malignant astrocytic tumors on MR. Furthermore, the borders of well-differentiated astrocytomas often appear isodense to normal brain on CT. MRI, because of its higher contrast resolution, misleadingly displays these lesions as clearly defined regions of abnormal signal. However, it has been documented that tumor tissue may extend beyond the confines of the imaging abnormality (141,142,143). Intratumoral regions suggestive of flow within vessels on MRI are not typical for astrocytoma. Although focal cystic areas may occasionally be seen on imaging studies, it may not be possible to distinguish microcystic change (which is not surgically drainable) from macroscopically cystic regions of tumor on either CT or MRI. In fact, the most common glial neoplasm with calcification is the astrocytoma, despite the fact that oligodendrogliomas have the highest frequency of calcification.
peritumoral “edema,” which distinguishes them from more malignant astrocytic tumors on MR. Furthermore, the borders of well-differentiated astrocytomas often appear isodense to normal brain on CT. MRI, because of its higher contrast resolution, misleadingly displays these lesions as clearly defined regions of abnormal signal. However, it has been documented that tumor tissue may extend beyond the confines of the imaging abnormality (141,142,143). Intratumoral regions suggestive of flow within vessels on MRI are not typical for astrocytoma. Although focal cystic areas may occasionally be seen on imaging studies, it may not be possible to distinguish microcystic change (which is not surgically drainable) from macroscopically cystic regions of tumor on either CT or MRI. In fact, the most common glial neoplasm with calcification is the astrocytoma, despite the fact that oligodendrogliomas have the highest frequency of calcification.
 FIGURE 8.47 Histologic features of astrocytoma. Note moderately cellular proliferation of astrocytes in a vacuolated matrix and occasional microcyst formation (A,B). In this low-grade astrocytoma, nuclear pleomorphism is mild, mitotic figures are rare, and no necrosis or vascular proliferation is seen. However, cell borders are ill defined, and tumor cells may infiltrate beyond the grossly appearing tumor boundaries. |
 FIGURE 8.48 Diffuse astrocytoma. A–C: Proton density–weighted magnetic resonance (3000/30), right frontal temporal–insular astrocytoma (inferior to superior). D: Coronal necropsy specimen, myelin stain. The high-intensity right-sided, low-cellularity mass (A–C, arrows) is homogeneously hyperintense, with no evidence of hemorrhage or necrosis. Note the absence of high signal in adjacent white matter. The poorly delineated nature of an infiltrating astrocytoma from a different patient (D) with a similar lesion is seen as an ill-defined extensive region of decreased staining in the right insula and deep temporal region. (D: From Okazaki H, Scheithauer B. Atlas of Neuropathology. New York: Gower Medical; 1988, with permission.) |
Usually, these tumors do not show significant enhancement after administration of a gadolinium-based MR contrast agent; however, this atypical feature has been reported in approximately 20% of low-grade gliomas (144). In general, contrast enhancement is not recognized as a reliable indicator of the grade of infiltrative astrocytomas. MR perfusion imaging, however, has shown promise for differentiation between low-grade (WHO II) and infiltrative (WHO III, IV) astrocytomas (129,145,146) and for identification of “low-grade” lesions likely to behave more aggressively (78); therefore, this technique may be used to identify tumors that either high-grade gliomas that have been undergraded because of sampling error at pathologic examination or low-grade gliomas with new angiogenesis which are undergoing progression ultimately resulting malignant transformation (147). The degree of CBV elevation has been shown to be a stronger predictor of both tumor grade and survival than degree of contrast enhancement (148). MRS in low-grade gliomas is characterized by a relatively high concentration of NAA, low level of choline, and absence of lactate and lipids, and may demonstrate a significant elevation of the mI peak, generally with choline/creatine (Cho/Cr) and choline/NAA ratios lower than 2.0. Nonetheless, mI/Cr ratio is typically higher than in high-grade gliomas. ADC values may also be helpful in grade differentiation, with higher values usually found on low-grade tumors (Figs. 8.49 and 8.50) (69). The optimal treatment of these astrocytomas is unclear, but removal of all tumor tissues detected by MRI or visualized intraoperatively by the surgeon may result in longer survival than partial resection or biopsy alone (149,150). Because many of these patients can present in young adulthood and survive beyond 5 or even 10 years, deferring radiotherapy after surgery in patients younger than 50 years until progression is reasonable. Substantial postsurgical tumor warrants radiotherapy, as do patients older than 50 years. Chemotherapy is generally reserved for tumor progression.
Protoplasmic Astrocytoma
This variant of astrocytoma represents a rare subtype of grade II astrocytomas, consisting of process-poor astrocytes on a microcystic background (151). Most are found in the periphery of the frontotemporal region. This tumor affects patients
generally at a younger age than the more common fibrillary subtype. As a low-grade glioma, it displays a relatively indolent behavior, although there is insufficient literature on this subject. On MRI, DWI plays an important role in its characterization showing a rim of reduced ADC around a T2-hyperintense mass, in which the central portion shows suppression on FLAIR sequence (usually greater than 50%) (151). Calcifications and enhancement are uncommon. It is also important to note that despite the low-grade designation, this subtype may share some imaging features with high-grade gliomas on MR perfusion and spectroscopy, such as elevated rCBV and high choline peaks (151) (Fig. 8.51). Differential diagnosis typically includes other astrocytic, glioneuronal, and mixed tumors, as well as oligodendroglioma.
generally at a younger age than the more common fibrillary subtype. As a low-grade glioma, it displays a relatively indolent behavior, although there is insufficient literature on this subject. On MRI, DWI plays an important role in its characterization showing a rim of reduced ADC around a T2-hyperintense mass, in which the central portion shows suppression on FLAIR sequence (usually greater than 50%) (151). Calcifications and enhancement are uncommon. It is also important to note that despite the low-grade designation, this subtype may share some imaging features with high-grade gliomas on MR perfusion and spectroscopy, such as elevated rCBV and high choline peaks (151) (Fig. 8.51). Differential diagnosis typically includes other astrocytic, glioneuronal, and mixed tumors, as well as oligodendroglioma.
 FIGURE 8.49 Diffuse astrocytoma—two different patients. Note that both lesions are homogeneously hyperintense on T2-weighted/FLAIR images (arrows), with no evidence of hemorrhage or necrosis. There is no significant contrast enhancement. |
 FIGURE 8.50 Diffuse astrocytoma—structural images and advanced imaging. An intra-axial mass in the right frontal lobe involving gray and white matter seen on T1-weighted images (C) and is fairly homogeneous and hyperintense on fluid-attenuated inversion recovery (A) and T2-weighted images (B). Note the absence of significant edema within the adjacent white matter (A, blue arrow), a common feature of astrocytoma on MRI. DSC perfusion imaging (E) reveals just a slight increase in rCBV, as well as mild elevation of choline on MR spectroscopy (F). However, elevated peak of myo-inositol is seen, which may also be demonstrated on the color map (G), findings which support the diagnosis of low-grade glioma. |
Anaplastic Astrocytoma
The intermediate form of the infiltrative fibrillary astrocytoma is the anaplastic astrocytoma (WHO grade III). This lesion is somewhere between the astrocytoma and the glioblastoma in its histologic features and in its biologic behavior. It may arise as a dedifferentiated astrocytoma, as noted earlier, where it is found on histopathology in greater than half of the cases of recurrent astrocytoma (18). It may also arise de novo (152). Clinically, the anaplastic astrocytoma is highly malignant, with median survival times of only 2 to 3 years after surgery and radiation therapy (153,154,155). As in grade II astrocytomas, IDH1 and P53 mutations may also be present (140). These lesions generally occur in patients who are older than those with low-grade astrocytomas but younger than those with glioblastomas. The peak incidence of anaplastic astrocytoma of the cerebral hemisphere is in the fifth decade.
On macroscopic pathology, anaplastic astrocytomas are usually more obvious and more heterogeneous mass lesions than their lower-grade counterpart. On microscopic examination (Fig. 8.52), the lesion shows more cellularity, nuclear pleomorphism, and mitotic figures than astrocytoma. As compared with glioblastoma, the necrosis and high degree of vascular proliferation are less common and hypercellularity is more moderate (135). In fact, in some cases, the presence of necrosis is considered diagnostic of glioblastoma rather than anaplastic astrocytoma. The treatment for anaplastic astrocytoma combines gross total resection with adjuvant radiation therapy and chemotherapy.
MRI of anaplastic astrocytoma is variable, which is to be expected in a lesion that on histopathology represents a relatively wide spectrum of intermediate grade tumors from low-grade astrocytoma to glioblastoma. Having said this, these lesions are typically more heterogeneous than a low-grade astrocytoma but usually do not show signs of frank cystic necrosis that are typical in glioblastoma. The high-intensity abnormality on T2-weighted images is commonly accompanied by an adjacent pattern consistent with vasogenic edema,
as is also commonly found in glioblastoma but is uncommon in lower-grade astrocytoma. This “edema” pattern is a reflection of a combination of tumor and edema on histology, so the radiologist should not be misled into thinking that the tumor can be separated from the edema. These lesions can show areas of hypercellularity, as opposed to the lower-grade astrocytoma, and intratumoral hemorrhage or neovascularity may be seen on MR (Figs. 8.53 and 8.54).
as is also commonly found in glioblastoma but is uncommon in lower-grade astrocytoma. This “edema” pattern is a reflection of a combination of tumor and edema on histology, so the radiologist should not be misled into thinking that the tumor can be separated from the edema. These lesions can show areas of hypercellularity, as opposed to the lower-grade astrocytoma, and intratumoral hemorrhage or neovascularity may be seen on MR (Figs. 8.53 and 8.54).
 FIGURE 8.51 Protoplasmic astrocytoma. MR imaging reveals a peripheral left frontal mass that demonstrates a rim of restricted diffusion on DWI (D), with corresponding low ADC values (E, blue arrow). Note also the absence of enhancement (C) and that its central portion, which is hyperintense on T2WI (A), is hypointense on FLAIR (B). Despite the low-grade nature of this lesion, it may present with features of high-grade tumors on MR spectroscopy (F), such as elevated choline peak. DSC perfusion shows elevation of rCBV (G). |
Contrast enhancement is extremely variable in anaplastic astrocytomas in both extent and pattern (Figs. 8.53 and 8.55). The type of enhancement is variable and can be focal and nodular, homogeneous, or ringlike. Intraventricular, subarachnoid, or subependymal spread can be seen in these lesions and in other gliomas. As in high-grade gliomas, areas of heterogeneously abnormal diffusion may be found, reflecting hypercellularity which is associated with increased rCBV on PWI, as well as
elevated Cho/Cr and Cho/NAA ratios (>2,0) and lipides/lactate on MRS (Figs. 8.56 and 8.57) (69). The differential diagnosis on imaging studies can be lengthy for these lesions and most commonly includes other malignant lesions (i.e., solitary metastasis, mixed glioma, oligodendroglioma, and, occasionally, lymphoma). Nonneoplastic considerations might include abscess or cerebritis, which is often clarified by DWI (156).
elevated Cho/Cr and Cho/NAA ratios (>2,0) and lipides/lactate on MRS (Figs. 8.56 and 8.57) (69). The differential diagnosis on imaging studies can be lengthy for these lesions and most commonly includes other malignant lesions (i.e., solitary metastasis, mixed glioma, oligodendroglioma, and, occasionally, lymphoma). Nonneoplastic considerations might include abscess or cerebritis, which is often clarified by DWI (156).
 FIGURE 8.52 Anaplastic astrocytoma, microscopic examination. A high cellular density of pleomorphic cells in a fibrillary eosinophilic background is noted (A). Higher magnification (B) shows nuclear and cytoplasmic pleomorphism with occasional mitotic figures. Necrosis, neovascularization, and giant cell formation are not prominent features here, as they are in glioblastoma. |
 FIGURE 8.53 Anaplastic astrocytoma with hemorrhage, not cavernous angioma. A focal subacute–chronic hemorrhage in the right basal ganglia on T1-weighted (A), fluid-attenuated inversion recovery (B), and T2-weighted (C) images shows several features indicative of hemorrhagic neoplasm rather than cavernous angioma: (1) an irregular, incomplete rim of hemosiderin/ferritin, (2) marked hyperintensity in tissue peripheral to the hemorrhage despite the chronic nature of the hemorrhage, (3) persistence of mass effect in the chronic hematoma, and (4) irregular peripheral enhancement (D). |
Mixed Oligoastrocytomas and Oligodendrogliomas
Oligodendrogliomas (ODs) and mixed oligoastrocytomas are often perceived as relatively uncommon brain tumors; however, they represent 5% to 20% of all glial tumors, with a peak incidence in the fourth to sixth decades, and as with pure astrocytic tumors, low-grade subtypes tend to occur in slightly younger patients (157). According to the WHO 2007, they are classified as grade II or III neoplasms, with the latter displaying distinctly higher cell density and pleomorphism. Most of these tumors are located superficially in the frontal and frontotemporal cortex, although a smaller number may be seen in other locations, such as the ventricular walls, cerebellum, and within the spinal cord (18). Survival appears to depend on tumor grade and prognosis is considerably better than that of infiltrative astrocytomas of similar histologic grade, due to their relative sensitivity to chemotherapy which is associated with 1p/19q codeletion (157). Anaplastic transformation of ODs occurs as it does in diffuse astrocytomas, but dedifferentiation evolves over longer periods of time (135).
 FIGURE 8.54 Anaplastic astrocytoma with intratumoral hypervascularity. Proton density–weighted (A) and T2-weighted (B) magnetic resonance show a large septum pellucidum mass that is hyperintense. Note intratumoral regions of flow due to prominent neovascularity, a more common feature of glioblastoma. |
 FIGURE 8.55 Anaplastic astrocytoma with enhancement. A large heterogeneous mass with extensive “edema” (A) enhances prominently in an irregular fashion (B). |
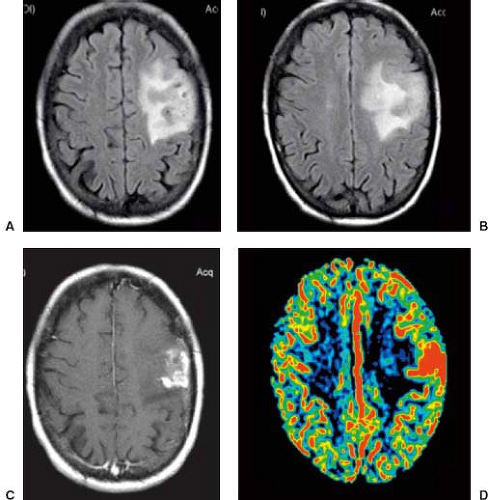 FIGURE 8.56 Anaplastic astrocytoma. A hyperintense mass in the left frontoparietal region is seen on fluid-attenuated inversion recovery (A,B) showing extensive “edema” in white matter, which represents an infiltrative tumor mixed with edema. A focal area within the lesion enhances after administration of contrast (B). The pattern of vasogenic edema and the focal enhancement would not favor a low-grade astrocytoma. Additionally, high values of rCBV on DSC perfusion (D) also favor this diagnosis. |
 FIGURE 8.57 Anaplastic astrocytoma—structural images + advanced methods. MR imaging reveals a focal mass located in the right parietal lobe displaying low T1-weighted signal intensity (A) and a characteristic hyperintensity on FLAIR (B) and T2-weighted imaging (C) images, as well as restricted diffusion (E) and faint enhancement (D) on its periphery. Note also the elevated peaks of choline and lipid/lactate and decreased NAA on MR spectroscopy (F), associated with high values of rCBV on DSC perfusion (G). |
Pathologically, ODs are solid infiltrative lesions with poorly defined borders, like infiltrative astrocytomas. They often contain cellular elements of other glial types, and are considered “mixed” in up to one-half of cases (18). These lesions are densely cellular, with only minimal acellular stroma. The lesions classically exhibit extensive infiltration of cortex, a key distinction from astrocytomas. The presence of perinuclear halos, or the “fried egg” artifact (Fig. 8.58), is a distinct feature of OD, created by autolytic imbibition of water accompanying delayed fixation. Focal cystic necrosis and intratumoral hemorrhage are frequent findings, and calcification is extremely common, being associated with the walls of intrinsic blood vessels (18). Grading of ODs is an unsettled area of histopathology, so obviously grading is not realistic with MR. Data show that microcysts and low cellularity are favorable features, whereas mitoses, vascular hypertrophy, pleomorphism, and cellular atypia are unfavorable (135).
ODs are usually heterogeneous and are of relatively lower intensity than low-grade astrocytomas (i.e., isointense to gray matter) on T2-weighted images because they are typically hypercellular. This appearance can mimic that of glioblastoma. Perhaps the most useful finding on MR in the specific diagnosis of OD is the cortical infiltration and marked cortical thickening (Fig. 8.59), a finding that distinguishes these neoplasms from the astrocytic brain tumors, which arise within white matter. Pronounced thickening of cortex in a heterogeneous intra-axial mass, especially when tumoral calcification is present, should prompt the consideration of OD in adult patients, and evidence of the longstanding nature of the mass can clinch the diagnosis in a patient of the appropriate age group. Small cystic-appearing regions and hemorrhage are commonly found within these masses, which are particularly identifiable on MRI. Linear or nodular tumoral calcification is a common feature in ODs, which are the intracranial neoplasms with the highest frequency of calcification. Edema is not usually a significant feature of lower-grade ODs (158). Contrast enhancement has been reported in about one-half of the cases (159). The differential diagnosis of these lesions usually includes OD and astrocytoma, although astrocytomas are usually more homogeneous, not as frequently calcified, and are often deeper within the hemisphere, arising within the white matter (Figs 8.60–8.63). PWI and MRS may be helpful in these patients in the differentiation of ODs with 1p/19q codeletion from those with intact alleles, usually depicting increased rCBV and high Cho/Cr ratios in the former (160).
 FIGURE 8.58 Oligodendroglioma. The microscopic section demonstrates cells with regular round nuclei and perinuclear halos (“fried egg appearance”) arranged within a delicate capillary network. |
Traditionally, the treatment has centered on surgical excision; however, these lesions are infiltrative and, therefore, generally not cured by surgery alone. Coexistence of deletions of chromosomes 1p/19q is associated with the oligodendroglial phenotype, chemosensitivity to procarbazine, lomustine, and vincristine, and 5-year survival in excess of 90%. Thus, well-differentiated ODs with these genetic markers may be best suited for initial treatment with chemotherapy, with radiotherapy deferred until relapse or used for anaplastic lesions. Differentiation of stable lesions into more aggressive ODs or mixed OD/astrocytoma has also been seen, even after several years of stability.
Gliomatosis Cerebri
Gliomatosis cerebri (GC) is a rare neoplastic process that exhibits extensive involvement of brain affecting at least three cerebral lobes, generally with bilateral involvement of the cerebral hemispheres and relative preservation of the underlying neural structures. Extension to the brain stem, cerebellum, and even the spinal cord is not uncommon (161). GC is considered a grade III neoplasm by the WHO classification (2007) and this term includes “de novo” or primary gliomatosis, as well as the “secondary gliomatosis,” referring to a diffuse pattern of growth of a pre-existent focal glioma (156). GC does not apply to all gliomas that are extremely large and the term should not be used by neuroradiologists in that context, because the term means diffuse cerebral involvement. However, pathology studies have shown that infiltrative gliomas may be present in tissue that appears normal on MRI, so this distinction is sometimes difficult to ascertain with certainty.
The clinical presentation is nonacute and progressive with symptoms lasting for weeks to years. The peak incidence is in the second to fourth decades (162), but all ages are affected. It is still a matter of some debate whether GC is a specific pathologic entity or is a term that includes a widely diverse
group of astrocytic tumors that share the feature of extraordinary infiltration.
group of astrocytic tumors that share the feature of extraordinary infiltration.
 FIGURE 8.59 Oligodendroglioma, value of gradient-echo imaging for characterization. Axial T2 (A,B), fluid-attenuated inversion recovery (FLAIR) (C,D), coronal FLAIR (E,F), and axial gradient-echo (G) images demonstrate a left frontal mass in a 39-year-old man. The presence of cortical thickening, well seen on the coronal FLAIR images, should suggest the diagnosis of oligodendroglioma. The area of susceptibility artifact on the gradient-echo images (G, arrow) corresponds with calcification on the computed tomography scan (not shown). |
On pathologic studies, involved portions of the brain typically include nearly the extent of the cerebral hemispheres, with both gray and white matter affected and the distinction between these regions lost. On gross examination, GC can be categorized as two types: type 1 (classical form)—without tumor mass or type 2—discrete mass in addition to extensive CNS involvement (161). On microscopic examination, neoplastic (usually fibrillary) astrocytes in several stages of differentiation are evident infiltrating both gray and white matter, mainly arranged in a perineuronal and perivascular distribution. There is concomitant thickening of the white matter and extensive demyelination in areas of neoplastic involvement, without any definite focal mass production (162). MRI shows extensive parenchymal involvement, especially of the white matter, as manifested by ill-defined regions of high intensity on T2-weighted images. Contrast enhancement is not believed to be a typical feature unless dedifferentiation has occurred, developing in 30% of cases (156), although irregular enhancement in parts of the
lesion is not rare at initial presentation (Figs. 8.64 and 8.65). At present, there is no standard treatment or this entity, and the therapeutic decisions should be made on case-by-case basis. Surgery is rarely offered, except to relieve mass effect or to establish histopathologic diagnosis. Radiotherapy and chemotherapy may be also used.
lesion is not rare at initial presentation (Figs. 8.64 and 8.65). At present, there is no standard treatment or this entity, and the therapeutic decisions should be made on case-by-case basis. Surgery is rarely offered, except to relieve mass effect or to establish histopathologic diagnosis. Radiotherapy and chemotherapy may be also used.
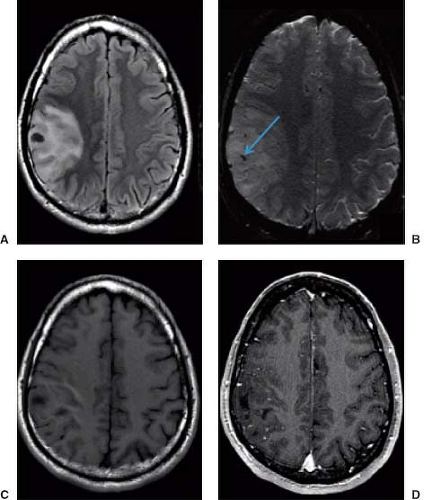 FIGURE 8.60 Oligodendroglioma. MR imaging—(A) axial FLAIR, (B) gradient-echo, (C) T1-weighted image, and (D) T1 postcontrast—reveals a mildly T2 hyperintense (A) peripherally located ill-defined lesion displaying a faint enhancement after the contrast injection (D) and some foci of calcification on T2*weighted-GRE (B, blue arrow). |
Glioblastoma Multiforme (GBM)
GBM (WHO grade IV) represents the most malignant end of the spectrum of astrocytic tumors and accounts for the majority of gliomas, representing 28% of all primary brain tumors and 80% of the malignant ones (163). Half of all adult hemispheric gliomas are GBM. Data from this same source also estimated the incidence of 20,000 newly diagnosed GBM cases for the next two years (2014–2015), just in the United States (163). It is believed that most glioblastomas arise from an existing astrocytoma or anaplastic astrocytoma, but some arise de novo. Most cases are diagnosed in patients older than 50 years of age, with its peak incidence in the sixth decade. Typically, clinical signs and symptoms of elevated intracranial pressure progress rapidly over a period often as short as 1 month from their initial onset. Despite the emergence of therapeutic options during the last decades, the median OS has only shown a modest increase after the standardization of care in 2005, consisting of maximal surgical resection, followed by radiotherapy plus concomitant and adjuvant chemotherapy (Temozolamide) (164). Most
GBM patients die within one year from diagnosis, and only about 5% survive more than five years, despite all aggressive therapies. Factors that appear to correlate with a somewhat better prognosis (165) include younger patients, development of glioblastoma as a secondary dedifferentiation rather than as the initial presentation, and surgical debulking. MGMT status, as well as IDH1, 1p/19q, and P53 mutations may also play a role in predicting outcomes and rates of therapy response. IDH1 and P53 are usually found in secondary GBMs, whereas the 1p/19q mutation is strongly associated with the oligodendroglial lineage and with a better prognosis (166). Additionally, other information, such as analysis of TERTp-mut in combination with EGFR amplification refines the prognostic classification of GBMs (167).
GBM patients die within one year from diagnosis, and only about 5% survive more than five years, despite all aggressive therapies. Factors that appear to correlate with a somewhat better prognosis (165) include younger patients, development of glioblastoma as a secondary dedifferentiation rather than as the initial presentation, and surgical debulking. MGMT status, as well as IDH1, 1p/19q, and P53 mutations may also play a role in predicting outcomes and rates of therapy response. IDH1 and P53 are usually found in secondary GBMs, whereas the 1p/19q mutation is strongly associated with the oligodendroglial lineage and with a better prognosis (166). Additionally, other information, such as analysis of TERTp-mut in combination with EGFR amplification refines the prognostic classification of GBMs (167).
 FIGURE 8.61 Oligodendroglioma B: value of susceptibility weighted-imaging for characterization. Axial T2-weighted (A), sagittal fluid-attenuated inversion recovery (FLAIR) (B), coronal T1 postcontrast (C), and axial susceptibility-weighted (D) images demonstrate a left frontal mass in a 39-year-old man. The presence of cortical thickening, well seen on axial T2-weighted image, should suggest the diagnosis of oligodendroglioma. Mild contrast enhancement is noted (C). The area of susceptibility artifact on susceptibility-weighted images (D, blue arrow) corresponded with calcification on the computed tomography scan (not shown). |
 FIGURE 8.62 Oligodendroglioma C, magnetic resonance (MR) versus computed tomography (CT). A 39-year-old man presented with seizures and was found to have a densely calcified lesion in the left frontal lobe on CT (A). Sagittal T1-weighted image (B) shows signal void in the location of dense temporal calcification. Axial DWI (D), T2*-weighted GRE (E), FLAIR (F), T2-weighted (G), and T1-weighted postcontrast (H) images show faint enhancing areas in the periphery of the mass, with associated white matter signal abnormality. Biopsy revealed oligodendroglioma (WHO grade II). |
Favored sites of localization include the frontal lobe most commonly, followed by the temporal lobe, although frequently glioblastomas involve more than one lobe and can be situated in any lobe. One characteristic distribution is the butterfly pattern of bihemispheric involvement with intervening corpus callosum infiltration, but this is also a pattern in lower-grade astrocytomas. There is a distinct tendency for malignant gliomas, especially those that are located superficially, to invade
leptomeninges and dura with subsequent dissemination via the subarachnoid space (Fig. 8.66). It is quite rare for these lesions to metastasize outside the CNS.
leptomeninges and dura with subsequent dissemination via the subarachnoid space (Fig. 8.66). It is quite rare for these lesions to metastasize outside the CNS.
 FIGURE 8.63 Oligoastrocytoma. Grade II oligoastrocytoma in the left frontal lobe seen a atypically hyperintense on FLAIR (A–C) images and showing faint enhancement (D) after the contrast administration. Note also the high rCBV on DSC perfusion MRI (E) and absence of foci of hypointense calcifications on gradient-echo image (F). |
 FIGURE 8.64 Gliomatosis cerebri. Extensive, heterogeneous gliomatosis involves the brainstem, right hemisphere, and most of the left hemisphere on T1 (A) and T2 (B) images and shows significant mass effect. Despite significant heterogeneity and necrosis, note only minimal enhancement (A). |
 FIGURE 8.65 Gliomatosis cerebri—perfusion color map. Extensive, heterogeneous gliomatosis cerebri involves the brainstem, right cerebellar hemisphere, and most of the frontoparietal regions of the bilateral cerebral hemispheres on FLAIR (A–C) and T1-weighted (E) images and shows significant mass effect. Only minimal enhancement (F–G) is noted after the contrast injection. On DSC rCBV color map (D) areas of increased perfusion are detected, suggesting a possible dedifferentiation and higher grade components. |
 FIGURE 8.66 Glioblastoma—dissemination via subarachnoid space. Axial FLAIR (A), DWI (B), SWI (C), and T1-weighted postcontrast images (D–F) reveal a large infiltrative, heterogeneous tumor with a characteristic distribution of bihemispheric involvement and corpus callosum infiltration. There is a distinct tendency for malignant gliomas to invade the leptomeninges and ependyma, and to disseminate via the subarachnoid space (F, blue arrows). |
Large, irregular, but seemingly well-circumscribed mass lesions are seen on gross pathology, which typically demonstrate central necrosis, hemorrhages of varying ages, and hypervascularity, often with regions of thrombosed vessels (Fig. 8.67). Extensive mass effect and edematous white matter are often seen that may accompany even relatively small tumor masses. The precise mechanism of peritumoral edema formation is poorly understood, but it is presumed to be related to the production of a vascular permeability factor known to be associated with gliomas. In support of this, glioblastomas are typically noted to have substantially elevated vascular permeability (ktrans) to gadolinium as compared with lower-grade gliomas (81,82). The histopathologic appearance of this lesion is reflected in its name of GBM. The diverse nature of cell forms, coupled with regions of markedly cellular tumor and focal necrosis (Fig. 8.68), often makes the diagnosis obvious, yet the lesions are extremely variable in their appearance. Vascular endothelial proliferation within and adjacent to the tumor and intratumoral necrosis is highly characteristic of glioblastoma and is of great prognostic significance among the many and varied features of these lesions on histopathology (13). This endothelial proliferation not only is found strictly within the tumor, but it is also seen in the brain parenchyma adjacent to, but not involved with, the infiltrating margin. Some pathologists separate glioblastoma from anaplastic astrocytoma on the basis of the presence of necrosis, although necrosis alone is obviously not pathognomonic of the lesion.
 FIGURE 8.67 Glioblastoma multiforme, gross specimen. A brain section from an autopsy specimen shows a nonhomogeneous cut surface with hemorrhage and necrosis. (Courtesy of Dr. N. K. Gonatas, Hospital of the University of Pennsylvania, Philadelphia, PA.) |
The MRI features of these malignancies clearly reflect the pathologic findings. MRI demonstrates marked intratumoral heterogeneity, reflecting sites of hemorrhage, necrosis, and varying degrees of hypercellularity (Figs. 8.69 and 8.70). These changes are best seen on T2-weighted images, often showing foci of cystic necrosis and hemorrhage with debris–fluid levels and lower-intensity regions in areas of hypercellularity (Figs. 8.71 and 8.72). Linear or serpentine regions of flow voids within the tumor mass indicate the often prominent angiogenesis that characterizes glioblastomas. Calcification is uncommon and even if seen not particularly helpful in this diagnosis. Because glioblastomas, along with OD and ependymoma, have a tendency to bleed (18,19), it is helpful to identify any of the several features of intratumoral hemorrhage that differ from those seen in benign intracranial hematomas and suggest malignancy. These neoplasms typically show significant mass effect, mainly due to fairly extensive edema mixed with tumor that is usually apparent in the adjacent white matter.
Enhancement patterns are usually very heterogeneous but virtually all GBMs at least partially enhance with intravenous contrast, classically with ringlike pattern depicted as being thick, irregular, and nodular and surrounding necrotic areas (Fig. 8.70). Note that the pattern of ring enhancement can change over several minutes (Fig. 8.73), so a difference in the pattern of enhancement compared to a previous study may or may not indicate a change in the lesion. The enhancement features of GBM alone are virtually indistinguishable from those seen in other neoplasms, including metastases, and may also be seen in radiation necrosis. Of course, most glioblastomas are solitary lesions (as opposed to most metastases); truly multicentric glioblastomas are distinctly unusual (168) (it should be noted that some neuro-oncologists think that multifocal malignant gliomas really represent GC). These lesions may still
be difficult to differentiate from metastases; however, perfusion imaging may assist in making this differentiation (69,131). As demonstrated by Cha and colleagues (168), DSC perfusion also plays an important role in this setting demonstrated as distinct curves of percentage of signal intensity recovery (PSR), with GBM usually showing more than 50% of recovery to the baseline, much higher when compared with metastasis (due to absence BBB) (Fig. 8.74).
be difficult to differentiate from metastases; however, perfusion imaging may assist in making this differentiation (69,131). As demonstrated by Cha and colleagues (168), DSC perfusion also plays an important role in this setting demonstrated as distinct curves of percentage of signal intensity recovery (PSR), with GBM usually showing more than 50% of recovery to the baseline, much higher when compared with metastasis (due to absence BBB) (Fig. 8.74).
 FIGURE 8.68 Glioblastoma multiforme, histopathologic specimens. A: Note typical areas of necrosis with a rim of densely arranged tumor cells (pseudopalisading) around the acellular necrotic debris. Other areas show a high density of pleomorphic cells interspersed with endothelial cell-proliferating neovascularization. B: At higher magnification, neoplastic cells have highly pleomorphic nuclei, multinucleated giant cells, and frequent mitotic figures. |
 FIGURE 8.69 Classic glioblastoma. Axial fluid-attenuated inversion recovery (A–C), gradient-echo (D–F), and T1 postcontrast (G–I) images demonstrate a large right temporal mass with many characteristics of glioblastoma. This mass has central necrosis, areas of hemorrhage (as shown by low–signal-intensity areas on the gradient-echo images), and intralesional flow voids indicative of neovascularity (I, arrowheads). In addition, there is subependymal enhancement (H, white arrows). A daughter ring is also present (H, white arrowhead). Areas of nonenhancing tumor can separate the enhancing components in patients with glioblastoma. |
 FIGURE 8.70 Glioblastoma with characteristic features on conventional MRI. Note heterogeneous mass of tumor with vasogenic edema, low signal on T2 (A) indicating foci of hypercellular tumor, edema with tumor crossing corpus callosum, and thick irregular ring enhancement (B). |
 FIGURE 8.71 Hypercellular glioblastoma. A large, heterogeneous hypercellular glioblastoma is of relatively low signal on T2 (A) and enhances significantly after intravenous contrast (B). Despite the marked hypercellularity of the tumor causing low signal on T2, there is only mildly restricted diffusion (C,D), typical of hypercellular tumors. |
 FIGURE 8.72 Glioblastoma with regions of restricted diffusion. A heterogeneous right frontal mass on T2-weighted (A) and postcontrast (B) images shows marked heterogeneity on the apparent diffusion coefficient map (C) with focal regions of markedly restricted diffusion seen as marked hypointensity. This finding has been reported to distinguish glioblastoma from lower-grade astrocytomas. |
Regions that enhance correlate with areas of tumor tissue on pathology, and so clearly enhancement is helpful in guiding surgical biopsy; however, not all enhancing regions of tumor will necessarily be of similar histopathologic grade, and targeting regions of high CBV derived from perfusion MRI (Fig. 8.41) for biopsy has been advocated by some investigators as a means for identifying the most metabolically active portions of tumor and reducing the risk of undergrading. For
the neuropathologist, it is ideal in fact for the biopsy specimen to include the enhancing ring and the adjacent necrosis, when present. Contrast-enhanced images should also be closely examined for subependymal or leptomeningeal–subarachnoid seeding.
the neuropathologist, it is ideal in fact for the biopsy specimen to include the enhancing ring and the adjacent necrosis, when present. Contrast-enhanced images should also be closely examined for subependymal or leptomeningeal–subarachnoid seeding.
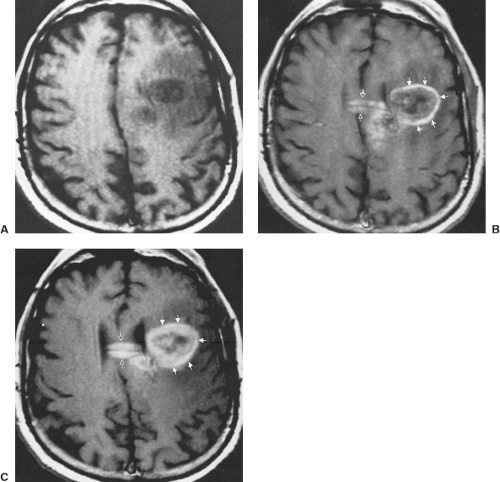 FIGURE 8.73 Change in configuration of an enhancing ring with time (glioblastoma). A: Axial T1-weighted magnetic resonance (MR) (800/20). B: Contrast-enhanced axial T1-weighted MR (800/20), 5-minute postinjection. C: Contrast-enhanced axial T1-weighted MR (800/20), 41-minute postinjection. A heterogeneous glioblastoma in the left frontal lobe (A) shows a thin regular ring of enhancement (closed arrows) on the 5-minute postinjection scan (B). Note the thickening of the ring (closed arrows) with modularity on the 41-minute postinjection scan (C). The enhancement of the tumor crossing the corpus callosum (B,C, open arrows) also thickens with time. |
 FIGURE 8.74 Multifocal glioblastoma—DSC perfusion. An extensive frontal mass demonstrating separate regions of enhancement is seen occasionally in glioblastoma. Structural images such as FLAIR (A), T2-weighted (B), SWI (C), and T1-weighted postcontrast (D) images help in defining the lesion and suggest the correct diagnosis. DSC perfusion imaging metrics such as percentage of signal recovery (usually >50%) and the rCBV values (E) allow the neuroradiologist to achieve a higher level of confidence in the correct diagnosis of multifocal GBM rather than metastases. (Courtesy of Lazaro Luis Faria do Amaral, MD; Sao Paulo, Brazil.) |
There is a differential diagnosis for the imaging appearance of glioblastoma, particularly when only some of the “classic” MRI features (intratumoral neovascularity, hemorrhage, and necrosis) are identified. The differential diagnosis in untreated cases should include metastasis, anaplastic oligodendroglioma, and lymphoma. Even hemangioblastoma (see later in this chapter) can resemble a glioblastoma, due to its associated vessels, heterogeneity, enhancement, and edema. Abscess and other necrotizing processes can also be considered. Radiation necrosis can appear identical to glioblastoma or recurrent tumor, as previously stated (Fig. 8.75). However, MRI can clearly narrow down this list considerably because (a) it is more sensitive for detecting multiple lesions, which would heavily favor metastases; (b) it can fully characterize the capsule of an abscess which is usually thin and exhibits low signal on T2-weighted images, with the center of a pyogenic abscesses showing marked diffusion restriction (170,171); (c) lymphoma is typically without any hypervascularity or hemorrhage and demonstrates more homogeneous low intensity on T2-weighted images; and (d) hemorrhagic neoplasms usually have a relatively specific appearance, which differs in many respects from cavernous angiomas or simple hematomas. Adjunctive MR techniques, like MRS and MR PWI, particularly for radiation necrosis and diffusion MR, may assist in refining the differential diagnosis. In cases in which biopsy is planned, these adjunctive techniques may guide the surgeon toward regions of highest grade, as suggested by elevated CBV or relatively high choline peaks on MRS (172,173).
 FIGURE 8.75 Radiation necrosis, not tumor recurrence. Right parietal edema on fluid-attenuated inversion recovery image (A) with a focus of irregular enhancement (B) represented radiation necrosis, although metastasis and glioblastoma would appear identically. |
The optimal chemotherapeutic regimen for glioblastoma has not yet defined, but adjuvant chemotherapy appears to yield a significant survival benefit in some studies (174). To date there is no consensus on which of the available therapeutic options should be considered as “standard of care” for patients diagnosed with recurrent GBM (monotherapy vs. combined, optimal use of anti-angiogenic drugs, protocol, etc.). During the last years, with the widespread use of new therapies, new phenomena of pseudoprogression (PsP) and pseudoresponse have emerged, which will be discussed later on this chapter.
Gliosarcoma
Gliosarcoma is a CNS tumor that contains distinct elements of both glioma and sarcoma, considered a GBM variant by the WHO. It is classified as a grade IV tumor and comprises only 1.8% to 2.8% of all cases of GBM, generally affecting adults in their fifth to seventh decades of life, mostly found in men (175). The tumors can also be categorized as primary (“de novo”) or secondary (previous history of radiation therapy) (176). Histologically, this tumor fulfills the criteria of GBM, but also exhibits a mesenchymal component with a wide variety of morphologies (177). MGMT methylation and IDH1 mutation are uncommon, as is the EGFR amplification, but the genetic profile is quite similar to the GBMs (178). Clinical symptoms are usually related to a rapidly expanding intracranial tumor, depending on its location. Although this entity shares so many aspects with GBMs, there are some important features that may help in differentiation between these two entities. Gliosarcomas show a temporal lobe predilection and are almost never found in the posterior fossa, although rare cases have been reported (176,177). On imaging exams, this tumor tends to appear as a large necrotic central area, associated with a thick and heterogeneous enhancing periphery, similar to a GBM. Prominent peritumoral edema/infiltration, calcification, hemorrhage, or cystic components have also been described (Fig. 8.76) (175,177,179). Unlike GBMs, these tumors have a well-recognized propensity
to metastasize outside the CNS, most of them affecting lung and liver (177).
to metastasize outside the CNS, most of them affecting lung and liver (177).
 FIGURE 8.76 Gliosarcoma. MR imaging—axial FLAIR (A), T2-weighted (B), T1-weighted (C), DWI (D), SWI (E), and T1-weighted postcontrast images—reveals a large lesion in the left frontal lobe, which exhibit a necrotic central area and a thick/heterogeneous ring-enhancing periphery, similar to a GBM. Note also the prominent peritumoral edema and infiltration, as well as the foci of calcification and/or hemorrhage at its periphery, better appreciated on susceptibility-weighted imaging (E, blue arrow). |
Chordoid Glioma
Chordoid glioma is a recently described tumor that has a typical location in the anterior third ventricle and hypothalamic region, with histologic features distinct from those of other glial tumors (180). This lesion has shown cords and clusters of epithelioid cells with mucinous background, with low-grade lymphoplasmacytic infiltrate, similar to chordoma or chordoid meningioma. However, there is avid staining for glial fibrillary acidic protein, a well-known marker for glial cells. In addition, ultrastructural analysis has shown features of specialized ependymal differentiation, suggesting an origin from the region of the lamina terminalis (181). This lesion has been classified a grade II neoplasm, generally affecting middle-aged patients and shows a strong predilection for the hypothalamus/anterior third ventricle region, with symptoms typically due to local mass effect (182). On imaging exams, this tumor usually appears as a hypothalamic/third ventricular mass which is isointense on T1-weighted MR images and slightly hyperintense on T2-weighted images, displaying a marked homogeneous enhancement after the contrast injection (Fig. 8.77) (180). T2-weighted images have demonstrated signal abnormalities extending into the proximal optic tracts bilaterally, and differentiation from optic pathway glioma can be difficult. Surgical resection, when possible, is the preferred initial treatment modality, and early data suggested a relatively benign behavior for this neoplasm.
Angiocentric Glioma
Angiocentric glioma is a recently recognized tumor, first described in 2005 and classified as a distinct neuroepithelial grade I neoplasm in 2007 by the WHO (183). The cortex and the subcortical white matter of the frontotemporal region are the most common sites for this tumor, generally presenting as a slow-growing lesion (184). This entity generally affects children and young adults presenting with drug-resistant seizures (183,184). These tumors have similar pathologic features to infiltrating astrocytomas and ependymomas, and their rarity complicates accurate diagnosis (184). Histologically, they are characterized by elongated astrocytic cells forming rings around blood vessels. Tumor cells circumferential to the vessels predominant in low cellularity areas, whereas radial alignment with perivascular pseudorosettes was observed in more cellular regions (185). MRI tends to depict a superficial well-delineated T2 hyperintense lesion, generally without
contrast enhancement (Fig. 8.78). The surgical approach, with either a subtotal or gross total surgical resection, is the standard of care for these patients, and prognosis is good with successful surgery. Adjuvant radiotherapy may also play a role in select patients (183,184).
contrast enhancement (Fig. 8.78). The surgical approach, with either a subtotal or gross total surgical resection, is the standard of care for these patients, and prognosis is good with successful surgery. Adjuvant radiotherapy may also play a role in select patients (183,184).
Related posts:
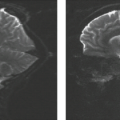
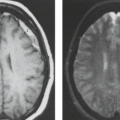
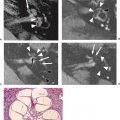
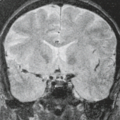
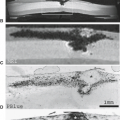
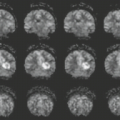
Stay updated, free articles. Join our Telegram channel

Full access? Get Clinical Tree


