Aortic Regurgitation
THE EXQUISITE SENSITIVITY OF TRANSESOPHAGEAL echocardiography (TEE) in identifying aortic regurgitation (AR) is manifested by its ability to detect the minute regurgitant jets engineered into the design of the St. Jude prosthetic valve to flush platelet aggregates off the valve surface. Few studies have been performed investigating the assessment of AR primarily using TEE because of its relatively invasive nature. Most assessments of the severity of AR are based on the assumption that transthoracic echocardiographic (TTE) approaches should be equally applicable to TEE.
MECHANISMS OF AORTIC REGURGITATION
The physiologic functioning of the aortic valve in diastole is dependent on the interplay of several components forming a complex that includes the aortic annulus, sinuses of Valsalva, and the sinotubular junction (Fig. 11.1). The annular basal insertions of the leaflets are into the muscle of the left ventricular outflow tract (LVOT) and the fibrosa of the anterior mitral leaflet. The peripheral leaflet insertions then extend as semilunar structures along the sinuses of Valsalva to end at the sinotubular junction where the commissures are formed and whose diameter is normally 10% to 15% smaller than the diameter of the annulus (1). This relationship can be visualized when the edges of the leaflets are caught obliquely in a midesophageal long-axis view. A delineation of the mechanism of AR is of increasing clinical importance as the mechanism impacts on the approach to surgical repair and valve sparing may be an option. A proposed classification has been advanced that involves three functional mechanisms (2,3):
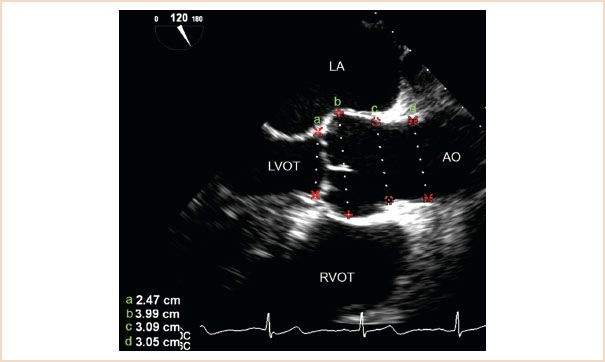
FIGURE 11.1 ME AV LAX view demonstrating appropriate locations for measuring the aortic annulus (a), sinus of Valsalva (b), sinotubular junction (c), and proximal ascending aorta (d). Ao, aorta; LA, left atrium; LVOT, left ventricular outflow tract; RVOT, right ventricular outflow tract.
Type 1: Enlargement of any components of the aortic root (aortic annulus, sinuses of Valsalva, and sinotubular junction) with normal cusps, seen in idiopathic annuloaortic ectasia, ascending aortic aneurysm, Marfan’s syndrome, dissection, aortitis, and Ehlers–Danlos syndrome. This results in displacement of the commissures outward so that the leaflet edges cannot coapt in diastole generally resulting in a central regurgitant jet.
Type 2: Excessive cusp motion including whole, partial, or flail prolapse resulting in noncoaptation below the annular plane (e.g., membranous [ventricular septal defect]VSD, congenitally elongated cusp) or free edge perforation (with an otherwise normal cusp), often with an eccentric regurgitant jet (Video 11.1).
Type 3: Primary cusp tissue damage, where one or more cusps do not reach the opposing cusps due to restricted motion caused by fibrosis, calcification (sclerodegenerative, bicuspid, or rheumatic), or fenestration (due to endocarditis) with an eccentric regurgitant jet (Video 11.2).
In general, Types 1 and 2 may be amenable to repair while Type 3 generally requires valve replacement. TEE evaluation has been shown to correlate very highly with surgical findings and assessment of the sizes of the components of this complex should be part of a routine TEE assessment (3). Recent studies have shown that an intraoperative postrepair assessment can identify patients at significant risk for recurrent regurgitation who require revision and possible valve replacement at the time of the initial procedure. Key factors predicting a high risk of recurrence are the level of coaptation relative to the aortic annulus (lower is worse), the presence or absence of residual AR (more is worse), and a coaptation length of the leaflets (<4 mm is worse) (4).
Type 3 regurgitation due to sclerodegenerative or bicuspid aortic valve disease is the most common type of regurgitation necessitating aortic valve replacement.
HEMODYNAMICS OF AORTIC REGURGITATION
AR represents both an increase in preload and afterload to the left ventricle (LV). The increase in preload is a result of the increased end-diastolic volume resulting from the added regurgitant volume. The increase in afterload is a function of the increased radius of the ventricle. Increase in the end-diastolic radius of a ventricle at any wall thickness increases the wall stress and the force needed to eject blood (law of Laplace). The general response of the ventricle to chronic AR is to dilate and become more compliant to accommodate the extra volume and to hypertrophy to reduce wall stress. The hypertrophy occurs both longitudinally as the heart enlarges—so-called eccentric hypertrophy—and concentrically, as evidenced by its maintaining a “normal” wall thickness as it enlarges. Accordingly, the size of the ventricle is an index of the severity and duration of the regurgitation and should be factored into the assessment of the severity of the lesion.
Acute AR, most commonly due to a tear in the valve secondary to endocarditis, to deceleration injury in a motor vehicle accident, or to stretching of the annulus secondary to an acute dissection, offers a contrasting clinical presentation. Acute aortic insufficiency is one of the least well-tolerated valvular lesions because of the limited ability of the heart to compensate for an acute increase in volume load by the mechanisms discussed above. Consequently, the LV diastolic pressure rises rapidly and is transmitted to the lungs resulting in severe pulmonary congestion. Therefore, in acute AR, the chamber is often normal in size but with catastrophic hemodynamic consequences. Diagnosis of significant AR in the setting of heart failure is essential as intra-aortic balloon counterpulsation is contraindicated because diastolic pressure augmentation worsens the regurgitation.
The assessment of the severity of valvular insufficiency is complicated by the potentially dramatic effects of even transient changes in loading conditions and peripheral vascular resistance on Doppler indices of AR severity. Since the operating room environment is the one in which a multitude of factors affect both the preload and afterload of the ventricle, the potential impact of these changes must be borne in mind when the severity of a valvular lesion is evaluated. Acute increases in peripheral vascular resistance (e.g., following surgical stimulation or the administration of vasopressors) can increase the apparent degree of valvular insufficiency by increasing systemic vascular resistance and impeding peripheral runoff. Conversely, vasodilators (e.g., volatile anesthetics, angiotensin-converting enzyme inhibitors and receptor blockers, calcium channel blockers) reduce peripheral vascular resistance and decrease the apparent degree of insufficiency, both clinically and by Doppler interrogation. The physical properties (e.g., distensibility, elasticity, compliance) of the source (aorta) and recipient (LV) of regurgitant flow, in addition to the size of the regurgitant orifice and the physical properties of the involved valve, are other dynamic variables that further complicate intraoperative assessment. In fact, most clinicians feel it is not possible to definitively assess regurgitant lesions in the operating room environment. As a result of the multitude of factors influencing any assessment of the severity of AR, the estimate should be based on an integration of the results of all Doppler approaches providing technically adequate data in any given patient.
ECHOCARDIOGRAPHIC EVALUATION OF THE AORTIC VALVE
The aortic valve can be evaluated by motion mode (M-mode), two-dimensional (2D), Doppler and three-dimensional (3D) echocardiographic techniques. The primary approaches utilize 2D imaging and both pulse wave (PW) and continuous wave (CW) Doppler to assess valve morphology and severity of disease. Transesophageal 2D echocardiographic imaging of the aortic valve is generally superior to transthoracic imaging because of the improved resolution of the higher-frequency TEE probe. Three-dimensional imaging shares the limits inherent to all ultrasound techniques determined by the interrelation of sector size, frame rate, and depth on image resolution. Both types of TEE imaging are best obtained from the midesophageal short- and long-axis views. The ultimate role of 3D TEE in the assessment of AR remains under investigation but reference is made to preliminary observations utilizing 3D imaging for measurement of the vena contracta in the following discussion.
Methods for assessing the severity of AR have evolved along with advances in Doppler technology since Ward et al. (5) first described the use of pulsed Doppler in conjunction with M-mode echocardiography and auscultation to detect aortic insufficiency. The general approaches to assessing the severity of AR with TEE will be presented in the order of their relative clinical applicability. Color mapping of the LVOT has traditionally been regarded as the most accurate echocardiographic assessment (6–11). Measurement of the width of the vena contracta, the narrowest cross-sectional area of the regurgitant jet as it traverses the valve plane, is emerging as an attractive approach (12). It appears to be less dependent on loading conditions although its efficacy is not as thoroughly documented (8,10). Most studies of this method have been done either in vitro or in the OR with aortic flow probes. The proximity of the TEE probe to the aortic root and LVOT and the ability to interrogate these structures with the higher-frequency TEE signal technically make it possible to delineate the size of these regurgitant jets more accurately than can be done with TTE techniques. The American Society of Echocardiography has published its recommendations for assessment of regurgitant valvular lesions (13) with a more recent update by the European Association of Echocardiography (14).
RECOMMENDED VIEWS
In contrast to stenotic lesions, where the velocity of a jet is a critical factor in the assessment of the lesion, AR interrogation of the leak both parallel and perpendicular to the regurgitant jet is critical because its area of distribution in the LVOT is one of the major variables used in the assessment of severity. The most useful views are generally obtained by starting from the standard ME four-chamber view and changing the angle of interrogation to approximately 120 degrees to visualize the LVOT and proximal aorta in an ME AV LAX view (Fig. 11.1). Withdrawal from this position and, occasionally, slight rotation are used to optimize the view and allow inspection of the proximal ascending aorta. This view is optimal for measuring the components of the aortic root for assessment of the mechanism of regurgitation. The ME AV SAX view at approximately 45 to 60 degrees allows excellent resolution of the individual cusps of the aortic valve (Videos 11.3, 11.4). This too can be obtained from the four-chamber view by centering the atrioventricular (AV) groove and changing the angle to approximately 45 to 60 degrees. Occasionally the probe will need to be withdrawn a few centimeters because the aortic valve is at a slightly higher plane than the AV groove.
Alternatively, but less frequently, reasonable views can be obtained from a deep transgastric (TG) position at an angle close to 0 degrees or greater, subject to individual variation, or from a standard midpapillary TG view at an angle of approximately 120 degrees (TG LAX view). These approaches have the advantage of aligning the ultrasound beam nearly parallel to the direction of blood flow in some patients, while in others orientation parallel to flow requires a deep TG view (Video 11.5). Parallel orientation is essential for accurate quantitative Doppler analysis of both the slope of decay of the regurgitant jet and cardiac output. Conversely, this beam orientation and the greater distances traveled reduce spatial resolution making them a poor choice for visualizing the height or cross-sectional area of an AR jet immediately below the valve plane. However, they may be the only means of assessing the LVOT in the presence of a prosthetic mitral valve (MV), which frequently causes acoustic shadowing of the aortic annulus in more standard views, and occasionally, of an aortic prosthesis when its ring obscures the LVOT image by acoustic shadowing.
The pressure gradient between the regurgitant and recipient chambers in regurgitant valvular lesions is always high and in AR corresponds to the diastolic gradient between the aortic root (diastolic blood pressure) and the LV. By the simplified Bernoulli equation, the gradient equals four times the square of the peak jet velocity. Again, aligning a Doppler beam parallel to the flow is best accomplished in the TG views in the view that is most parallel to flow. In aortic regurgitant lesions, it is the rate of change in pressure gradients that provides clinically useful information unlike the peak velocity measurement used to assess stenotic lesions. Fortunately, color flow Doppler (CFD) techniques for the assessment of AR lesions provide useful information that is, to a significant degree, independent of the angle of the beam to the regurgitant flow.
When CFD is used, the appropriate gain setting for mapping is obtained by first setting the gain high enough so that random color pixels appear within or outside the blood pool (on tissue). Gain is then decreased until these random color pixels disappear. Failure to standardize the color examination in this manner leads to invalid data and is the source of the so-called “dial-a-jet” phenomenon, in which overgaining the Doppler signal can expand the apparent size of the jet. Similarly, using a standard color velocity scale is also important because a change in the scale can markedly change the appearance of a jet and its distribution.
APPROACHES TO THE QUANTITATIVE ASSESSMENT OF AORTIC REGURGITATION
COLOR FLOW MAPPING
In the initial efforts at quantifying AR, pulsed wave Doppler (PWD) was used to map the depth of penetration of the regurgitant jet into the LV cavity. This approach entailed several problems related to the effects of a high-pressure gradient crossing a narrow regurgitant orifice (see later discussion). A better approach was developed in which jet mapping from the then newly introduced CFD technique was used (7,15). Two techniques for color flow mapping are recommended.
Ratio of Jet Height to Left Ventricular Outflow Diameter
Long-axis imaging of the LVOT is used to measure the height of the regurgitant jet immediately below (within 1 cm of) the aortic valve plane, which is then compared with the diameter of the LVOT at that same point (7,15). The optimal views are the ME aortic valve long-axis view and, less frequently, the ME five-chamber view (Fig. 11.2, Video 11.6). The long-axis view that shows the maximal height of the color jet is selected for analysis. The maximal height during diastole is identified during slow motion freeze-frame review. The analysis is performed using the software analysis package of the ultrasound machine. Alternatively, an M-mode cursor can be placed perpendicular to the outflow tract at the point approximately where the maximal LVOT dimension occurs (usually within 1 to 2 cm below the valve plane). If color flow mapping is then activated, the regurgitant jet will appear in color in the M-mode view of the outflow tract, and the relative dimensions can be measured from this display by using the caliper function of the ultrasound machine (Fig. 11.3). This is generally the easier of the two color methods of analysis to perform (Table 11.1) and has been shown to be effective despite major changes in loading conditions in vitro (15). The need for proximity of this measurement to a point close to its origin is readily observed with color flow mapping. The presence of a high-velocity jet (representing the aortic diastolic to LV diastolic pressure gradient) causes rapid entrainment of blood in the ventricle within a few centimeters of this plane and a splaying out of the color jet so that the jet rapidly enlarges below this plane. Imaging of this jet from planes deeper in the ventricle graphically displays this phenomenon and obviates their utility in this measurement.
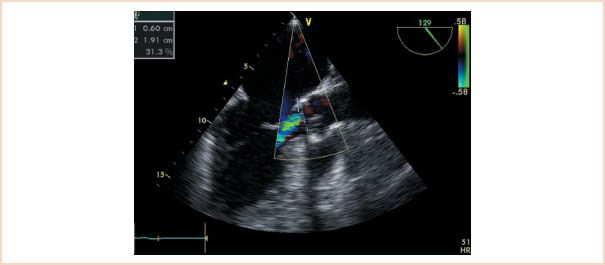
FIGURE 11.2 Midesophageal aortic valve long-axis view demonstrating calculation of the ratio of aortic insufficiency height to left ventricular outflow tract diameter. The internal caliper on the echocardiography system is used to make these measurements. In this example, the ratio is 31%, indicating mild aortic insufficiency.
Ratio of Jet Area to Left Ventricular Outflow Tract Area
In the second color flow mapping technique, the short-axis area of the regurgitant jet in the LVOT is compared with the area of the LVOT at that same level (Fig. 11.4). The preferred view for this approach is the ME AV SAX view, but with the probe advanced to immediately below the valve plane. Again, diastole is evaluated by slow motion freeze-frame review, and the maximal jet area is traced and compared with the area of the LVOT. The process is simplified by using the software analysis package of the ultrasound machine. This method is slightly more accurate than the height–diameter ratio method but is technically more difficult to perform.

FIGURE 11.3 Color M-mode assessment of aortic regurgitation. From the midesophageal aortic valve long-axis view, the M-mode cursor is positioned perpendicular to the aortic root as close to the origin of the regurgitant jet as possible. The jet and the outflow tract are well delineated in the color M-mode display. Caliper measurement of the jet height is compared to that of the root and the resulting ratio of 60% corresponds to moderate aortic regurgitation (Table 11.1).
Table 11.1 Aortic Regurgitation
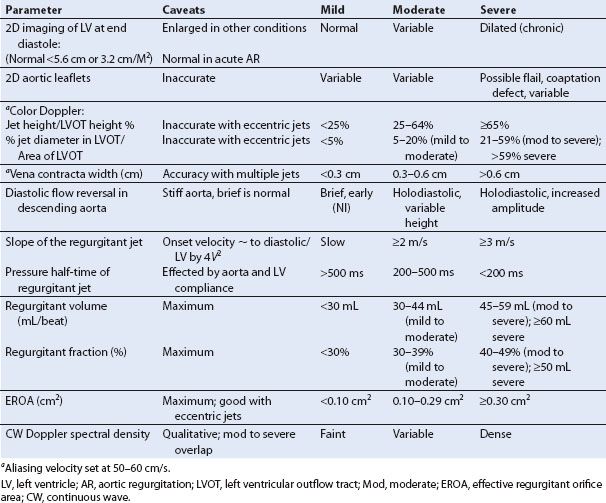
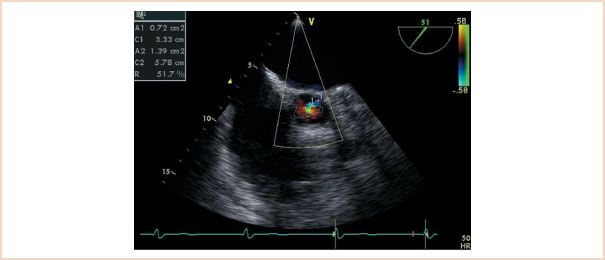
FIGURE 11.4 Midesophageal aortic valve short-axis view demonstrating the jet area/left ventricular outflow tract area method. The ratio of the areas is 51%, indicating moderate to severe aortic regurgitation.
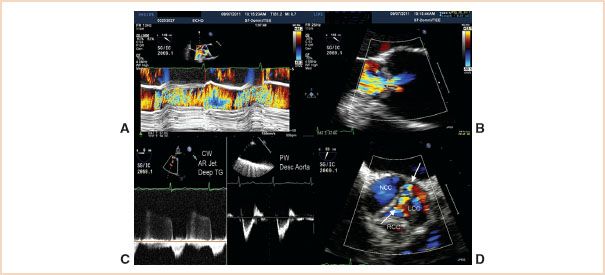
FIGURE 11.5 Pseudosevere AR. A: Color M-mode of the LV outflow tract. The regurgitant jet fills most of the outflow tract in this plane. B: Vena contracta measurement of 0.6 cm consistent with moderate to borderline severe AR. C: Left panel: Deep TG interrogation of the AR jet showing a slow decay with a prolonged pressure half-time. Right panel: Interrogation of the proximal descending aorta showing a normal diastolic flow pattern. Both findings suggest mild AR. D: Short-axis image of the regurgitant jet (arrows) which is along the coaptation line of the noncoronary cusp (NCC) and left cusp (LCC). Right cusp is RCC. In the perpendicular long-axis views (A and B) the severity of the leak is exaggerated.
Caveats
In practice, these approaches provide reliable estimates of severity and have consequently become widely regarded as among the best and most easily applied methods of Doppler assessment (16). They do, however, require technically adequate views and color flow images that cannot always be obtained (Table 11.1).
Regurgitant jets have three dimensions. If a jet results from the lack of adequate alignment between two aortic cusps along their line of coaptation (short-axis view), then interrogation at right angles to that jet (long-axis view) may happen to orient perpendicularly to that line. A relatively narrow regurgitant orifice can then appear to be causing regurgitant flow that fills the outflow tract resulting in an overestimation of the severity of the leak. A cursory review of the outflow tract short-axis view of the jet will clarify this (Fig. 11.5).
Eccentric jets that are angled to the plane of the aortic valve are not adequately assessed by either of these techniques. One approach is the use of a technique similar to that utilized for quantitative assessment of mitral regurgitation based on an application of the conservation of mass using the continuity equation. The technique analyzes the proximal isovelocity surface area (PISA) defining the entrance of the jet into its regurgitant orifice and analysis of the volume of flow into the LV to derive the regurgitant orifice. Practical and theoretical problems with this technique are discussed below. The use of measurement of the vena contracta can be helpful in analyzing eccentric jets and is a more practical approach intraoperatively because TEE allows higher resolution definition of this than TTE.
MAPPING THE VENA CONTRACTA
The vena contracta is the narrowest portion of the jet immediately after crossing the valve plane and can be identified by first visualizing the convergence zone of color flow (PISA) as it approaches and traverses the valve plane. To optimize visualization, the echo sector is narrowed and the depth decreased to maximize the LVOT size and frame rate. Subtle adjustments of angulation and rotation from this point may be needed to identify the vena contracta (Fig. 11.6). In some patients, particularly with very eccentric jets, visualization is not possible. Long- and short-axis views are then obtained from the ME AV LAX and SAX views respectively, as outlined earlier. The width of the vena contracta is measured as it passes through and defines the regurgitant orifice as it exits the valve plane (10,17). The largest diameter of the vena contracta during any portion of diastole is measured in the long-axis plane of the jet, or planimetry of its area is performed in the short-axis view at the valve plane. In a small series of patients undergoing TEE, a vena contracta width of more than 6 mm2 or an area of more than 7.5 mm2 predicted severe AR (10). A vena contracta width of 3 to 6 mm2 defines moderate valvular insufficiency. When less than 3 mm2 the insufficiency is mild (Table 11.1). More importantly, and in contrast to observations made during assessments of the severity of mitral regurgitation with this technique (18), changes in afterload obtained with phenylephrine or volume loading do not change the size of the vena contracta, suggesting this measurement to be relatively load independent (16,19,20). This approach has become the method of choice for intraoperative assessment because of its relative ease of acquisition and apparent load independence. It should be emphasized again that regurgitant jets are 3D and as a consequence multiple views should be obtained and analysis made of the best defined area of the vena contracta. The process is simplified by using the software analysis package of the ultrasound machine. This method is slightly more accurate than the height–diameter ratio method but is technically more difficult to perform.
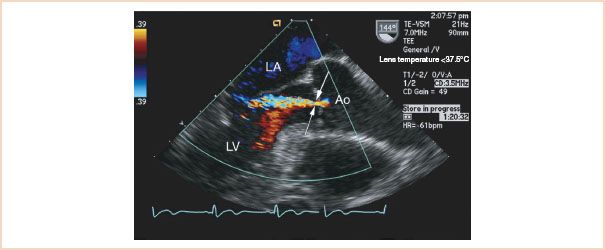
FIGURE 11.6 Midesophageal long-axis view. Arrows indicate the vena contracta. This often reaches its true (narrowest) dimension slightly below the valve plane at the flow convergence zone. The latter is the point at which flow from the central aorta reaches its narrowest dimension after it is “focused” by entering the regurgitant orifice on the aortic side of the valve. LA, left atrium; Ao, aorta; LV, left ventricle.
Related posts:
Stay updated, free articles. Join our Telegram channel

Full access? Get Clinical Tree


