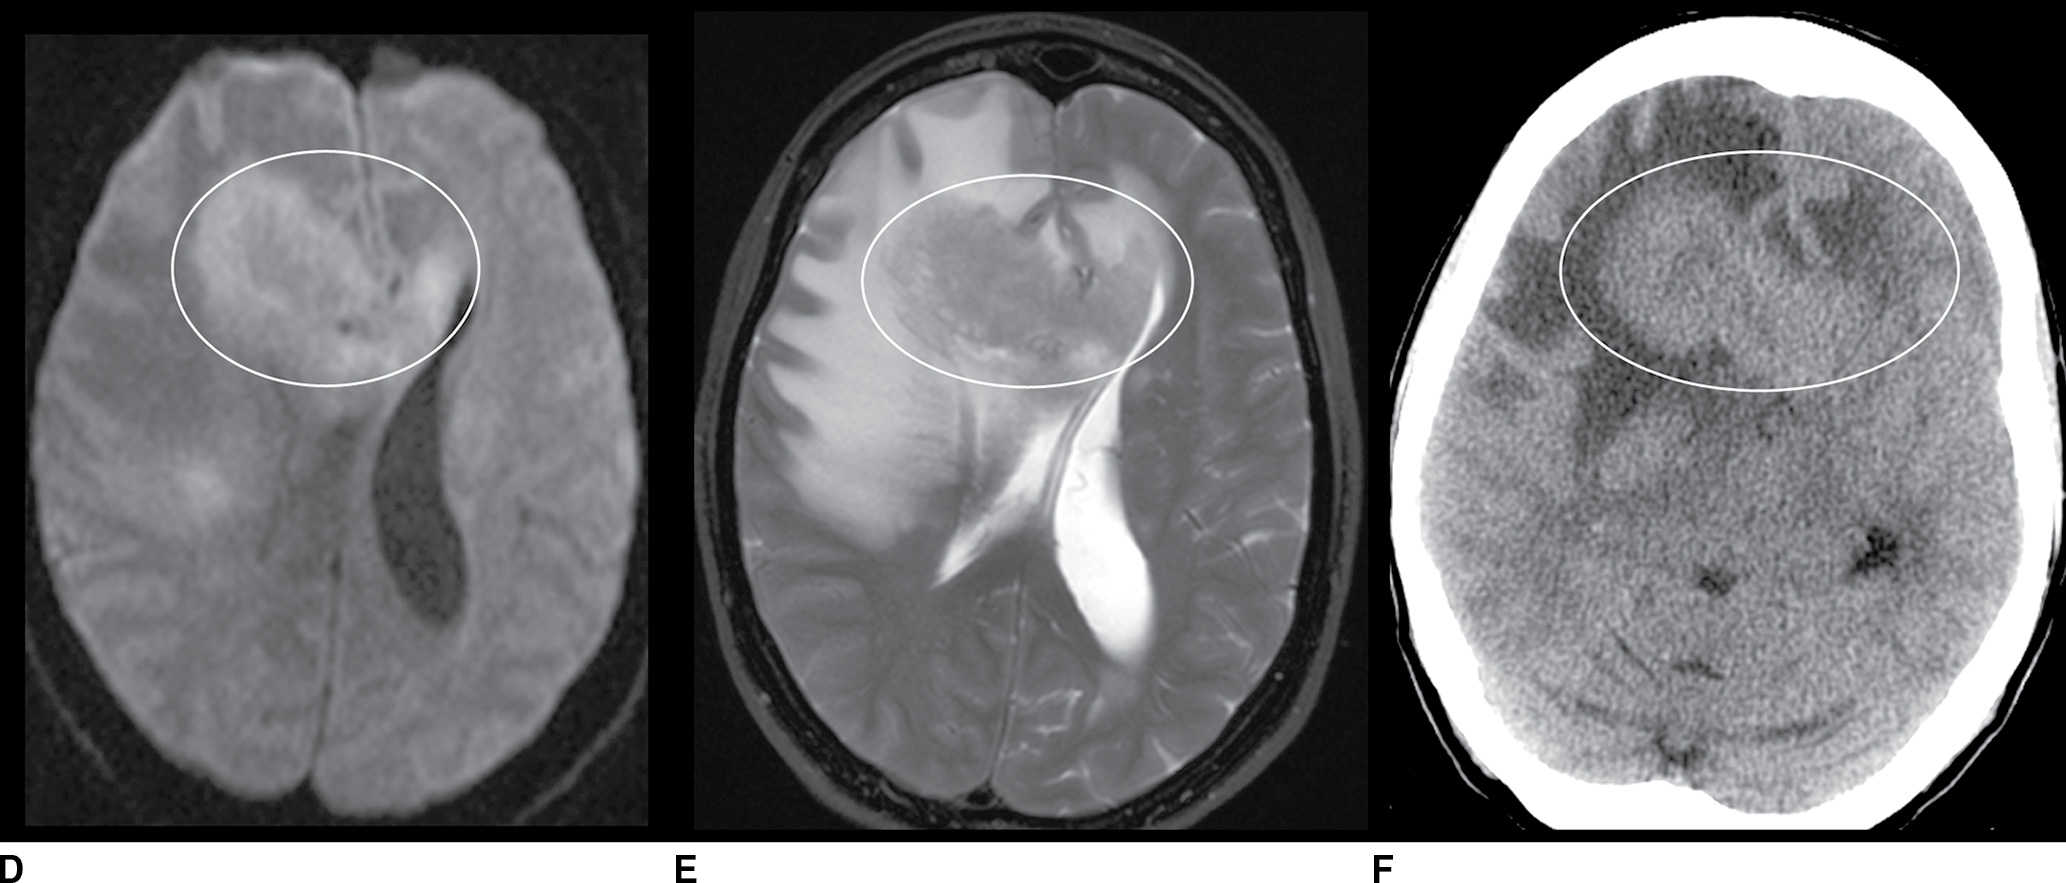
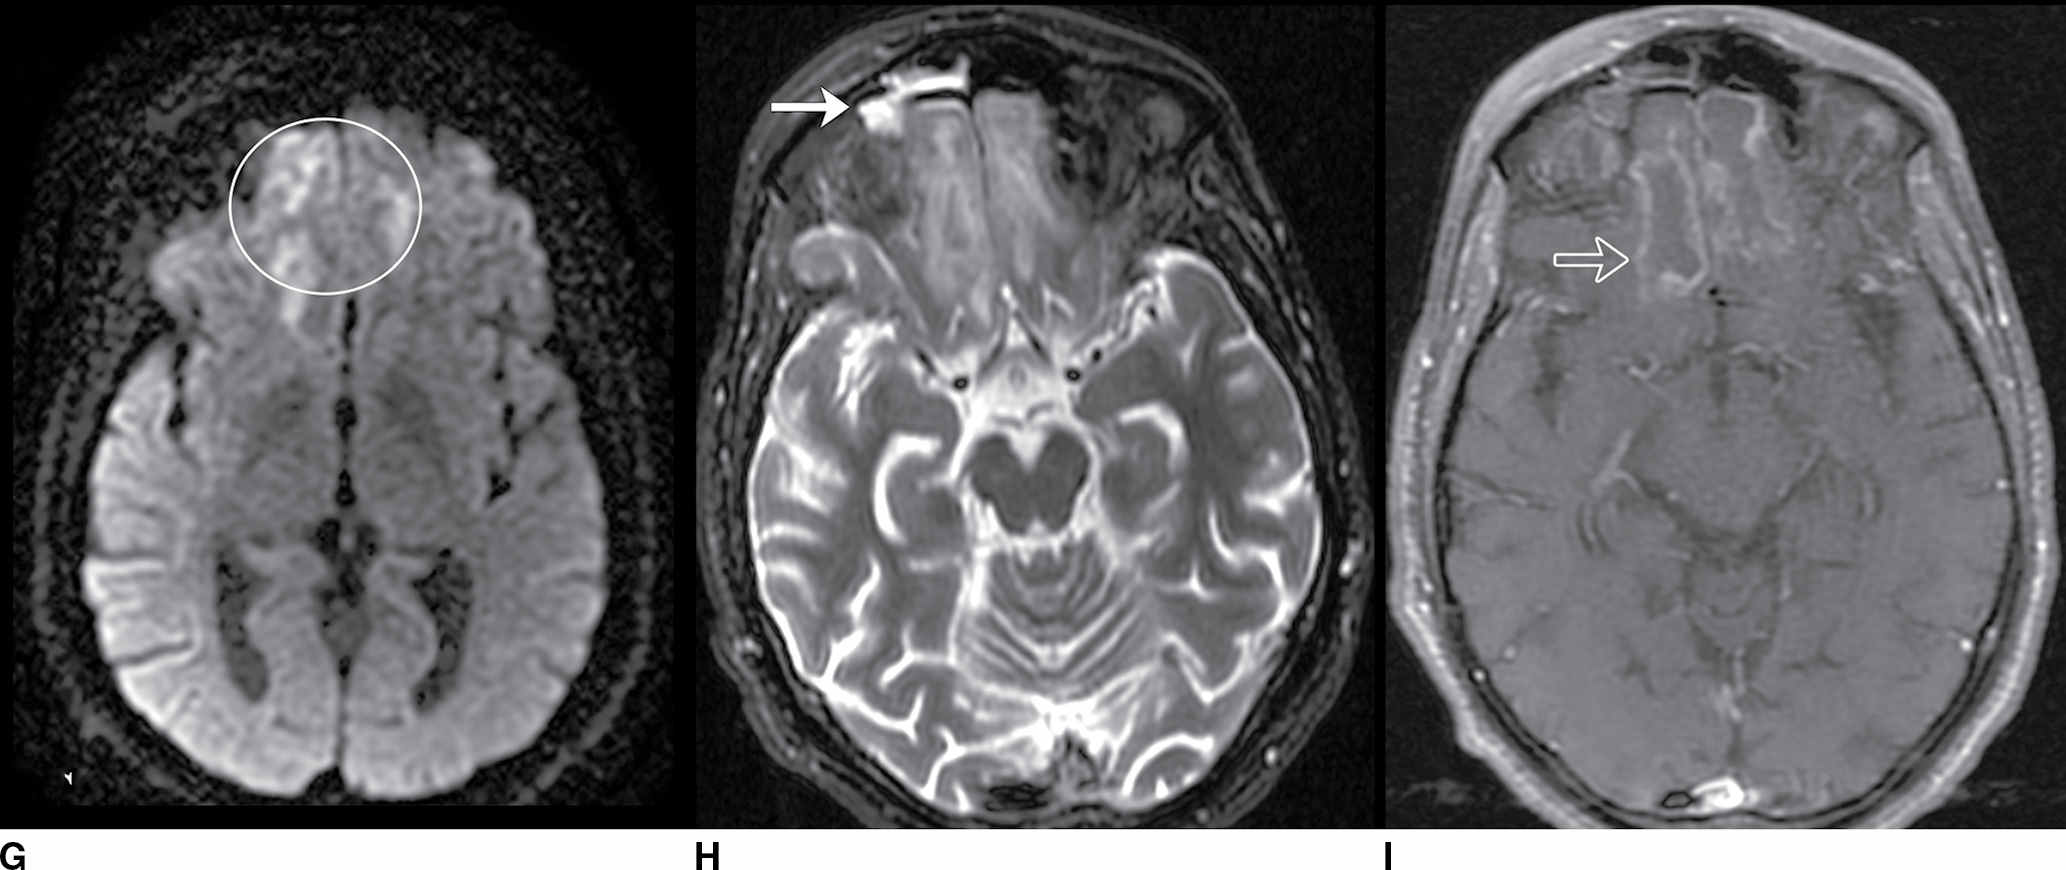
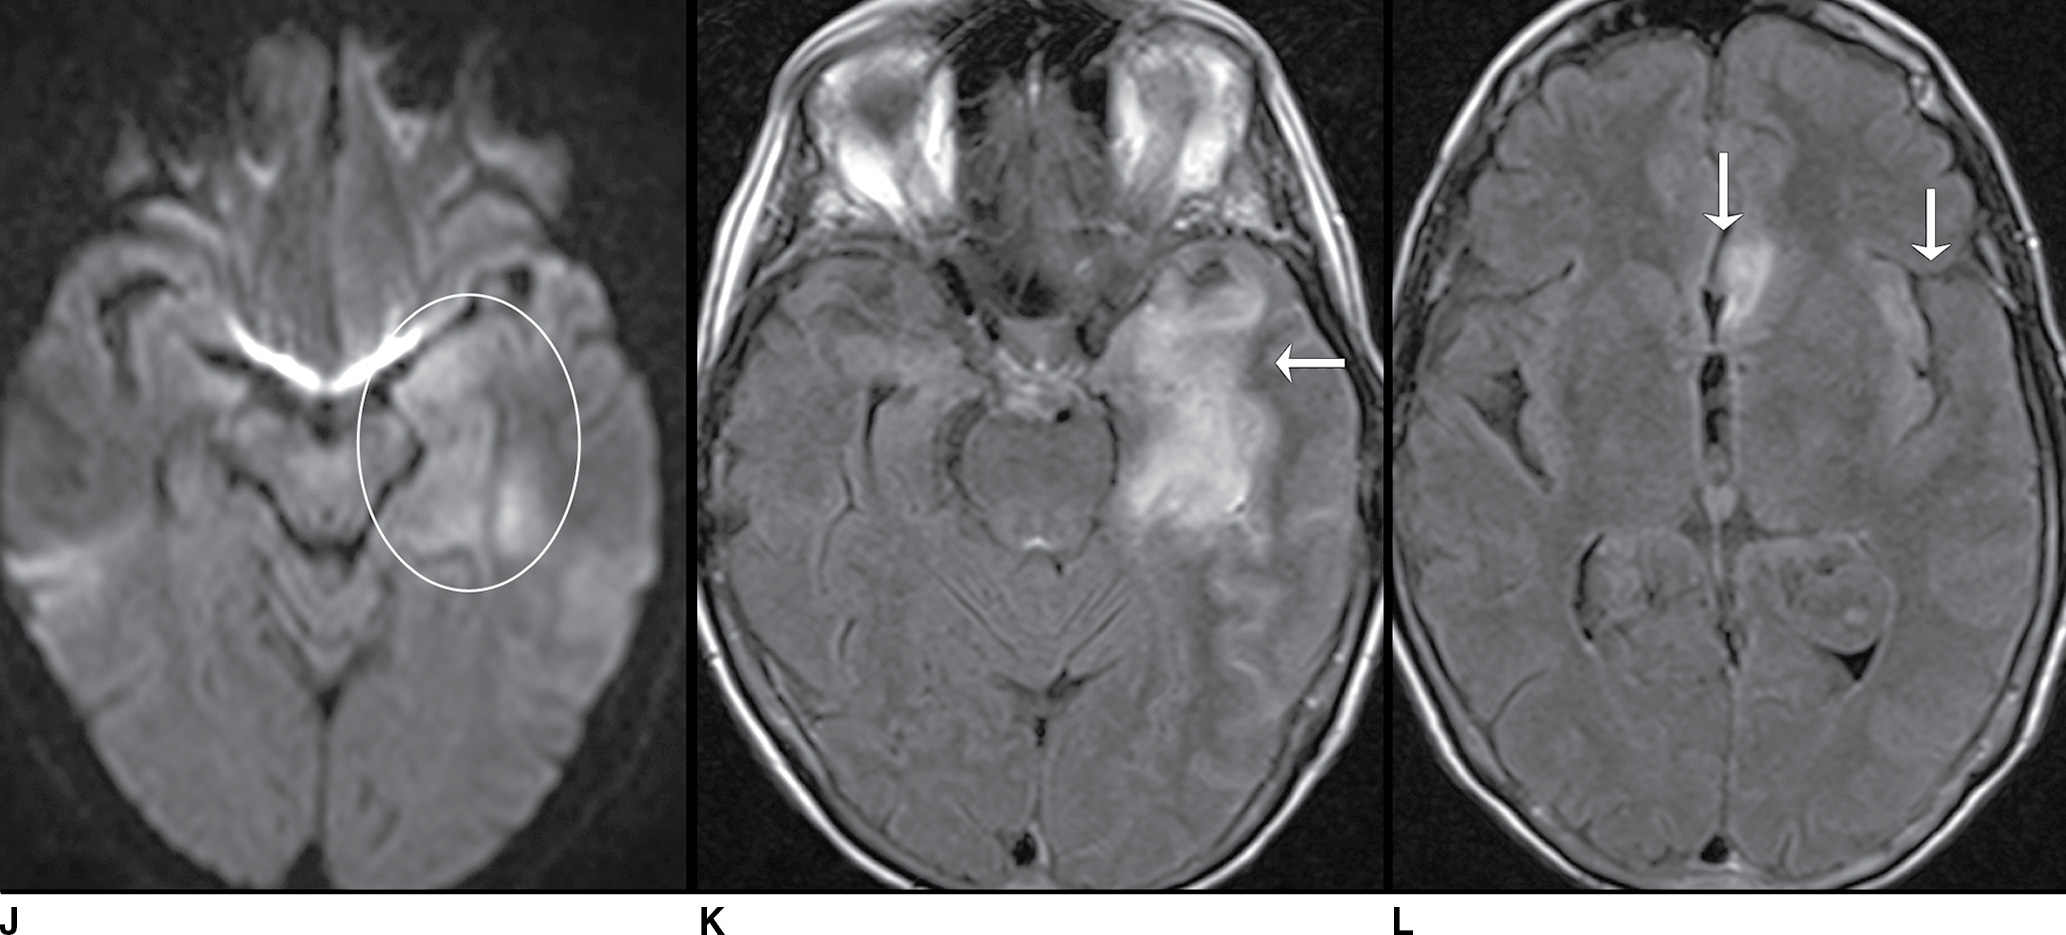
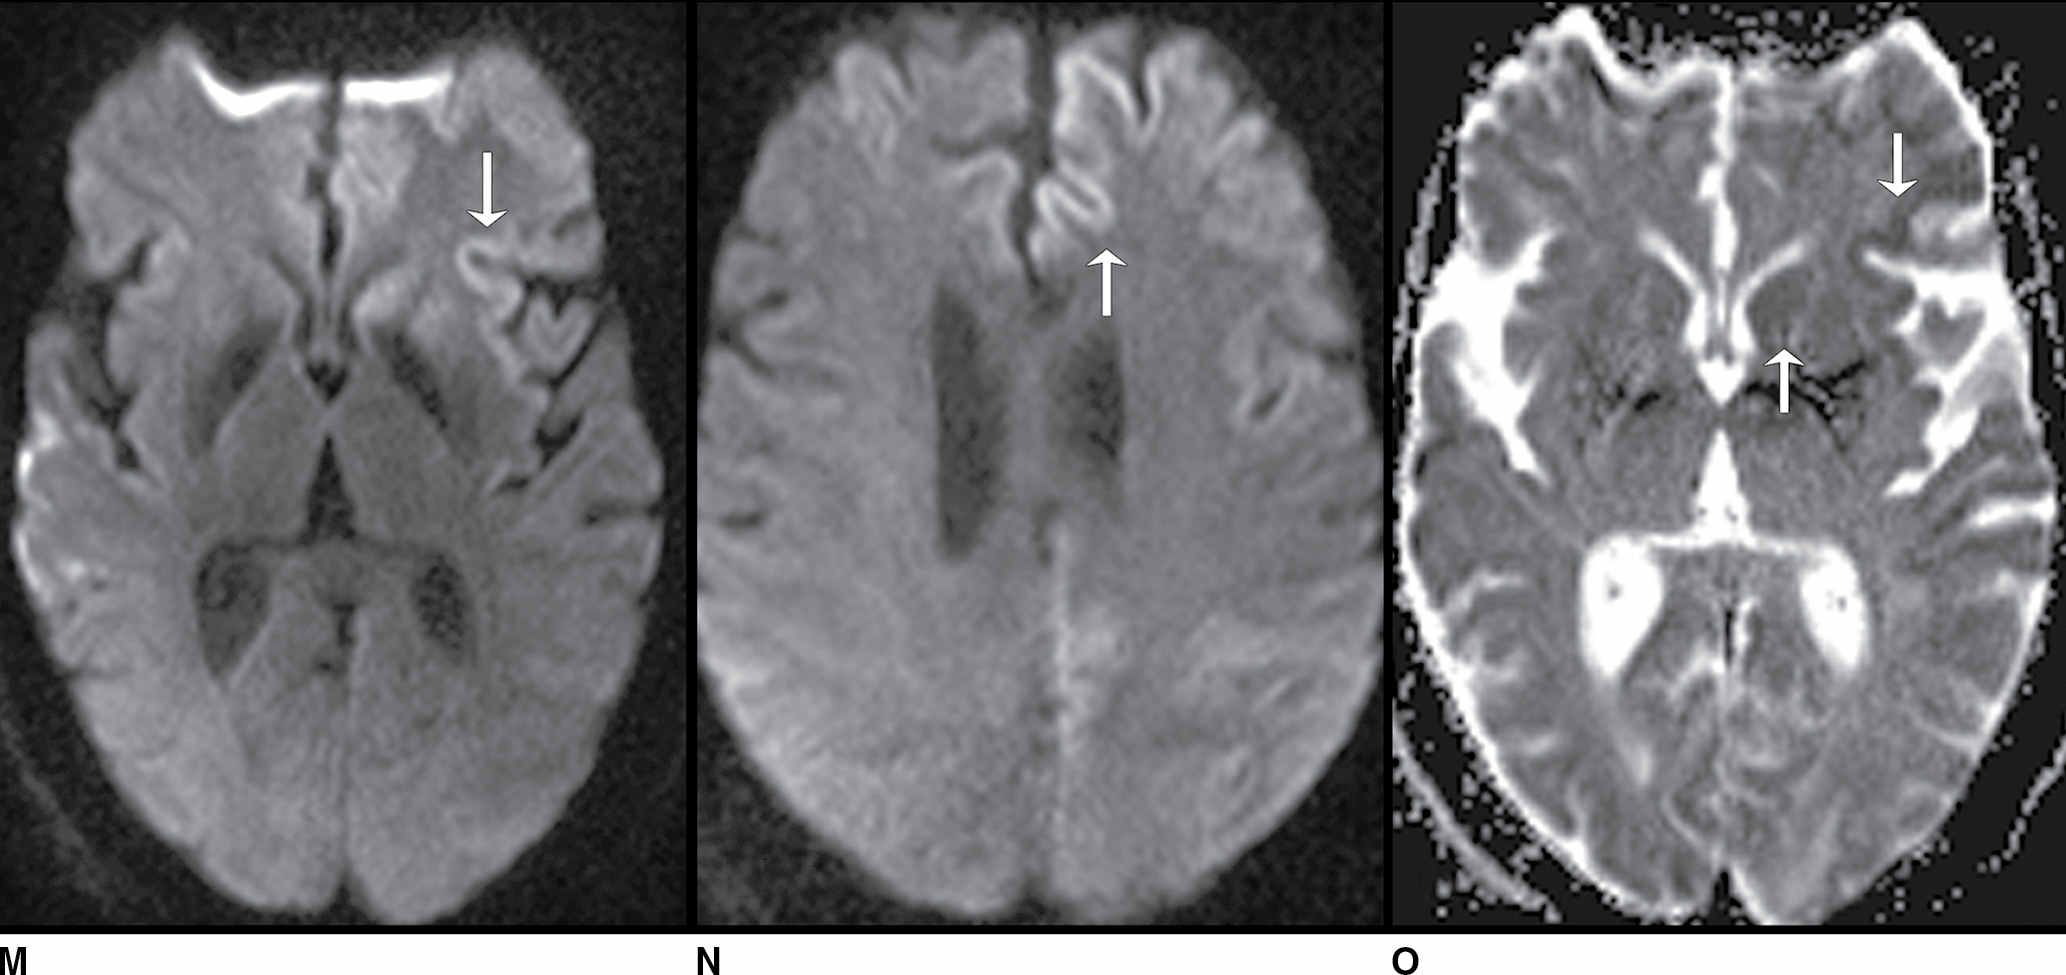
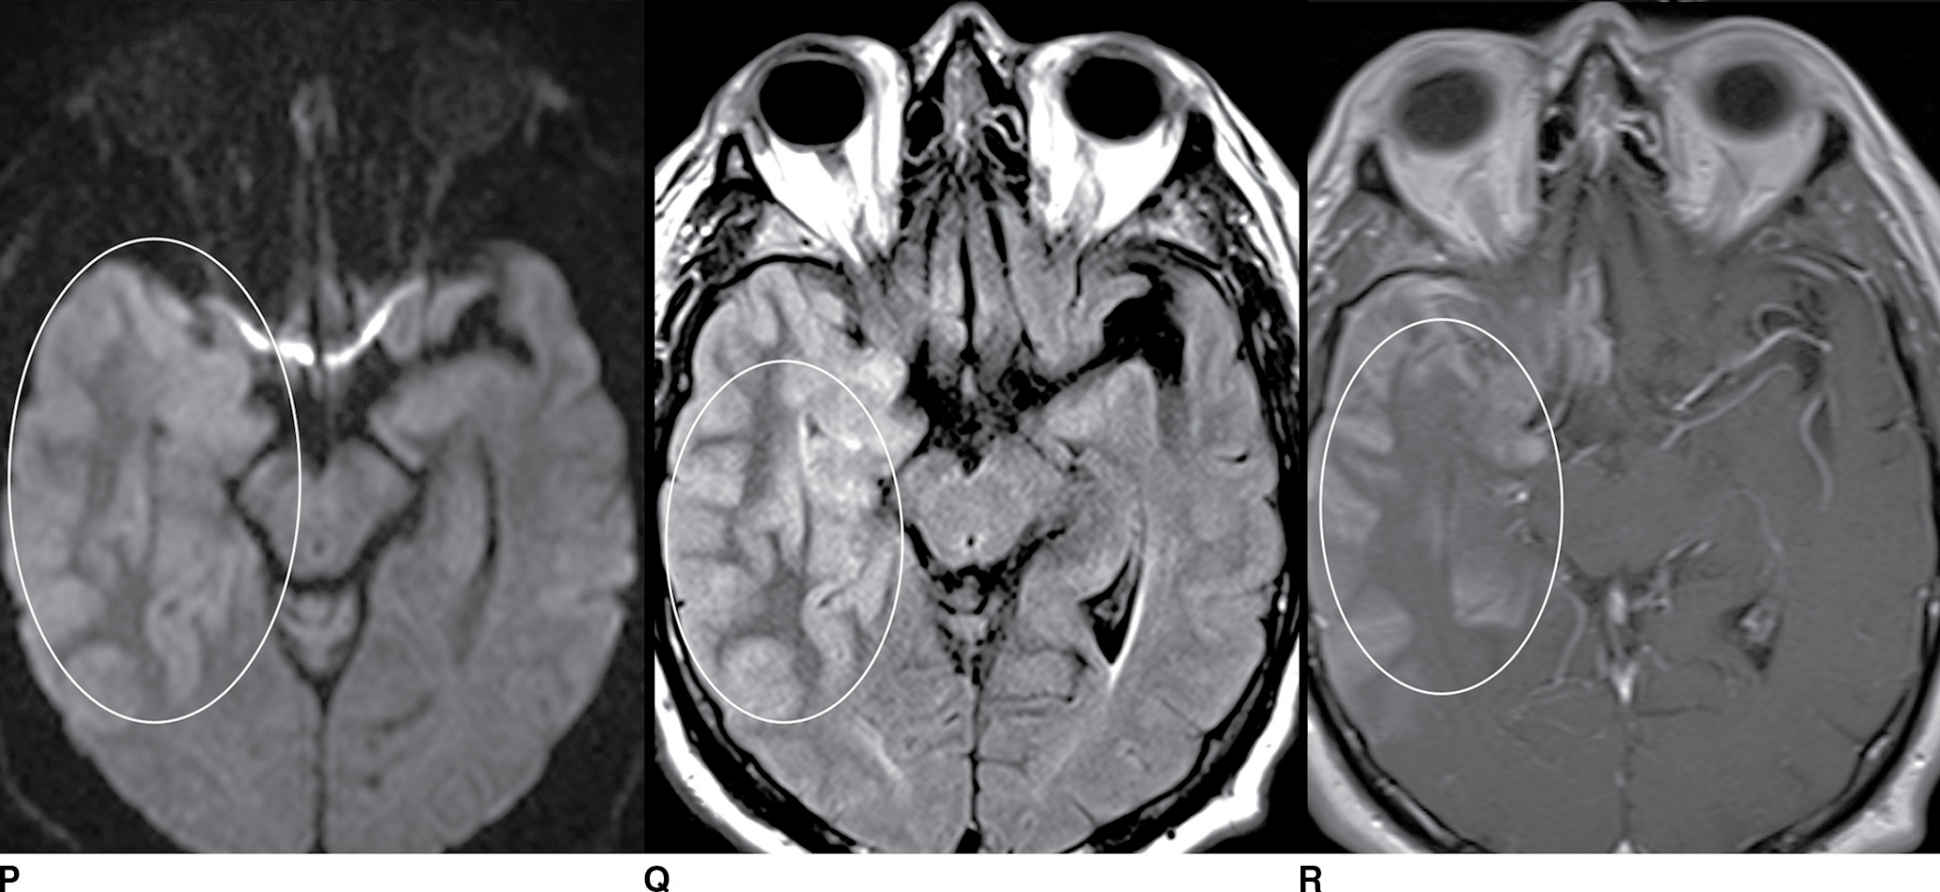
FIG. 9.1 Mimics of acute ischemia/infarction. A–C: Venous thrombosis with venous ischemia. A: Diffusion-weighted image demonstrates diffusion restriction in the bilateral thalami (arrows), which is hyperintense on FLAIR (B). C: Gradient-echo image demonstrates thrombosis of the internal cerebral veins bilaterally (circle). Although the venous thrombosis is directly visualized on this scan, other findings suggesting venous ischemia include the symmetric bilateral distribution, which is characteristic of deep cerebral venous thrombosis. D–F: Lymphoma. These images demonstrate a mass with diffusion restriction (oval in D), low signal on T2 (oval in E), and hyperdensity on CT (oval in F). All of these findings suggest a hypercellular mass such as lymphoma. The amount of surrounding edema, mass effect, and spread across the midline would be unusual in the setting of acute ischemia. G–I: Cerebritis. G: Diffusion-weighted image demonstrates restricted diffusion (circle). H: Corresponding T2 image demonstrates fluid in the adjacent frontal sinus (arrow) with hyperintense T2 signal in the adjacent frontal cortex and adjacent white matter. I: Postcontrast image demonstrates peripheral enhancement suggestive of cerebritis with early abscess formation. Enhancement in the setting of ischemia typically develops in the subacute phase and is generally not present in the setting of diffusion restriction. J–L: Herpes encephalitis. J: Diffusion-weighted image demonstrates diffusion restriction in the mesial temporal lobe (oval), which could be seen in the setting of ischemia in the anterior choroidal artery distribution. K,L: Increased FLAIR signal (arrows) involves additional vascular territories, which mitigates against an ischemic etiology, the distribution in the limbic system seen in this case is typical of herpes encephalitis. M–O: Creutzfeldt-Jakob disease (CJD). Diffusion-weighted images (M,N) and ADC map (O) in this patient with a rapidly progressive dementia demonstrate diffusion restriction involving the cortex and basal ganglia (arrows). Although a hypoxic ischemic injury could appear similar, the imaging findings along with the clinical presentation were characteristic for CJD. P–R: Seizure effect. P: Diffusion-weighted image demonstrates diffusion restriction in the right temporal lobe (oval) in a nonvascular distribution. This corresponds to increased signal on FLAIR (Q) and gyriform enhancement on postcontrast image (R). As discussed above, diffusion restriction and enhancement are generally not seen concurrently in the setting of ischemia. This patient had clinical seizure activity, which correlated with the signal abnormality. Follow-up imaging (not shown) after seizure control demonstrated resolution of the signal abnormality.
Table 9.1 ACUTE ISCHEMIA/INFARCTION
Clinical features
A key clinical feature to help with the differential diagnosis of diffusion restriction is time of ictal onset and the acuity of clinical findings. A large arterial infarction typically presents with acute neurologic defects, whereas a venous infarction characteristically has a more prolonged clinical course with a prodrome of headache and/or seizures (2). The clinical presentation is typically more prolonged and progressive in the setting of intracranial infection. Patients with infection may also have risk factors such as endocarditis, paranasal sinus disease, or congenital heart disease (3).
Mimics
A venous infarction can lead to cytotoxic edema and diffusion restriction simulating arterial ischemia. Keys to this diagnosis include a nonarterial distribution of imaging findings and the presence of an adjacent thrombosis. Venous infarctions often present with hemorrhage, which is less common in the setting of arterial infarctions (2,4).
Neoplasm can result in diffusion restriction on MRI presumably due to increased cellularity. High-grade gliomas and lymphomas are primary considerations with this appearance. One helpful differentiating factor is the presence of a focal mass and enhancement. Acute infarcts can have mass effect, but diffusion restriction typically resolves before the onset of enhancement as seen in subacute infarctions (2).
Cerebritis and abscess formation can show diffusion restriction and may mimic ischemia. Subacute infarction classically results in cortical or “gyriform” enhancement, whereas the enhancement in cerebritis is a less specific pattern and generally involves the underlying white matter. The ring enhancement that is characteristic with abscess formation is also atypical for ischemia (2,3).
Herpes encephalitis can also show diffusion restriction. Differentiating factors typically include a typical location in the medial temporal (and possibly the medial frontal) lobes, a more prolonged clinical presentation than acute infarction, and laboratory evidence of this infection (3,4).
Sporadic Creutzfeldt-Jakob disease (CJD) typically produces diffusion restriction in the basal ganglia and cortex. While ischemia can produce similar findings, CJD may have a characteristic imaging appearance with a more prolonged onset of clinical findings (2,3).
Multiple sclerosis (MS) plaques may show diffusion restriction; however, the majority of MS lesions demonstrate elevated ADC values (2). These patients typically also have other imaging and clinical features of MS with a history of intermittent symptoms (2).
Seizures can also result in diffusion restriction. Unlike ischemia, the abnormality tends to be at least partially reversible (5). The diffusion restriction is typically unilateral and may involve an entire hemisphere or lobe and is characteristically not confined to a particular vascular territory (4).
Management
Correlation with vascular imaging is often helpful, particularly if arterial occlusion or a hemodynamically significant stenosis is identified (2). Dedicated CT or MR venography may be diagnostic in the setting of venous infarction. A suspected neoplasm with diffusion restriction could perhaps be further evaluated with advanced neuroimaging such as MR perfusion or spectroscopy. Suspected infectious meningitis should usually be correlated with CSF assessment unless clinically contraindicated (3).
Take-home points
- Acute ischemia can perhaps be differentiated from other causes of diffusion restriction based upon the clinical presentation and its short-term evolution pattern on the ADC images.
- With a nonvascular distribution of diffusion restriction or an atypical clinical presentation, other causes of diffusion restriction should be suspected.
Nonenhancing Neoplasm
Imaging features
The neoplasms that may present as a nonenhancing mass include low-grade gliomas such as diffuse astrocytoma and oligodendroglioma and high-grade gliomas such as anaplastic astrocytoma and gliomatosis cerebri. The lack of contrast enhancement does not exclude an aggressive neoplasm (Fig. 9.2; Table 9.2).
FIG. 9.2 Nonenhancing neoplasm– anaplastic astrocytoma. A: T1 precontrast image demonstrates a hypointense space-occupying mass centered in the insula and subinsular white matter (arrow). B: T1 postcontrast image demonstrates no significant enhancement (arrow). T2 fat-saturated image (C) demonstrates the extent of the lesion, which is even more conspicuous on FLAIR (D). The primary differential considerations here would include ischemia (which could be excluded with comparison to diffusion-weighted images) and cerebritis (which typically enhances).
Table 9.2 NONENHANCING MASS
Low-grade diffuse astrocytomas are typically well marginated on imaging with little or no surrounding edema, enhancement, or mass effect. Because of potential imaging overlap with higher-grade astrocytomas, advanced neuroimaging techniques are often employed. ADC values are typically lower in higher-grade neoplasms owing to their relatively increased cellularity. MR spectroscopy may demonstrate an increased Cho–NAA ratio in higher-grade gliomas, presumably due to increased cell turnover. MR perfusion imaging may also be helpful in the grading of gliomas with typically increased rCBV in higher-grade neoplasm due to increased tumor vascularity. Although these advanced neuroimaging techniques increase the specificity of the radiologic diagnosis, heterogeneity of tumor histology and overlap of imaging findings make a precise diagnosis difficult without biopsy (6–8).
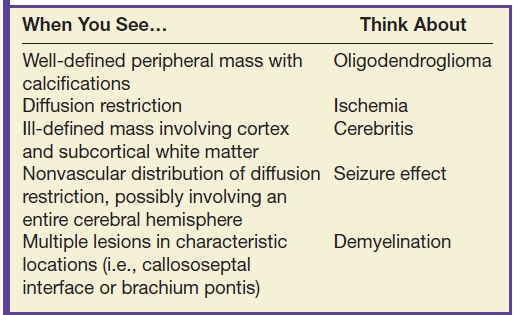
Oligodendrogliomas may also present as a nonenhancing mass. These tumors typically involve the cortex or subcortical white matter, present with seizures, and frequently calcify (20% to 91%) (9). The presence of calcification helps to differentiate this neoplasm from astrocytomas as these latter tumors rarely calcify.
Gliomatosis cerebri characteristically presents as extensive (involving two or more lobes of the brain) areas of high T2 signal and low attenuation on CT with relative preservation of the underlying brain architecture. Enhancement is not commonly seen.
Clinical features
One of the most helpful clinical features is time of onset. Neoplasms generally have an insidious course or are detected incidentally, whereas its primary mimics typically present acutely. Infectious etiologies generally have a more rapid presentation; in particular, infection should be suspected in a patient with fever and an elevated white blood cell count (3).
As mentioned above, seizures are a common clinical presentation of oligodendrogliomas due to supratentorial cortical involvement. However, this is not a specific presentation as other neoplasms and nonneoplastic etiologies may also produce seizures. Additional presentations of intracranial masses are generally related to mass effect and include focal neurologic deficits, headache, mental status change, nausea, and papilledema.
Mimics
Several processes may produce an intracranial lesion with associated mass effect mimicking a nonenhancing neoplasm including ischemia, infection/inflammation, and seizures.
In the acute phase, cerebral ischemia results in local edema and can simulate a neoplasm. Helpful differentiating factors include diffusion restriction and a vascular distribution. Vascular imaging with MRA or CTA may demonstrate vessel occlusion as the etiology.
Cerebritis may simulate a neoplasm. Early cerebritis is characteristically seen as an area of poorly defined low attenuation on CT. On MRI, there is typically ill-defined T2 hyperintensity, which is iso- to hypointense on T1. As discussed above, herpes encephalitis classically presents with increased T2 signal and expansion, which may simulate a glioma (3).
Seizures can result in brain parenchymal changes on MRI that may mimic an intracranial tumor. Typical findings include a suitable clinical history, cortical edema, swelling, and increased T2 signal, and this may mimic neoplasia (10). A differentiating feature of seizure-induced parenchymal changes is that they are generally at least partially reversible (5).
Demyelinating lesions may also present as a nonenhancing brain mass and may mimic tumor (so-called tumefactive demyelinating lesions); however, enhancement is typically seen in the acute phase when mass effect is also present (11). Multiple lesions are frequently seen in the setting of MS and are a helpful differentiating factor.
Management
If a nonneoplastic etiology is suspected, advanced MRI techniques may be helpful as discussed above. Short-term follow-up may also be helpful if the diagnosis is uncertain with more rapid evolution of the imaging changes being more typical for nonneoplastic disease. If the diagnosis remains uncertain and concerning, a biopsy may be indicated.
Take-home points
- An intracranial mass is not necessarily a neoplasm, and a neoplasm is not necessarily a malignant tumor.
- Although clinical history and imaging findings often narrow the differential diagnosis, the imaging features often overlap.
Subarachnoid Hemorrhage on CT
Imaging features
In the acute setting, subarachnoid hemorrhage (SAH) is characteristically seen as hyperdensity in the sulci and cisterns. Noncontrast head CT is reportedly 100% sensitive in the first 12 hours and 93% sensitive 24 hours after SAH (12). Decreased sensitivity of CT for acute SAH over time is noted. Associated intraparenchymal hemorrhage (IPH), intraventricular hemorrhage (IVH), and hydrocephalus may also be seen (12) (Fig. 9.3; Table 9.3).
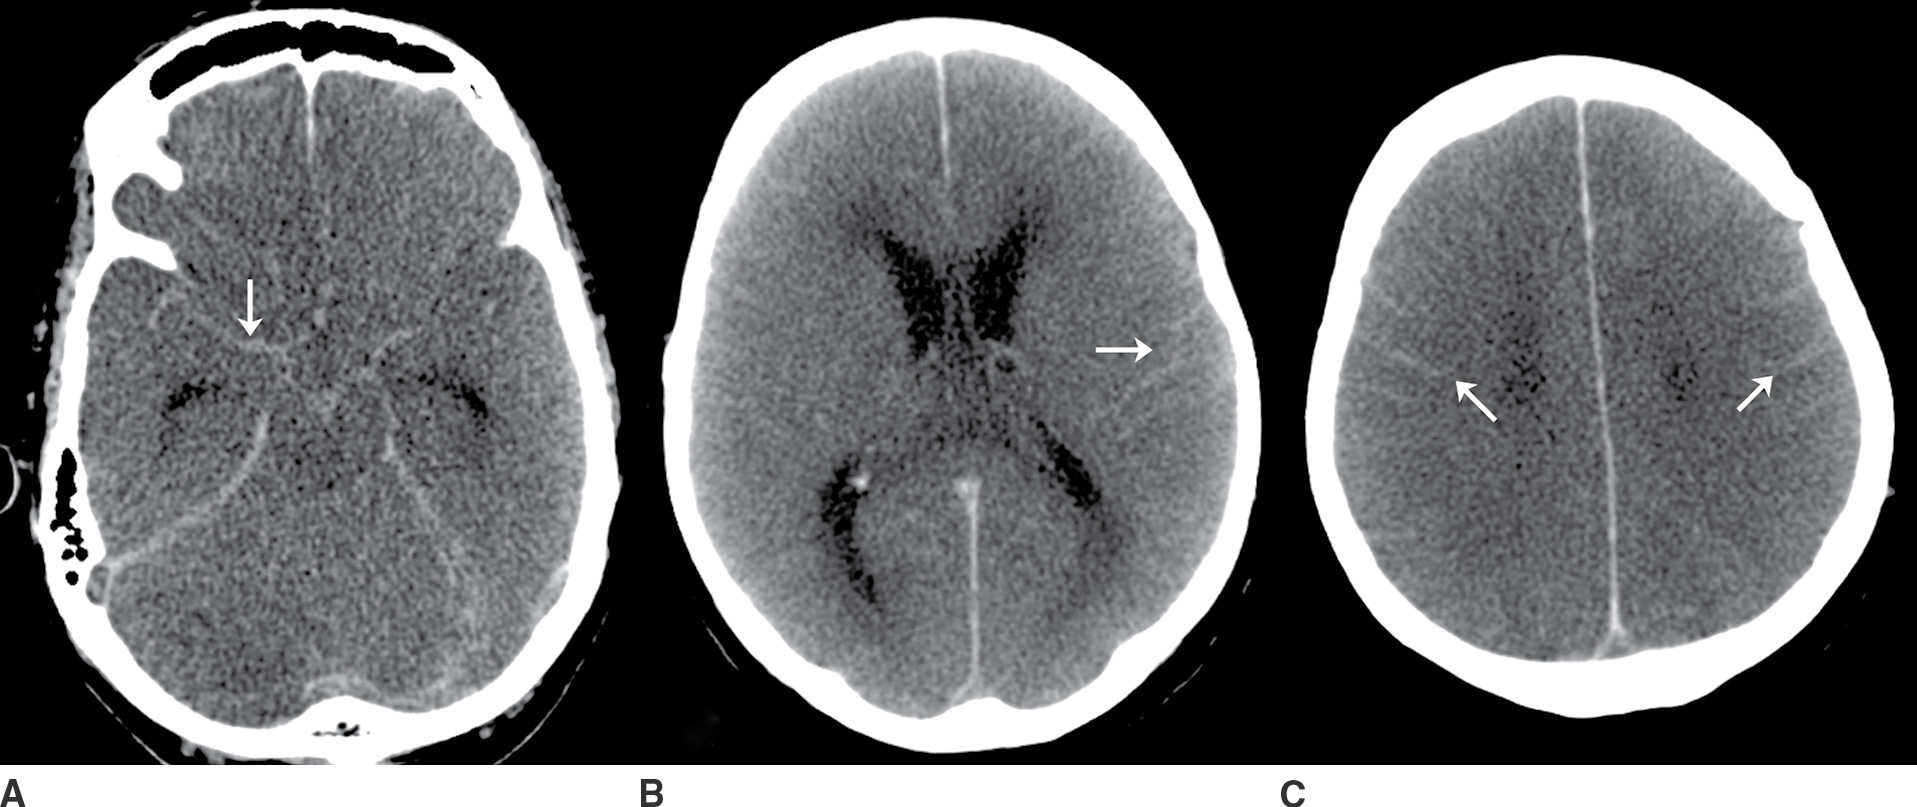
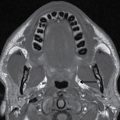
FIG. 9.3“Pseudo-SAH”. Selected noncontrast CT images (A–C) demonstrate sulcal hyperdensity (arrows) which can be confused with subarachnoid hemorrhage. Close inspection reveals diffuse lose of grey-white differentiation and sulcal/basal cistern effacement. This is an example of “pseudo-SAH” after profound hypoxic ischemic injury. An additional diagnostic consideration in this imaging pattern would be meningitis with sulcal high attenuation due to exudate. If clinically appropriate, a lumbar puncture may be indicated in this setting. (Case courtesy of Dr. Raymond Higginbotham.)
Table 9.3 SUBARACHNOID HEMORRHAGE ON CT
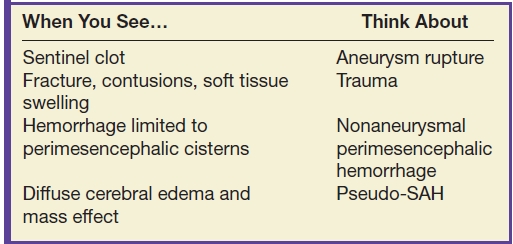
Aneurysmal SAH accounts for approximately 85% of nontraumatic SAH (13). The distribution of the SAH may suggest aneurysm rupture, and the largest concentration of blood or a sentinel clot can possibly be seen near the site of rupture.
Clinical features
SAH is characterized clinically by sudden onset of a severe headache. Nausea, vomiting, photophobia, and altered consciousness can also be seen. Potential focal neurologic findings include third nerve palsy in the setting of posterior communicating artery aneurysm and sixth nerve palsy due to increased intracranial pressure (12,13).
Mimics
Nonaneurysmal SAH can be seen in the setting of neoplasm, recent surgery, trauma, and vascular malformations. A traumatic etiology of SAH may be suspected based on history, superficial location of the SAH along the convexity sulci, or associated findings such as skull fracture or cortical contusion. Perimesencephalic hemorrhage represents approximately 10% of SAH with a distribution that is typically limited to the perimesencephalic cisterns (13). The distribution of hemorrhage is not entirely specific, however, as 3% to 9% of these patients are diagnosed with an aneurysm on angiography (14). Other uncommon etiologies make up the remaining 5% of nontraumatic SAH and include vasculitis, dissection, arteriovenous malformation (AVM), and neoplasm (13,14).
“Pseudo-SAH” can be seen in the setting of diffuse cerebral edema with increased density in the subarachnoid spaces on CT simulating hemorrhage. This is thought to be caused by narrowed subarachnoid spaces, displaced CSF, and engorgement of the pial venous structures due to increased intracranial pressure (15). “Pseudo-SAH” can also be seen in the setting of recent intrathecal contrast and in meningitis with proteinaceous exudates resulting in increased density on CT (15).
Management
In suspected aneurysmal SAH, angiography (CT, MR, or digital subtraction) is generally performed. MRI of the brain and spine is also commonly employed in the setting of “angionegative SAH” to evaluate for an occult vascular malformation, tumor, or cavernous malformation. In aneurysmal SAH, patients are closely monitored for herniation syndromes, hydrocephalus, rebleeding, vasospasm, and delayed cerebral ischemia (12).
Take-home points
- Although nontraumatic SAH is most commonly due to aneurysm rupture (12), dissection, neoplasm, vascular malformation, and vasculitis can also present with SAH.
- Imaging is vital in the diagnosis of SAH, identifying the etiology, and monitoring for complications.
Subarachnoid Hemorrhage on MRI
Imaging features
MRI may be employed in the setting of SAH. Blood products typically cause T1 shortening and T2 prolongation leading to hyperintense CSF on FLAIR (16). FLAIR is considered by some to be equivalent or superior to CT in the detection of acute SAH (16). FLAIR is especially helpful when the hemorrhage is obscured by CT artifacts, such as in the posterior fossa (17). T2*-weighted sequences such as gradient echo (GRE) and susceptibility-weighted imaging (SWI) may be even more sensitive than FLAIR in detecting SAH (18). The susceptibility induced by paramagnetic forms of iron results in decreased signal on T2* sequences (18). Spin-echo T1-weighted images are much less sensitive for SAH, 50% for acute SAH in one report (18). Features that support an imaging diagnosis of SAH include sulcal hyperdensity on CT, a history and/or findings of trauma, or the presence of an aneurysm (19) (Fig. 9.4; Table 9.4).
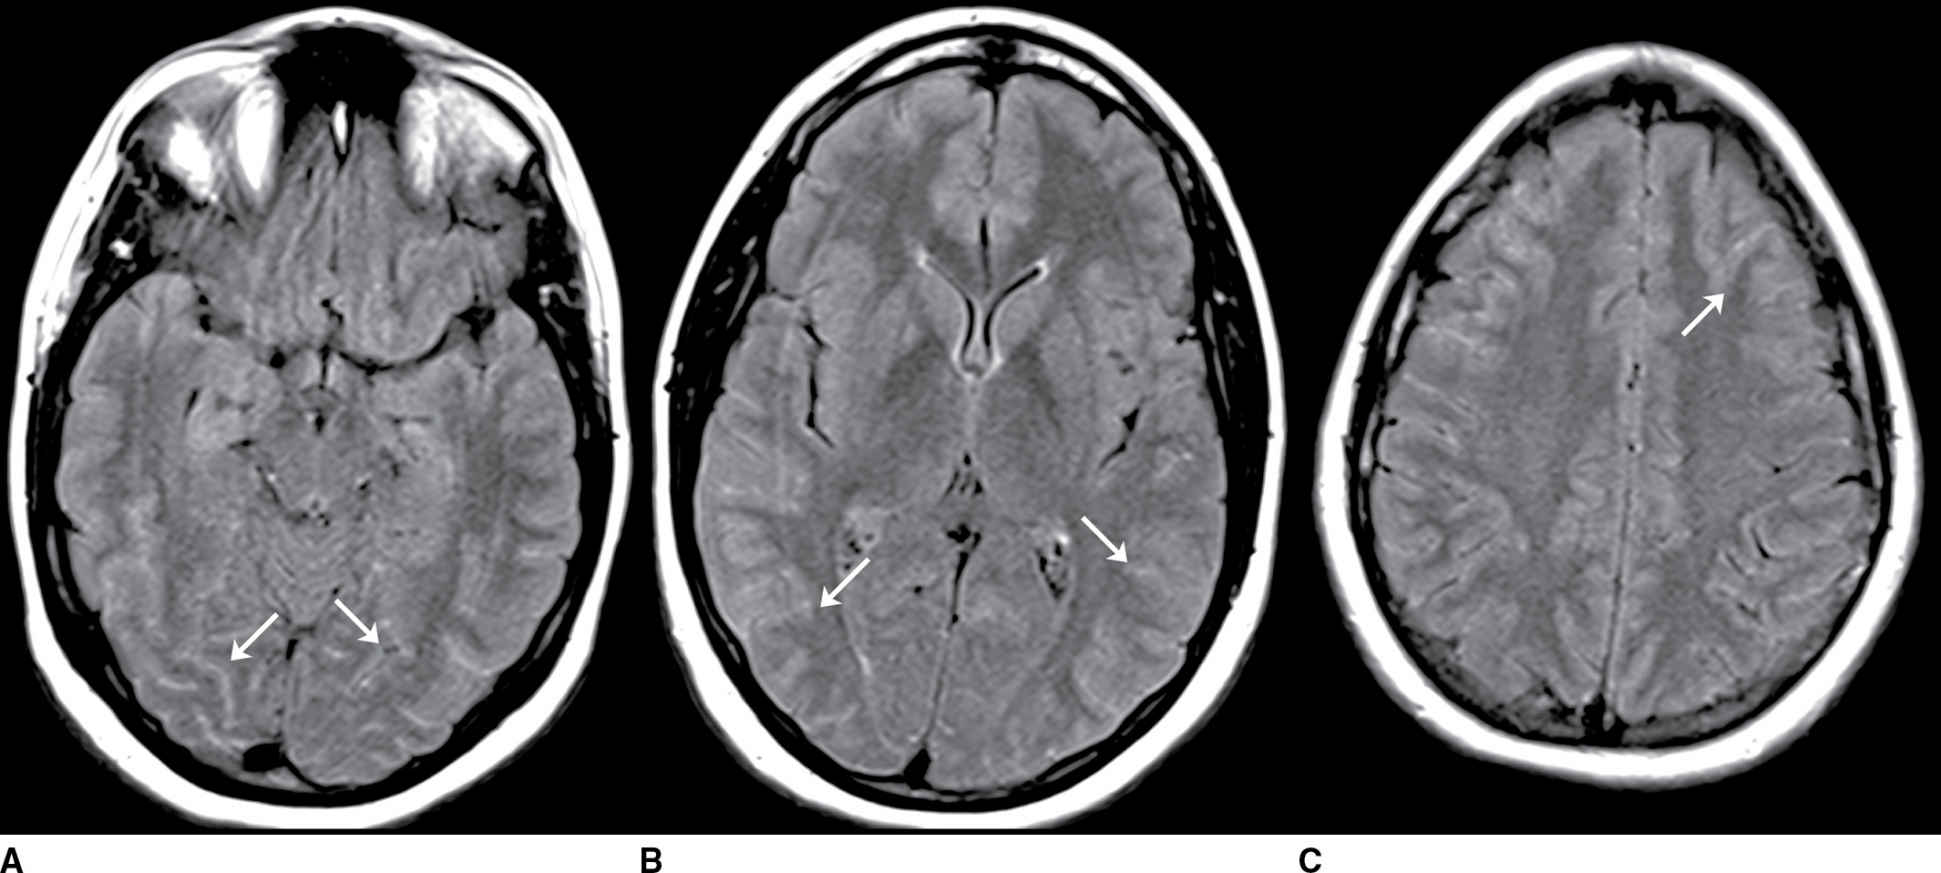
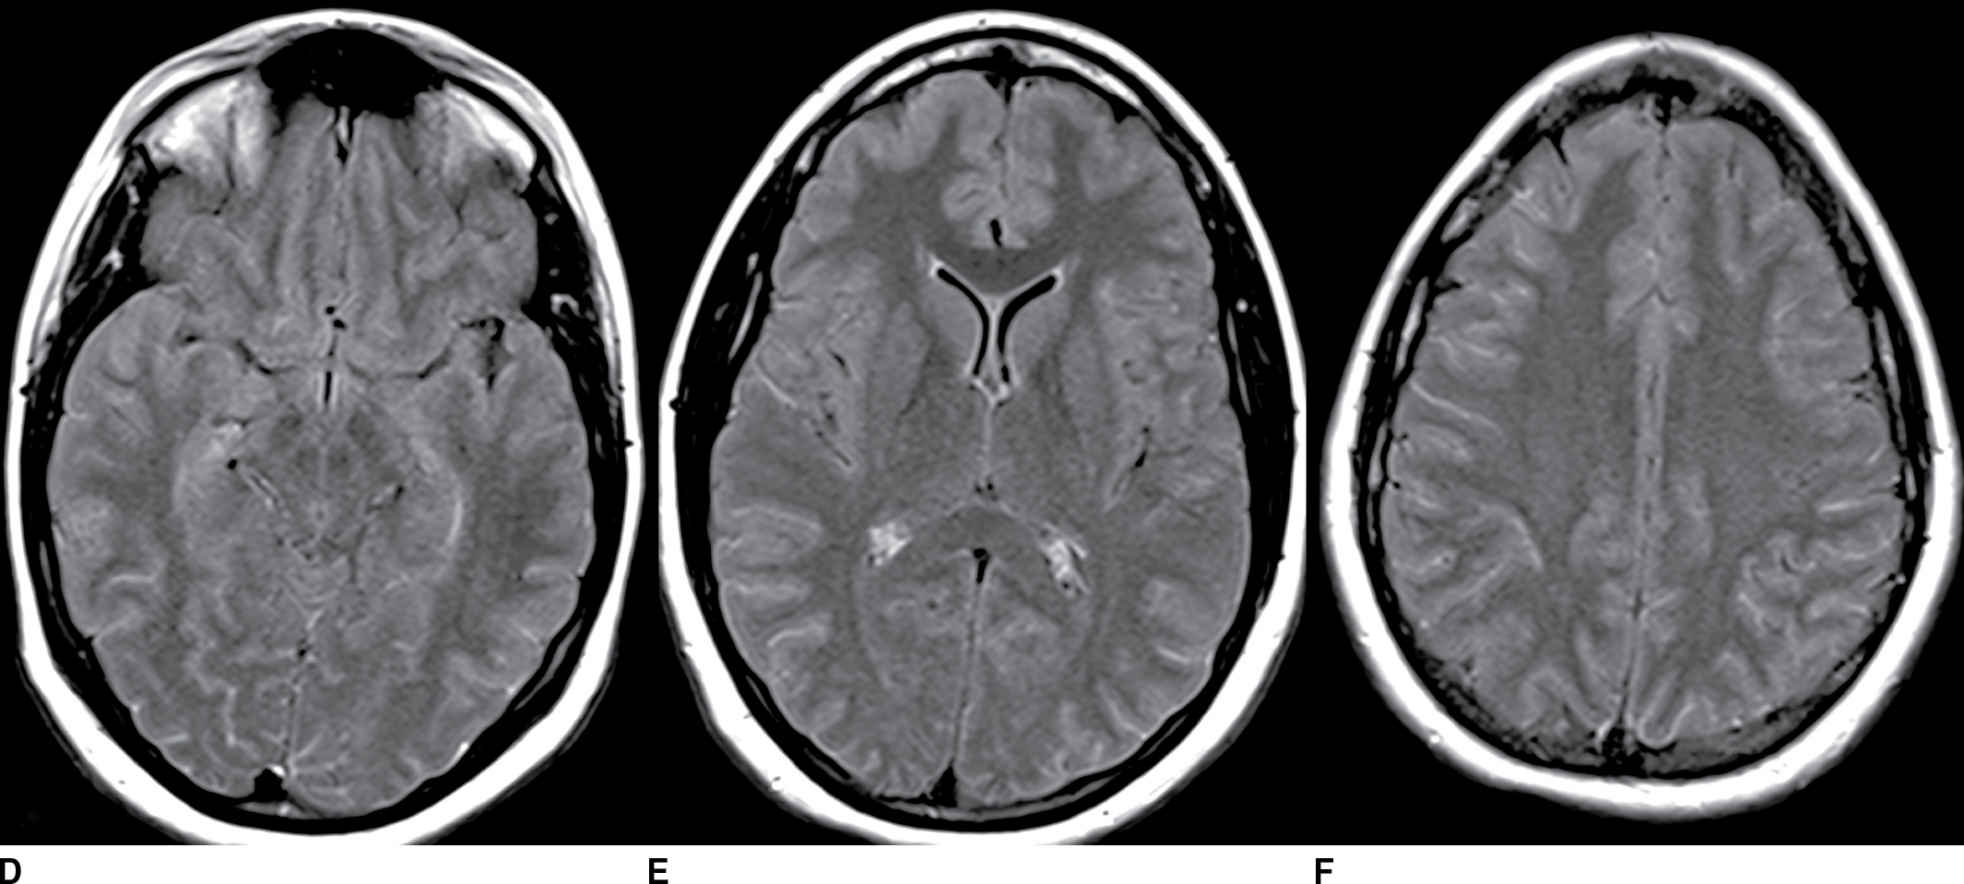
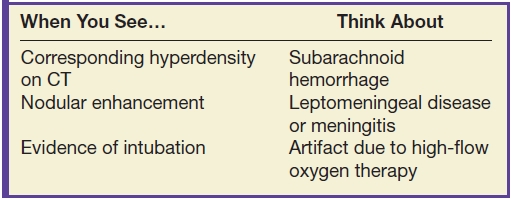
FIG. 9.4 Viral meningitis. A–C: FLAIR precontrast images demonstrate high signal in many of the sulci (arrows). D–F: FLAIR postcontrast images demonstrate slight increased conspicuity of the findings seen above. The differential would include artifact such as high-flow oxygen therapy, which could be confirmed by a discussion with the clinical team. Leptomeningeal carcinomatosis could appear similar but generally demonstrates areas of enhancement on T1-weighted images. SAH could be excluded by comparison to CT or with CSF analysis (if clinically appropriate).
Table 9.4 SUBARACHNOID HEMORRHAGE ON MRI
Clinical features
When nonsuppression of CSF is seen on FLAIR, correlation with the patient’s clinical history can often lead to the correct diagnosis. SAH may be suspected in someone with a sudden onset of severe headache. At this point, correlation with CT or vascular imaging may be diagnostic.
Mimics
Increased FLAIR signal can be seen in the setting of leptomeningeal metastasis and meningitis due to the increased cellularity and protein content of the CSF, respectively. Commonly seen in these conditions is leptomeningeal enhancement on T1 postcontrast images. This enhancement along with the clinical features and CSF analysis (when clinically appropriate) typically enables the diagnosis of meningitis or leptomeningeal carcinomatosis. Contrast-enhanced FLAIR images have been used to increase the sensitivity for meningitis and leptomeningeal carcinomatosis (16).
Several artifacts can result in increased CSF signal on FLAIR and mimic pathology. CSF pulsation artifact results in hyperintensity in the basal cisterns in 40% to 80% of fast FLAIR images (20). Key to this assessment is recognizing that this occurs in a characteristic location and has no corroborating features. Another common mimic is high-flow oxygen therapy, which can result in diffuse increased CSF signal on FLAIR. This can usually be addressed by verification with nursing staff. Incomplete suppression of CSF signal on FLAIR may also result from susceptibility artifact; this is usually recognized with the magnetic susceptibility artifact on additional sequences or metal identified on CT (16,20). Motion artifact can also result in high CSF signal on FLAIR.
Management
In many cases, correlation with additional imaging findings and the clinical history are sufficient to explain CSF nonsuppression on FLAIR. If the signal cannot be explained by a known pathologic process or expected artifact, correlation with lumbar puncture and CSF analysis may be required.
Take-home points
- Artifactual nonsuppression of CSF on FLAIR can be seen with CSF pulsation, high-flow oxygen therapy, susceptibility artifact, and motion.
- Pathologic causes of nonsuppression of CSF signal on FLAIR include SAH, meningitis, and leptomeningeal carcinomatosis.
Hemorrhagic Mass
Imaging features
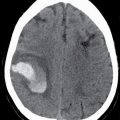
Nontraumatic IPH is most commonly due to chronic hypertension (21). Acute IPH typically presents as a hyperdense intra-axial mass on CT. Common locations of hypertensive hemorrhage include the basal ganglia, internal capsule, thalamus, pons, and cerebellum (21). Additional imaging features that support the diagnosis of hypertensive hemorrhage include evidence of microvascular ischemic change, lacunar infarcts, and remote parenchymal hemorrhage (21) (Fig. 9.5; Table 9.5).
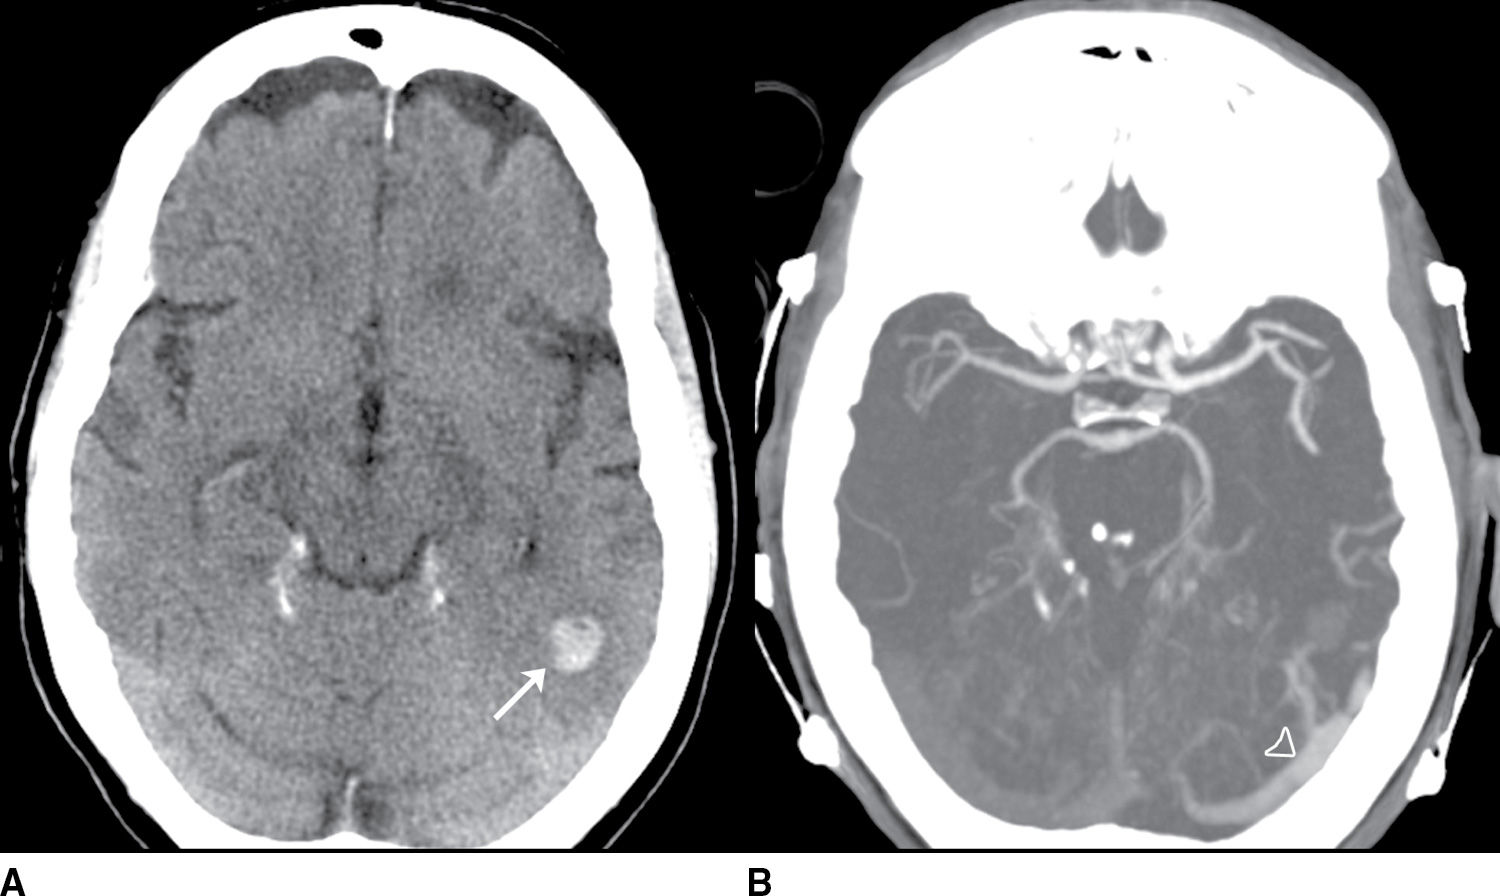
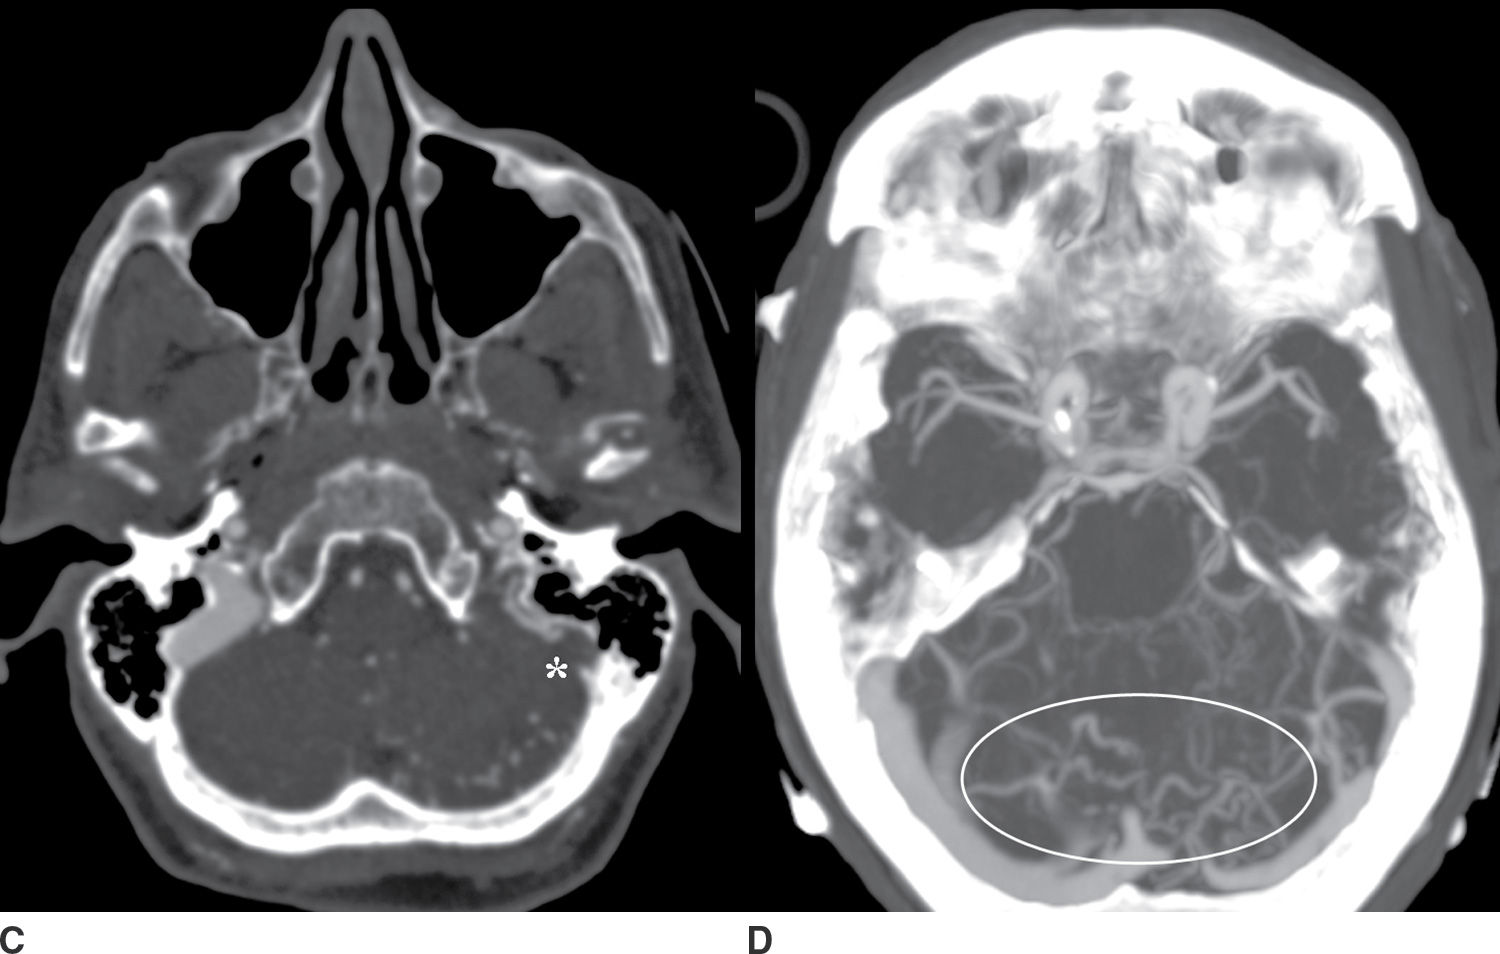
FIG. 9.5 Intraparenchymal hemorrhage. A: Precontrast CT of the head demonstrates a lobar hemorrhage in the left posterior temporal lobe (arrow). This is an atypical location for a hypertensive hemorrhage, and further workup with a CTA/CTV was performed. B: An axial MIP from the CTA demonstrates asymmetric early enhancement of the left transverse sinus (open arrowhead) with a stenosis at the junction of the transverse and sigmoid sinus. C: Source CTV images demonstrate occlusion of the distal sigmoid sinus (asterisk). D: Axial MIP images from the CTV better demonstrate multiple abnormal vessels in the posterior fossa (oval) suggesting an associated dural arteriovenous fistula.
Table 9.5 HEMORRHAGIC MASS
Related posts:
Stay updated, free articles. Join our Telegram channel

Full access? Get Clinical Tree


