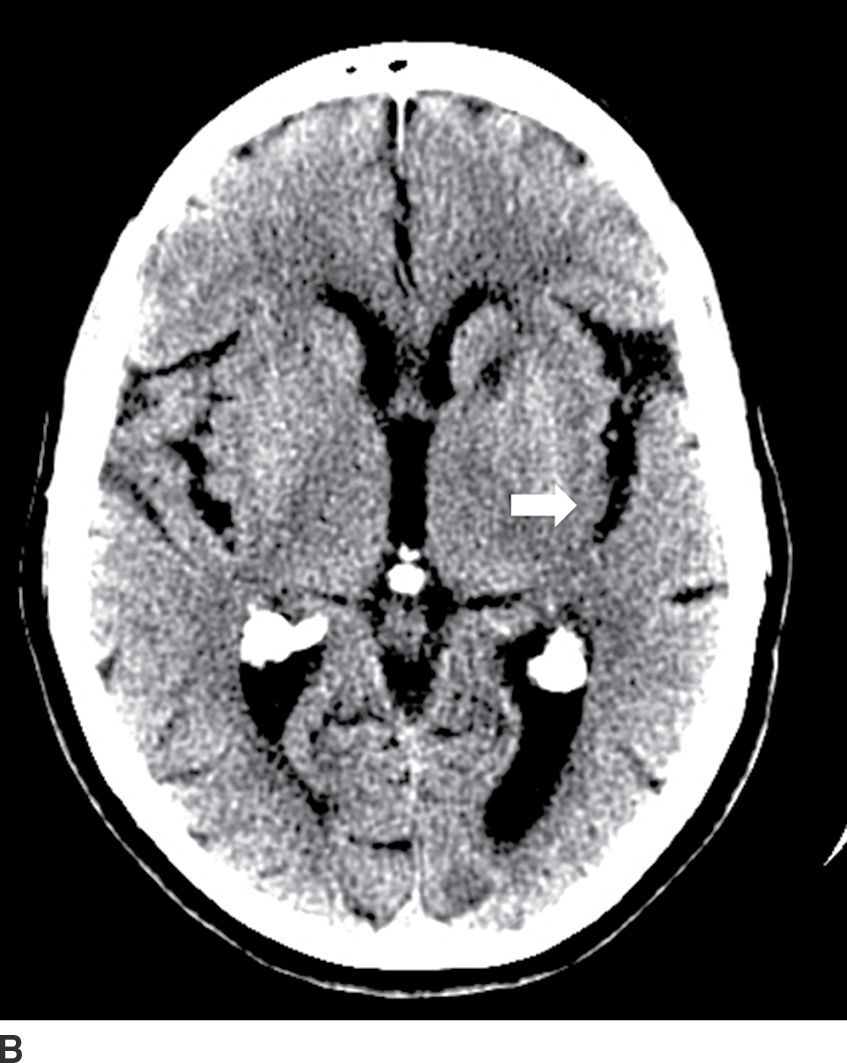
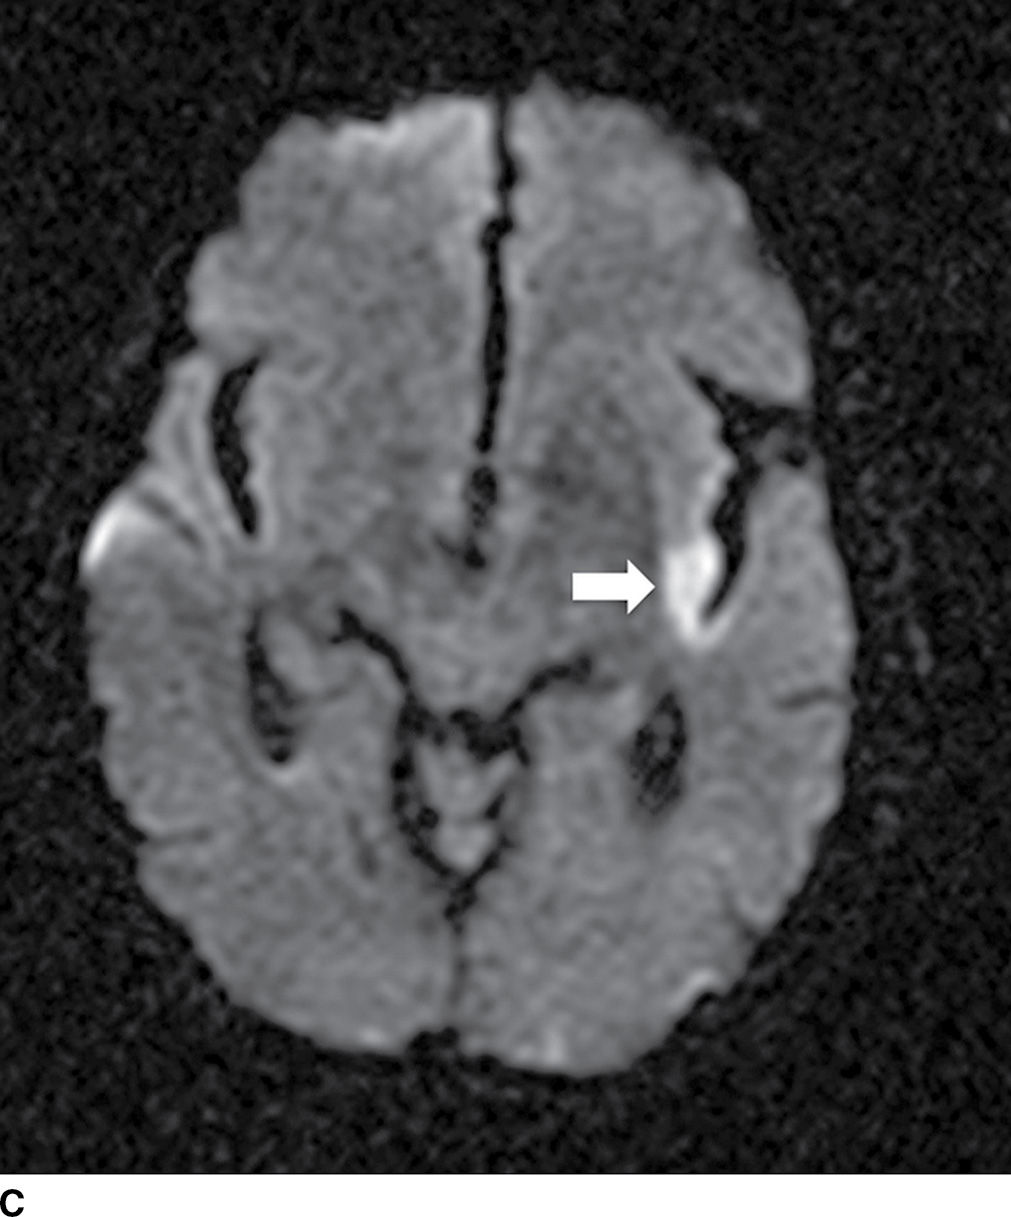
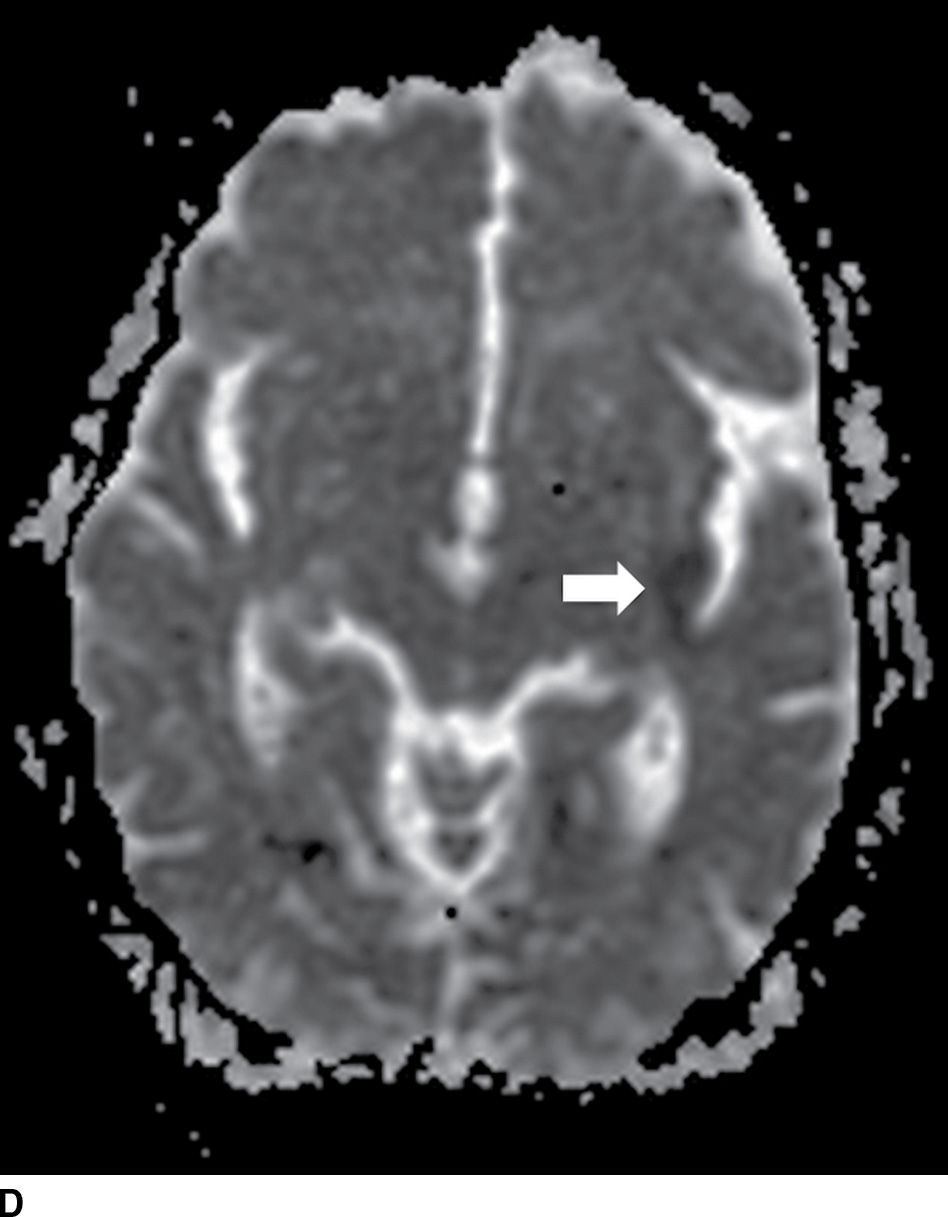
FIG. 5.1 Small early acute stroke. 82-year-old female with 3 hours’ onset of expressive aphasia. A: NCCT with regular brain parenchyma windowing and (B) with narrow windowing (C) axial DWI and (D) correspondent ADC map on same day MR images. Axial CT (E) images through the level of the eyes in the same patient. Note the better depiction of subtle cortical low attenuation in the posterior aspect of the left insula (insular ribbon sign, arrows on A and B) on the narrower window (B) as well as the increased signal on DWI (C) with decreased signal on ADC maps (D) (true restricted diffusion, arrows on C and D). Old infarction is also seen in the anterior limb of the left internal capsule with no restricted diffusion. There is conjugate deviation of the eyes toward the side of the infarct as seen on (E).
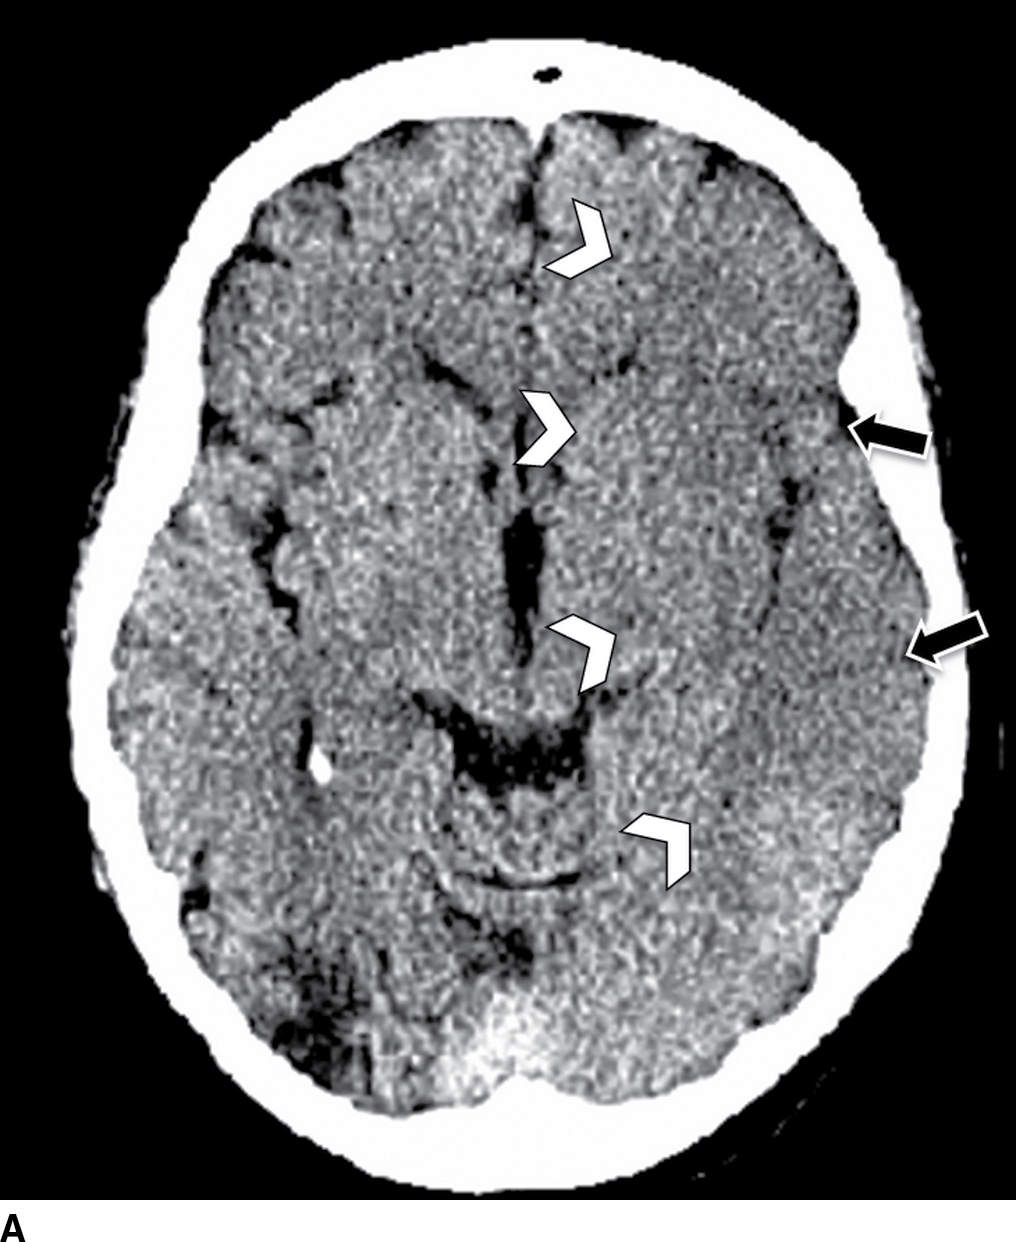
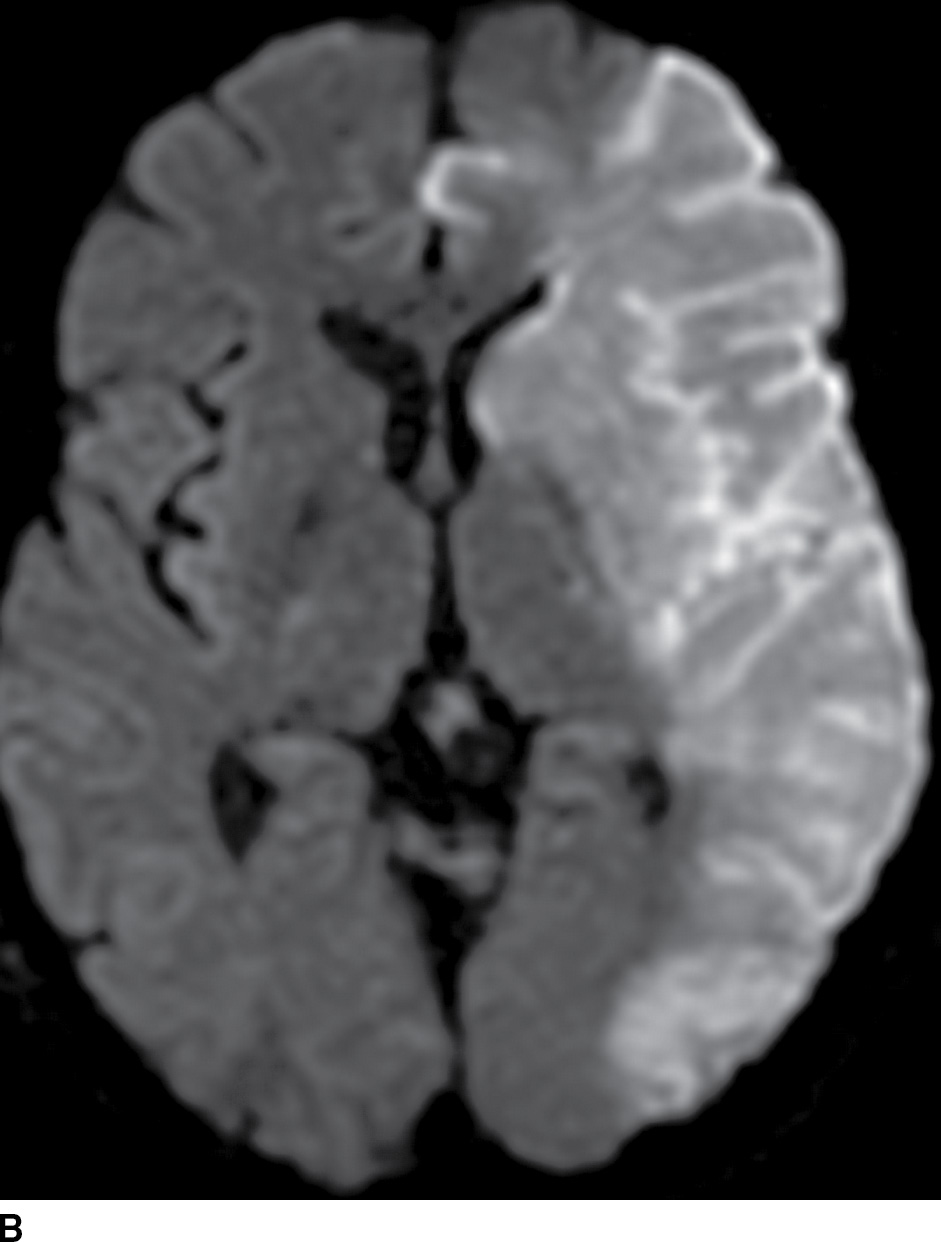
FIG. 5.2 Large acute left MCA infarct.(A) NCCT and (B) axial DWI and (C) ADC maps. Note areas of cortical and subcortical decreased attenuation in the left frontotemporal lobe, including the left caudate head and lentiform nucleus (basal ganglia sign) as well as the insula (white arrowheads). There is also subtle sulcal effacement (black arrows). The extensive acute infarct is seen as areas of true restricted diffusion (B,C). Large infarcts (greater than 1/3 MCA territory), such as in this case, may not be suitable for reperfusion treatment.
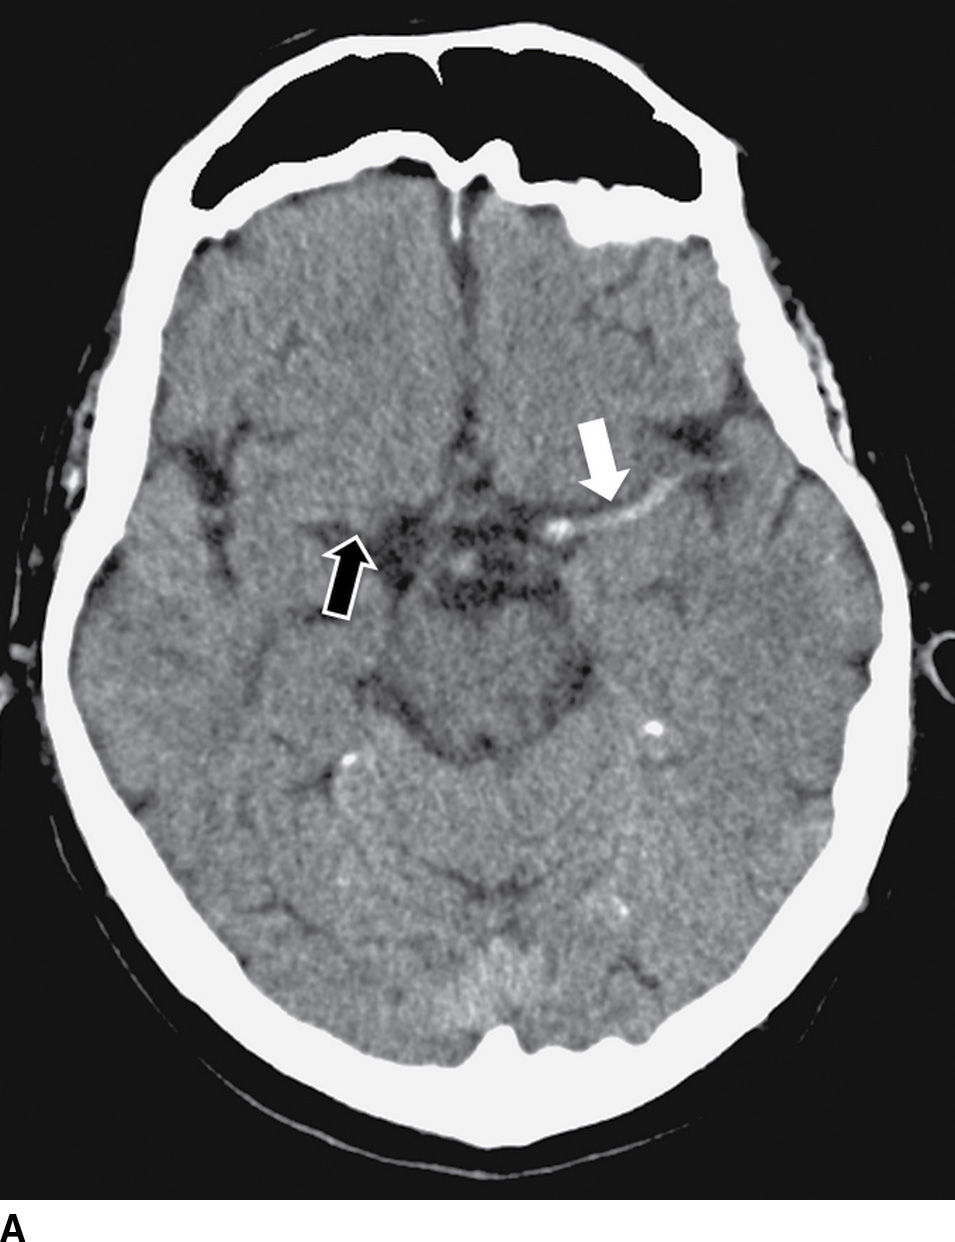
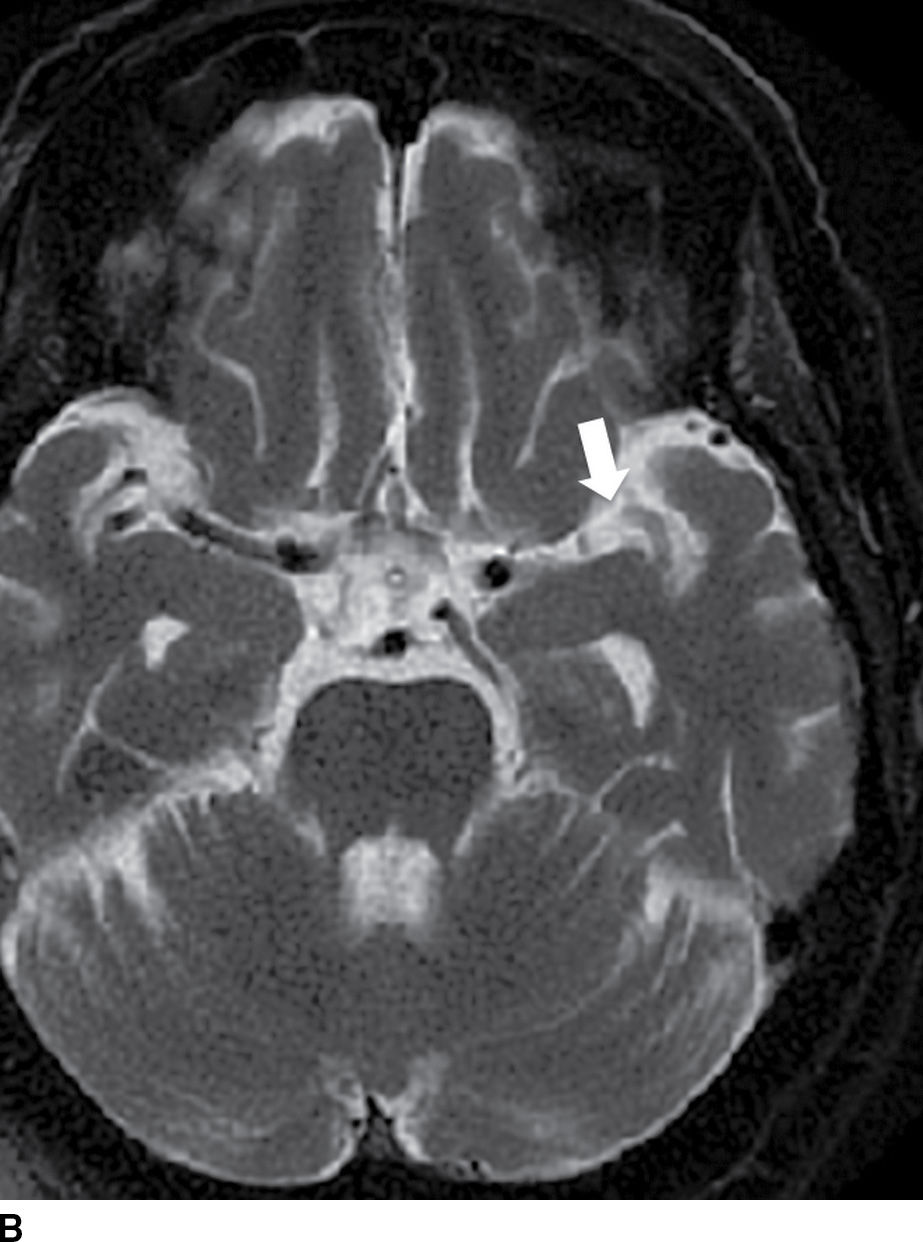
FIG. 5.3 Hyperdense MCA sign. Axial NCCT (A), Axial T2WI (B) and GRE MR (C). There is increased density within the MCA on the left (white arrow on A) corresponding to acute occlusive thrombosis; note the normal appearance of the vessel on the right (black arrow on A). Absence of flow void is seen on T2WI (arrow on B) and prominent decreased “blooming” signal within the vessel on GRE (arrow on C), known as the “susceptibility vessel sign.”
Table 5.1 EARLY IMAGING FINDINGS OF ISCHEMIC STROKE ON CT AND MRI
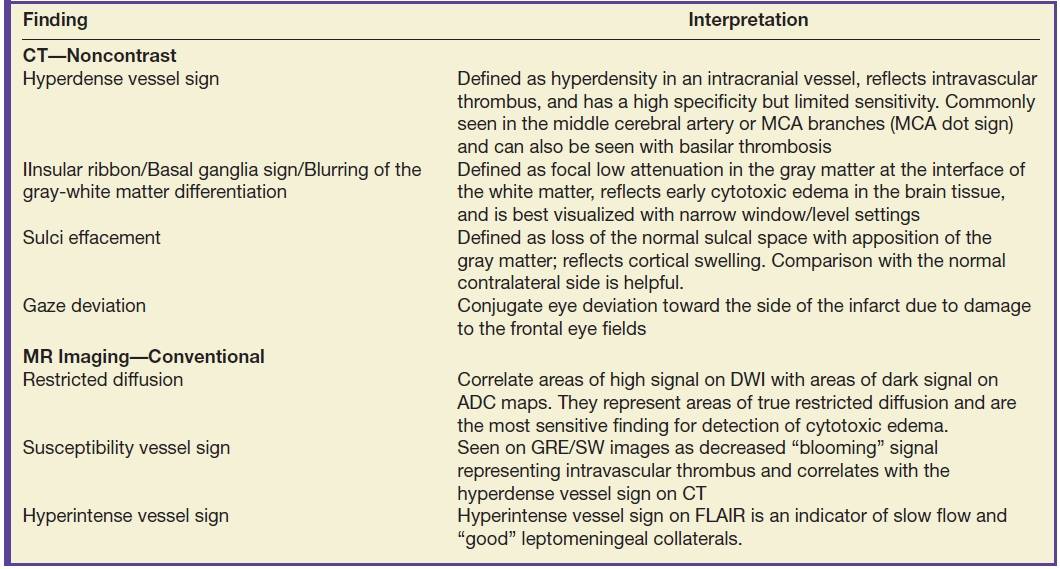
Alberta Stroke Program Early CT Score (ASPECTS) is a common method used to quantify the extent of the ischemia (10). The ASPECTS represents a 10-point scale, where a point is subtracted for each designated area of the MCA territory affected by ischemia/hypodensity. Two slices are selected for evaluation, one at the level of the basal ganglia and other at the level of centrum semiovale. The MCA territory is subdivided into 10 regions: M1, M2, M3, M4, M5, M6, caudate nucleus, lentiform nucleus, internal capsule, and insular cortex (Fig. 5.4). Score of 7 or more correlates with less than 1/3 MCA territory involved and has been associated with good prognosis and fewer complications to IV thrombolysis. Baseline ASPECTS 6-10 on non contrast CT was used as an inclusion criteria in a few of the positive endovascular trials (ESCAPE, SWIFT PRIME).
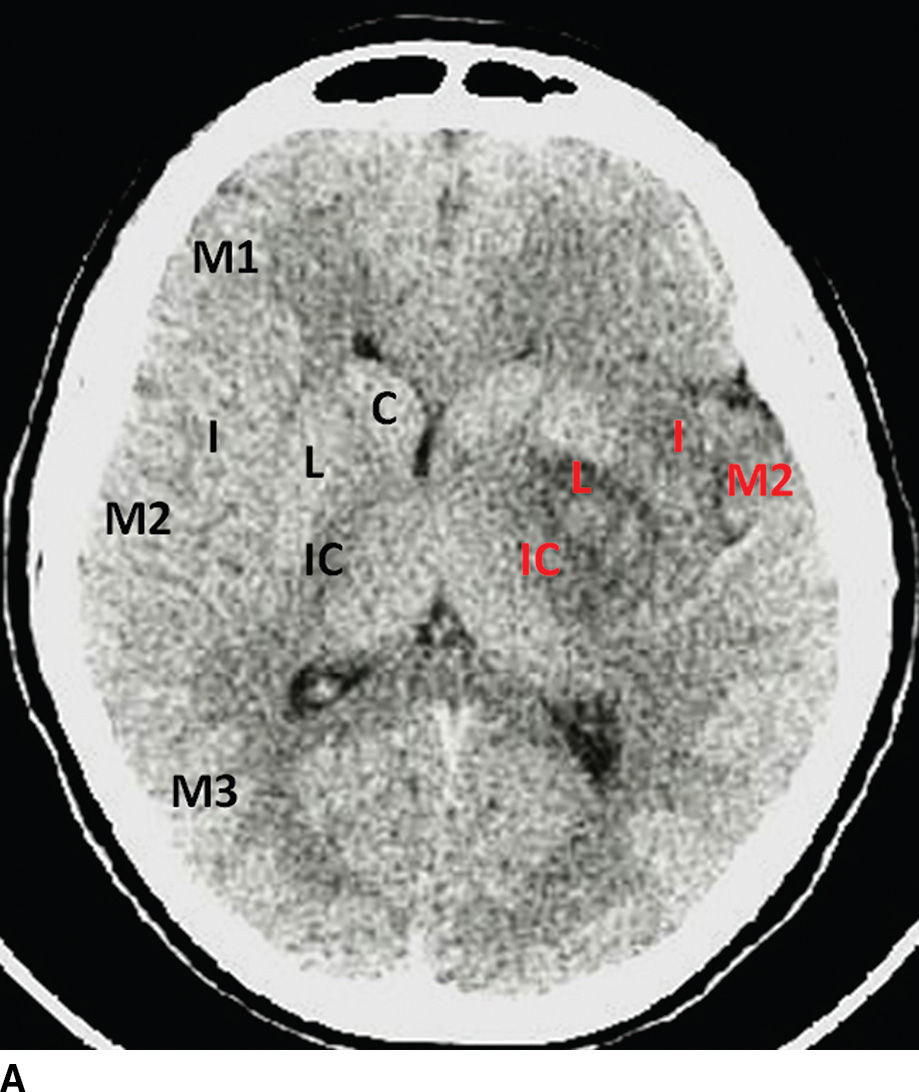
FIG. 5.4 ASPECTS in a patient with left-sided middle cerebral artery (MCA) stroke. A: NCCT image at the level of the basal ganglia. B: NCCT at a higher level near the centrum semiovale. Key: M1, M2, M3, M4, M5, and M6: correspond to regions of the MCA territory; I, insula; L, lentiform nucleus; C, caudate; and IC, internal capsule. Black letters annotate the areas in normal hemisphere and red letters in the infarcted territories. This patient has an ASPECTS of 4 (6 out of 10 areas are hypodense/ischemic, red letters). An ASPECTS of 7 or less corresponds grossly with an infarct involving greater than one-third of the MCA territory and is associated with poor prognosis precluding IV thrombolysis.
MR imaging in acute stroke
Restricted diffusion related to cytotoxic edema from an acute infarct can be seen as early as 30 minutes after stroke onset. Diffusion-weighted imaging (DWI) is superior to NCCT for detection of early infarcts, has high sensitivity and specificity, and is recommended for detection of acute stroke (Figs. 5.1 and 5.2). DWI also demonstrates good correlation with the infarct core or areas of irreversible damage. Table 5.2 demonstrates the evolution of infarction on different MRI sequences.
Table 5.2 MR IMAGING FINDINGS OF BRAIN INFARCTION IN DIFFERENT STAGES
The presence of intraluminal thrombus can be seen on MRI as blooming effect on Gradient-echo (GRE) or susceptibility-weighted imaging (SWI) (susceptibility vessel sign) and is analogous to the hyperdense vessel sign on NCCT (Fig. 5.3; Table 5.1). GRE/SWI images have similar sensitivity and specificity as NCCT for detection of acute hemorrhage, however is superior in the detection of microhemorrhages. Overall, no increased risk of hemorrhage has been demonstrated in patients with less than five micro-hemorrhages that undergo IV-tPA treatment. (11–14).
FLAIR images demonstrate abnormal signal in the infarcted tissue approximately 6 hours after the event. Thus, in a patient with unknown time of event (wake-up stroke), a mismatch between positive DWI and a negative FLAIR may suggest a time of onset of less than 6 hours (Table 5.2). Hyperintense FLAIR signal in the sulci may suggest the presence of leptomeningeal collaterals; however, its clinical significance is an area of ongoing investigation (15).
Vascular imaging in acute stroke: CT and MR angiography
Identification of an occluded proximal vessel is important, as this is a treatment target for a potential endovascular therapy (Fig. 5.5) (4–8). CT angiography (CTA) and MR angiography (MRA) are useful noninvasive vascular imaging tools. CTA has shown sensitivity of 97% to 98% and specificity of 98% to 99% when compared with digital subtraction angiography (DSA) to detect intracranial or extracranial vessel occlusion or stenosis (16,17). On MRI, noncontrast time-of-flight (TOF) images can be used to evaluate the intracranial and cervical vessels. Contrast-enhanced (CE) MRA is generally used to evaluate the cervical vessels to include the aortic arch. Overall, the accuracy to detect stenosis in the extracranial vasculature with CE-MRA or TOF-MRA is comparable with CTA (18), though TOF-MRA has a disadvantage of flow-related artifacts, which can overestimate the degree of stenosis. CTA is an easily available tool that can help guide therapy . All five recently positive endovascular trials used CTA as a screening tool to identify proximal intracranial anterior circulation occlusions (4–8). Other useful information available from a CTA is collateral status assessment. Collaterals or the backfilling of the pial arteries are an important component of the ischemic pathophysiology. Robust collaterals can sustain ischemic tissue survival until the occluded artery is opened. On the other hand, poor collaterals may have minimal to no salvageable tissue and can increase the risk of hemorrhagic transformation. Few of the endovascular stroke trials used CTA collateral assessment as an adjunct to the ASPECTS score (5,7). The ESCAPE trial used a multiphasic CTA (time resolved CTA using arterial, mid venous and late venous phases) for collateral grading for patient selection (5). The anatomic details on CTA can also assist in planning treatment approaches, thus minimizing time for the endovascular recanalization procedure.
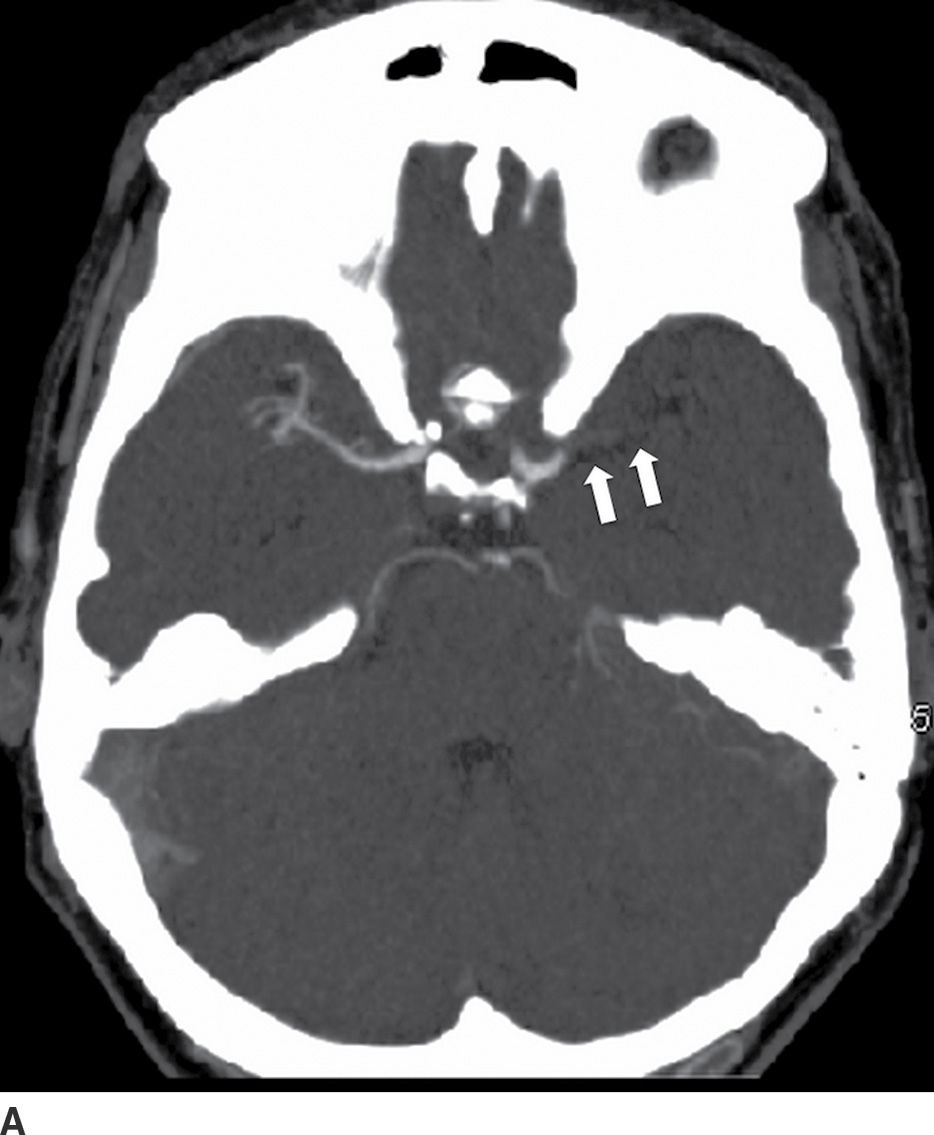
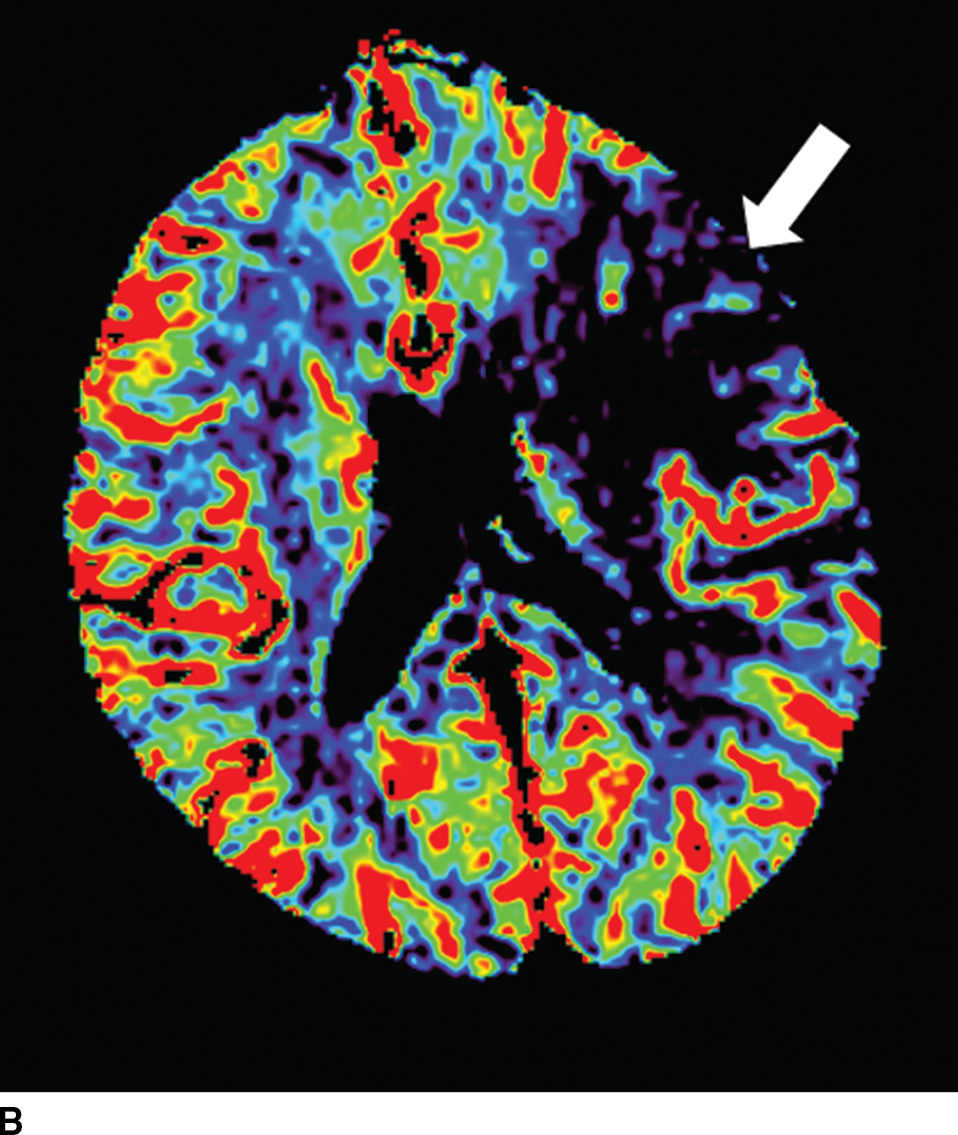
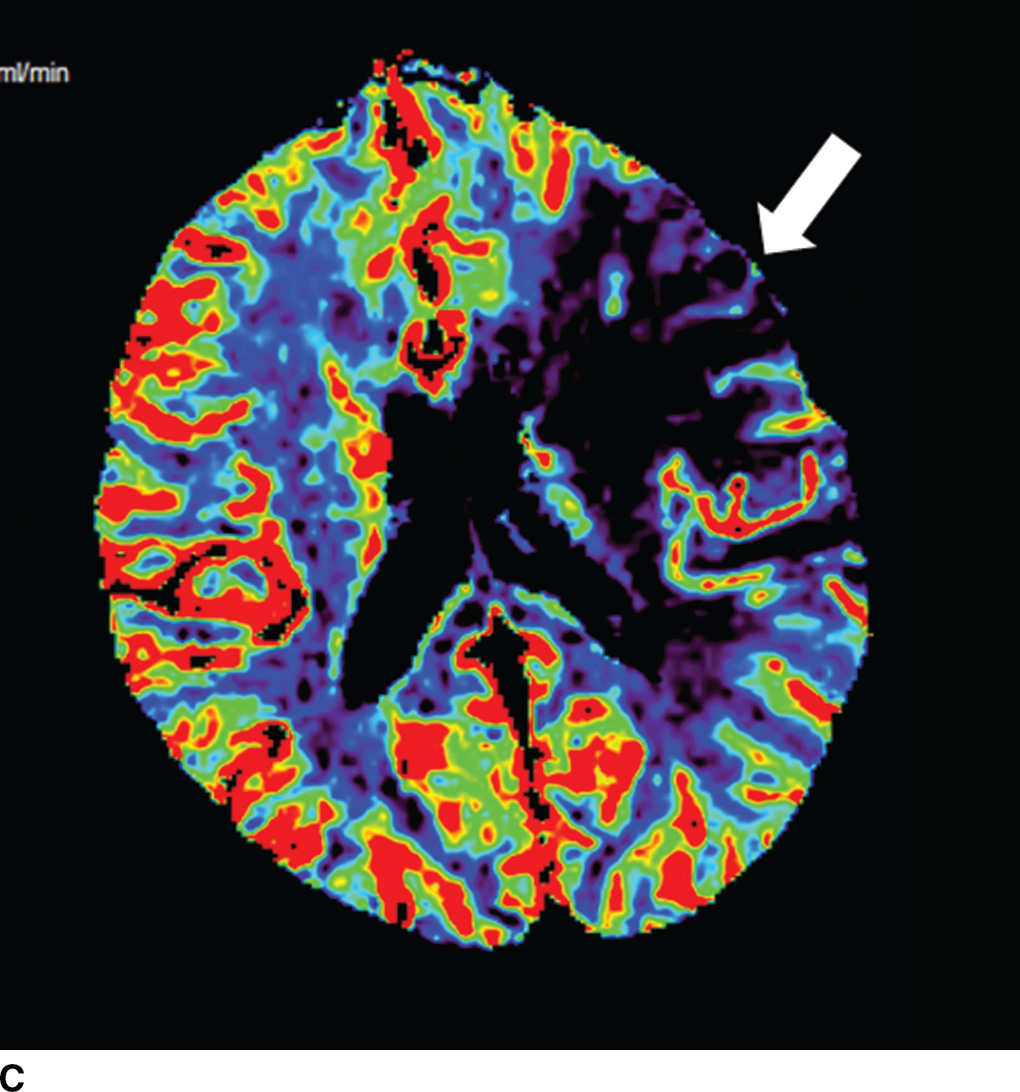
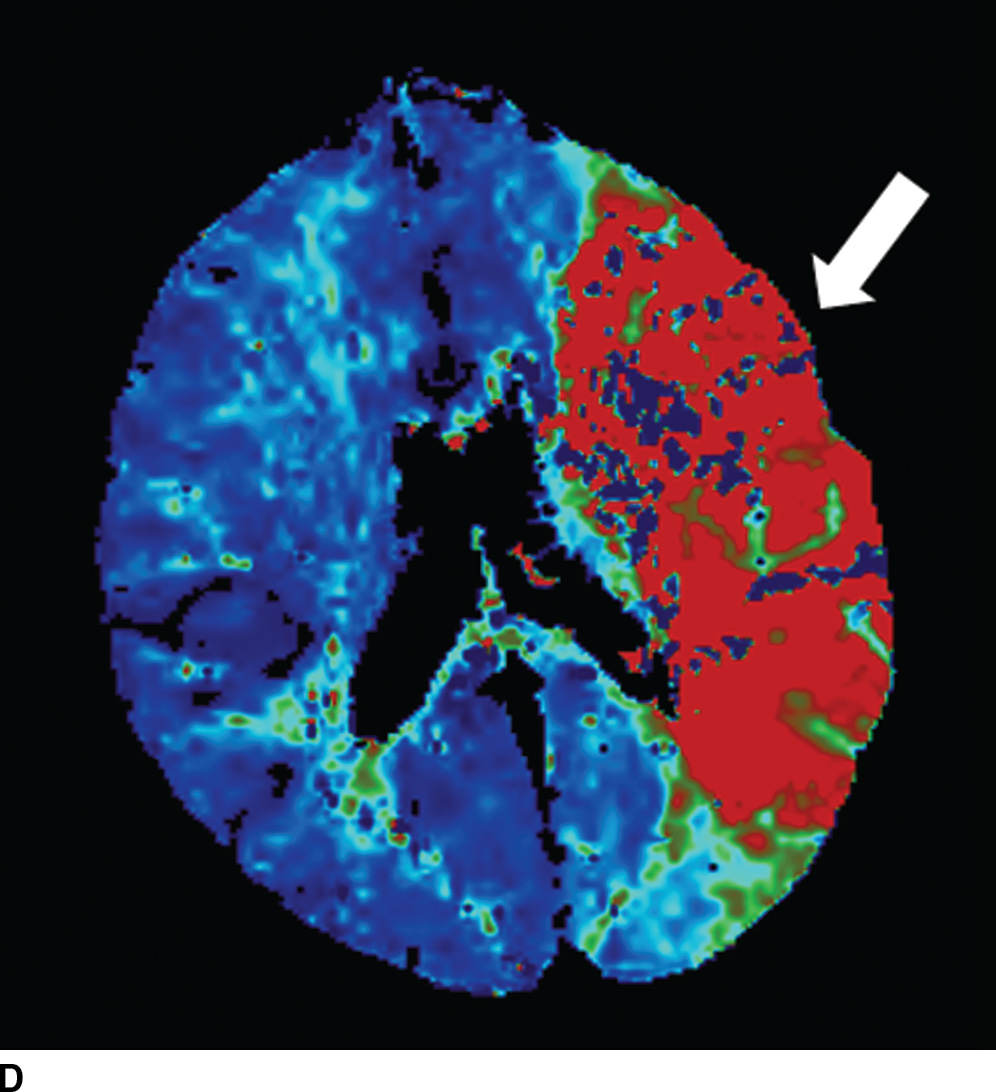
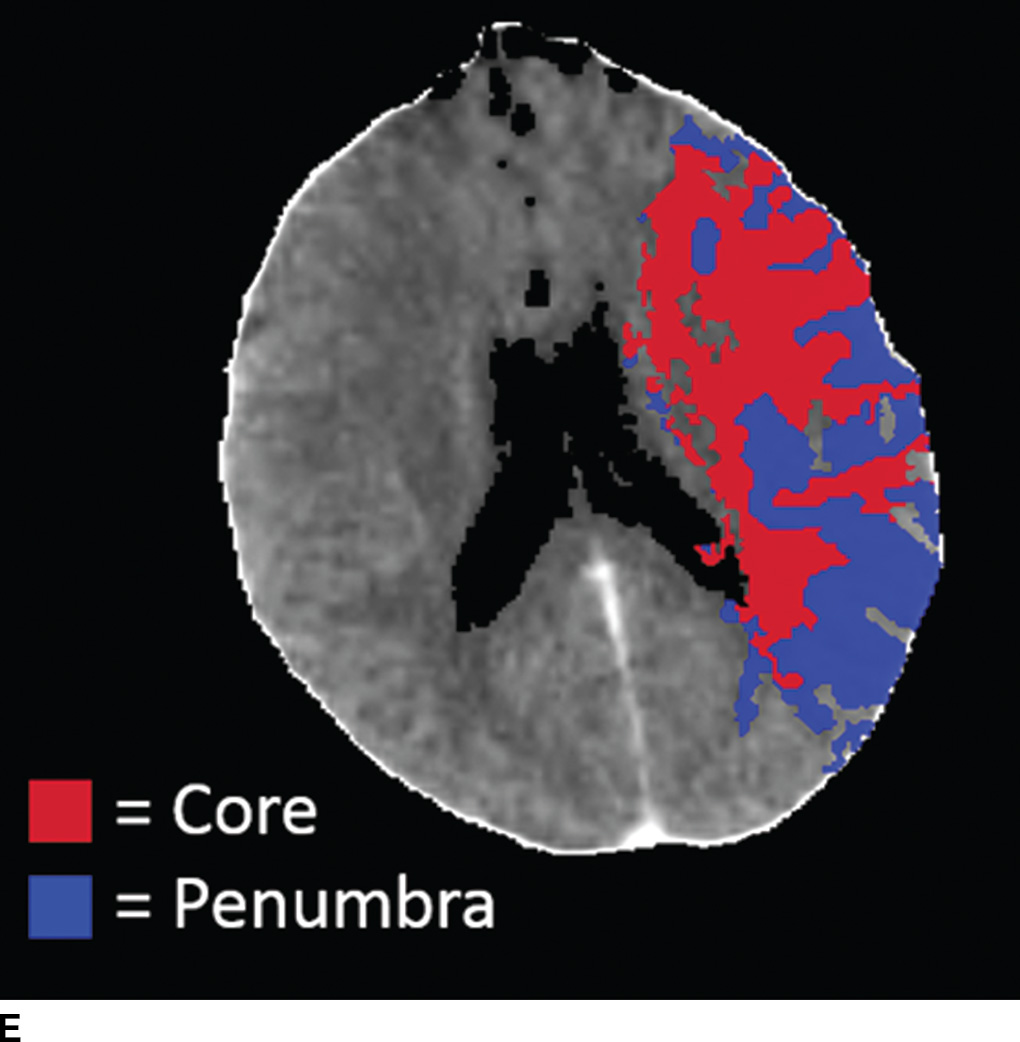
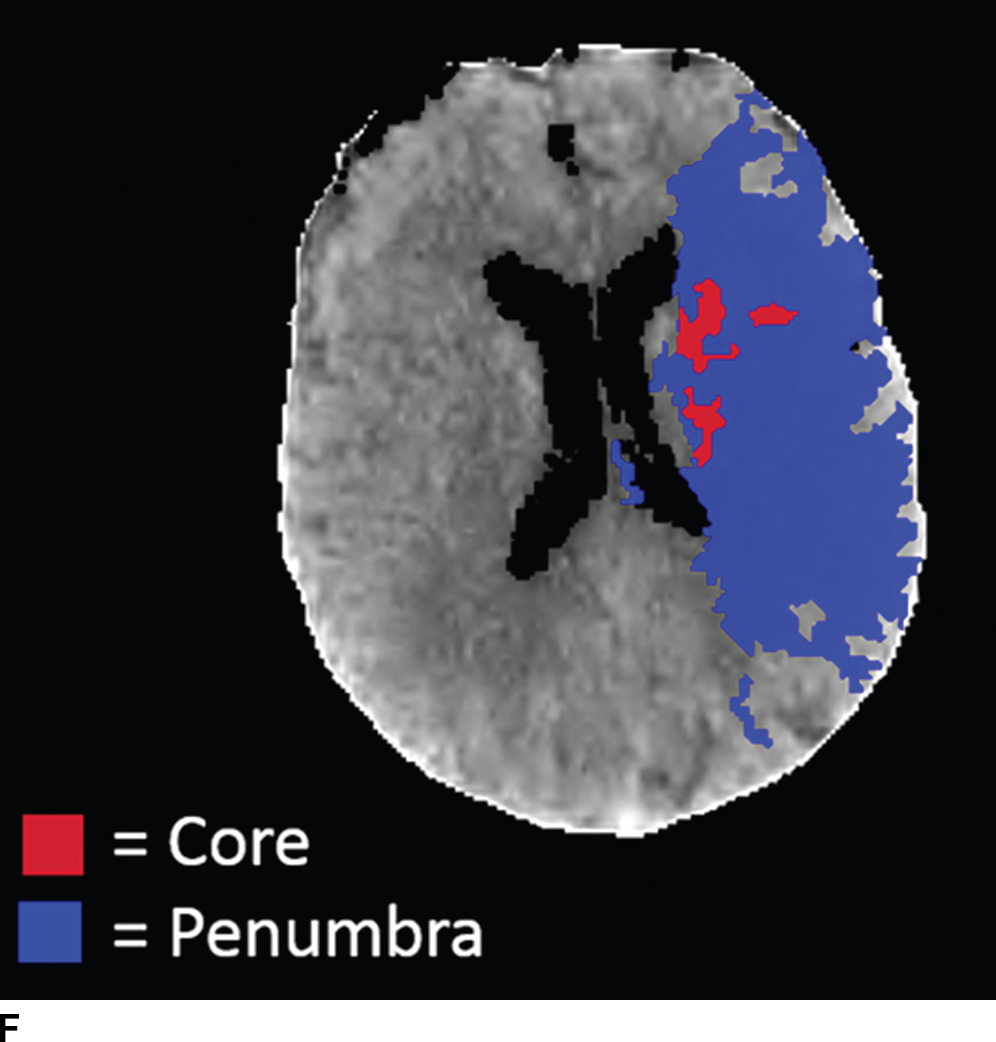
FIG. 5.5 Vascular and perfusion imaging in acute stroke. Axial CT Angiography (A), Cerebral Blood Volume (CBV) (B), Cerebral Blood Flow (CBF) (C), Time to peak (TTP) (D), and color overlay perfusion maps (E) from CT perfusion (CTP) acquisition in the same patient. Color overlay perfusion map (F) in a different patient. There is occlusion of the left MCA on the CTA study (arrows on A). CTP demonstrates significant decrease in the CBV and CBF (dark blue areas on B and C) and increased TTP (red areas on D) as marked by arrows in the left MCA distribution. The corresponding color overlay map (E) demonstrates a large left-sided core infarct volume (red) and large penumbra (blue) with no significant mismatch between core and penumbra. CTP color overlay map (F) on a different patient demonstrates a significant mismatch where the core volume (red) is much smaller than the critically hypoperfused penumbral volume (blue); the latter as potentially salvaged volume of tissue.
Perfusion imaging
Within minutes of an ischemic insult, a core region of brain tissue experiences critical hypoperfusion and becomes irreversibly injured (core infarct). However, surrounding this core is an area of moderate hypoperfusion that is still salvageable, but at risk for infarction. This zone is the ischemic penumbra, and the mismatch between the core and hypoperfused tissue may represent a target of acute stroke therapy. A variety of parameters such as cerebral blood flow (CBF), cerebral blood volume (CBV), mean transit time (MTT), time to peak (TTP), and time to residue or Tmax maps can be obtained by perfusion imaging (Fig. 5.5). They can be used to estimate areas of infarct core or penumbra. For example, low CBV on CT perfusion (CTP) may estimate irreversible ischemic core (19) (newer studies have indicated that CBF estimation may be more accurate for infarct core) (20,21) and the penumbra (tissue at risk) may be determined based on an elevated MTT or increased Tmax (greater than 6 seconds). CTP was used as a selection criteria in addition to non contrast CT and CTA in the EXTEND IA endovascular trial (6). CTP was also performed in a majority of the patients in the SWIFT PRIME trial (7). Eligibility criteria required presence of tissue at risk and excluded patients with ischemic core greater than 70 ml in EXTEND IA and 50 ml in SWIFT PRIME, using a rCBF threshold (less than 30% as compared to contralateral hemisphere) and automated post processing. Details of thresholds including pathophysiologic and technical challenges are beyond the scope of this chapter; however, note that currently there is lack of standardization and validation of perfusion parameters and thresholds for determining core, penumbra, and mismatch (22,23).
Hemorrhagic transformation of stroke
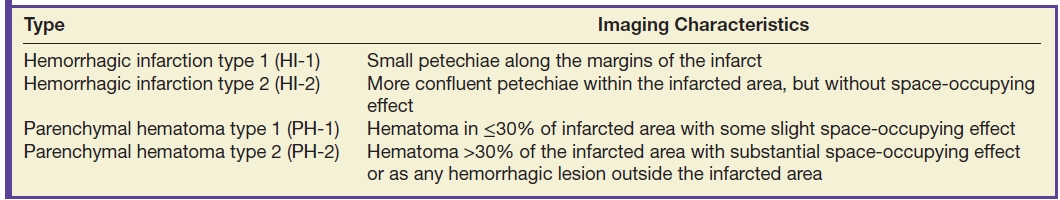
Hemorrhagic transformation (HT) is a common consequence of ischemic stroke and frequently accompanies moderate to large infarcts without any specific therapy. The overall incidence of HT in untreated ischemic strokes ranges from about 7% to 40%. Symptomatic intracerebral hemorrhage (ICH) occurs in approximately 6% of patients receiving IV thrombolysis for acute ischemic stroke and has been associated with high morbidity and mortality (24). Most hemorrhagic transformations are diagnosed 24 to 48 hours after ischemia and occur due to reperfusion of an ischemic damaged endothelium (Fig. 5.6). ICH is usually attributed to thrombolytics if within 24 to 36 hours of treatment. HT of infarct can range from petechial hemorrhages to large hematomas. Four types of HT have been defined including hemorrhagic infarction (HI) or parenchymal hematoma (PH) (Table 5.3) (25,26). The parenchymal hematoma type 2 (PH-2) or larger hematomas with mass effect may be associated with neurologic deterioration and poor outcomes (26). The majority of hemorrhagic transformations in arterial infarcts are smaller than the field of the infarct. FLAIR and DWI sequences may be helpful to assess the nonhemorrhagic regions and to show that the blood is within a larger ischemic infarct in a vascular distribution.
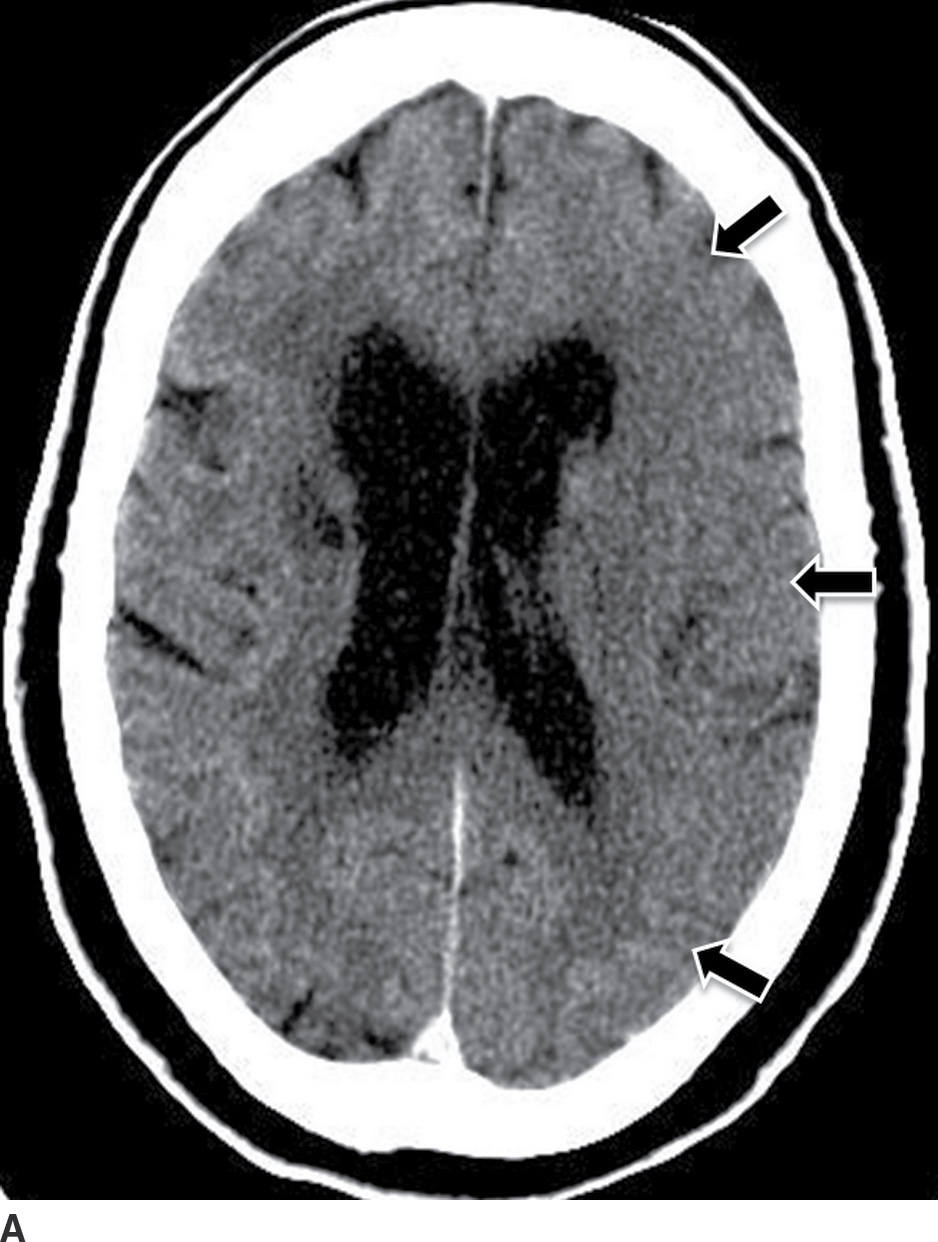
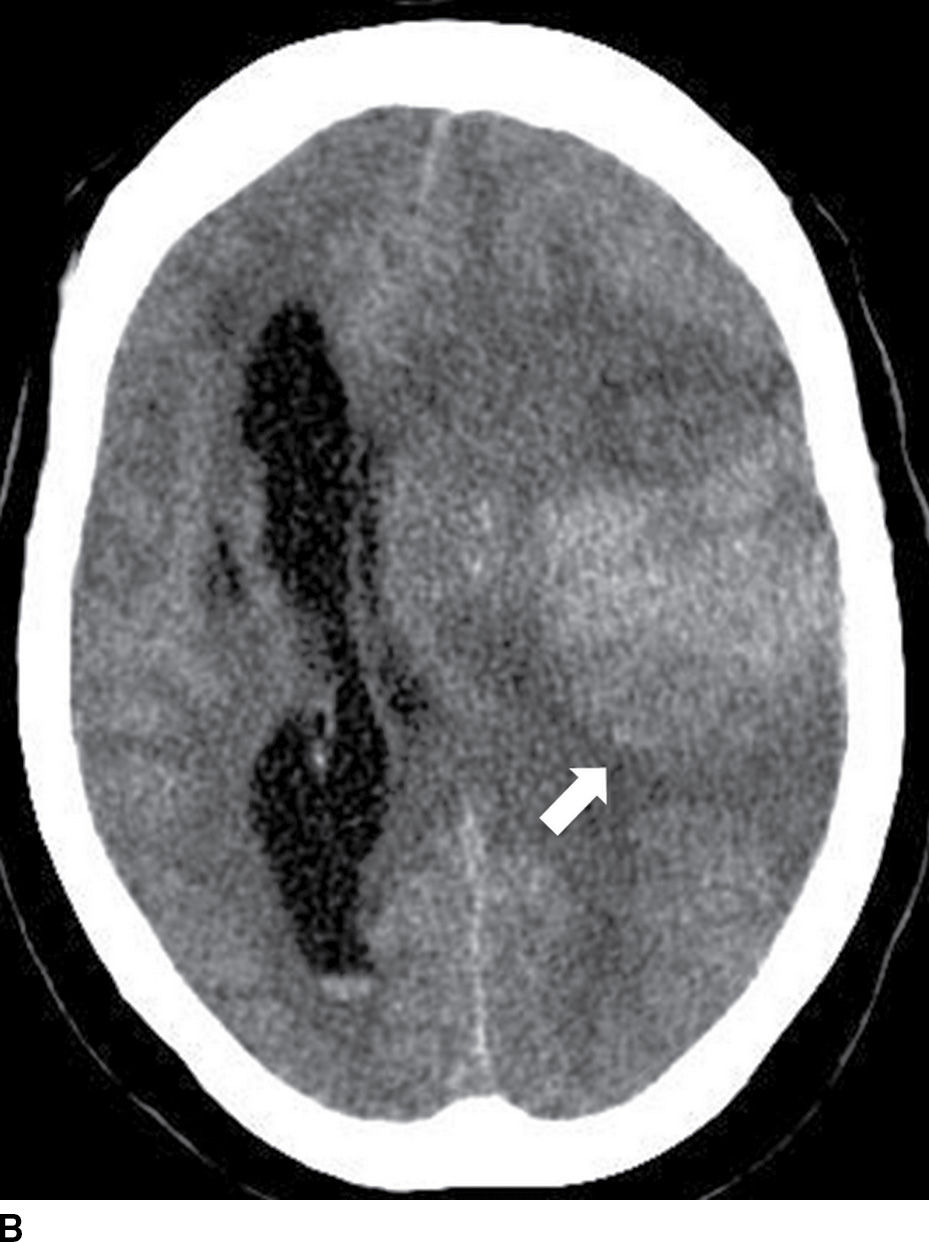
FIG. 5.6 Hemorrhagic transformation. A: Baseline axial NCCT. B: Axial NCCT in the same patient after 24 hours. Note subtle sulci effacement in the left hemisphere and decreased cortical and subcortical attenuation in the baseline CT, consistent with acute ischemia (black arrows on A). After IV tPA treatment, there is significant increase in mass effect with midline shift and new areas of cortical and subcortical hyperdensity in the left frontotemporal region (white arrow on B) consistent with hemorrhagic transformation.
Table 5.3 TYPES OF HEMORRHAGIC TRANSFORMATION IN ISCHEMIC STROKE
Etiology
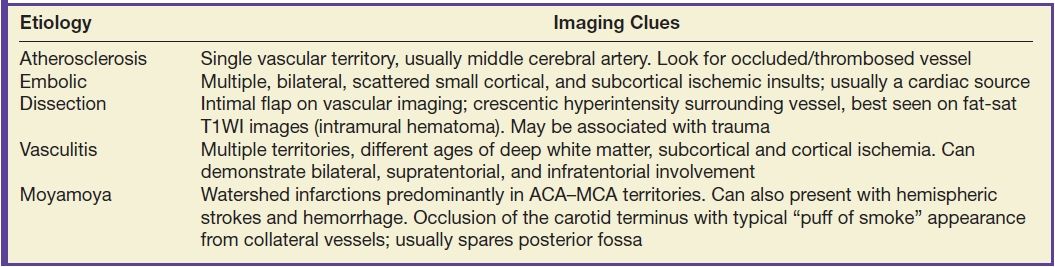
Identifying the cause of the stroke is important for treatment, preventing complications and recurrence. Thromboembolic phenomenon secondary to extracranial or intracranial atherosclerosis is the most common cause of stroke. Rupture of plaque and luminal thrombus formation is the usual mechanism of atherosclerotic ischemic strokes (Fig. 5.5). Carotid stenosis may result in border-zone or watershed territory, low-flow infarcts. A cardioembolic source is the next most frequent cause of cerebral infarction, and a cardiac source including atrial fibrillation, valvular disease, and cardiac masses may be the culprits (Fig. 5.7). Less frequent causes include dissection (spontaneous or traumatic), vasculopathies (e.g., infectious or noninfectious vasculitis, moyamoya), and hypercoagulable states.
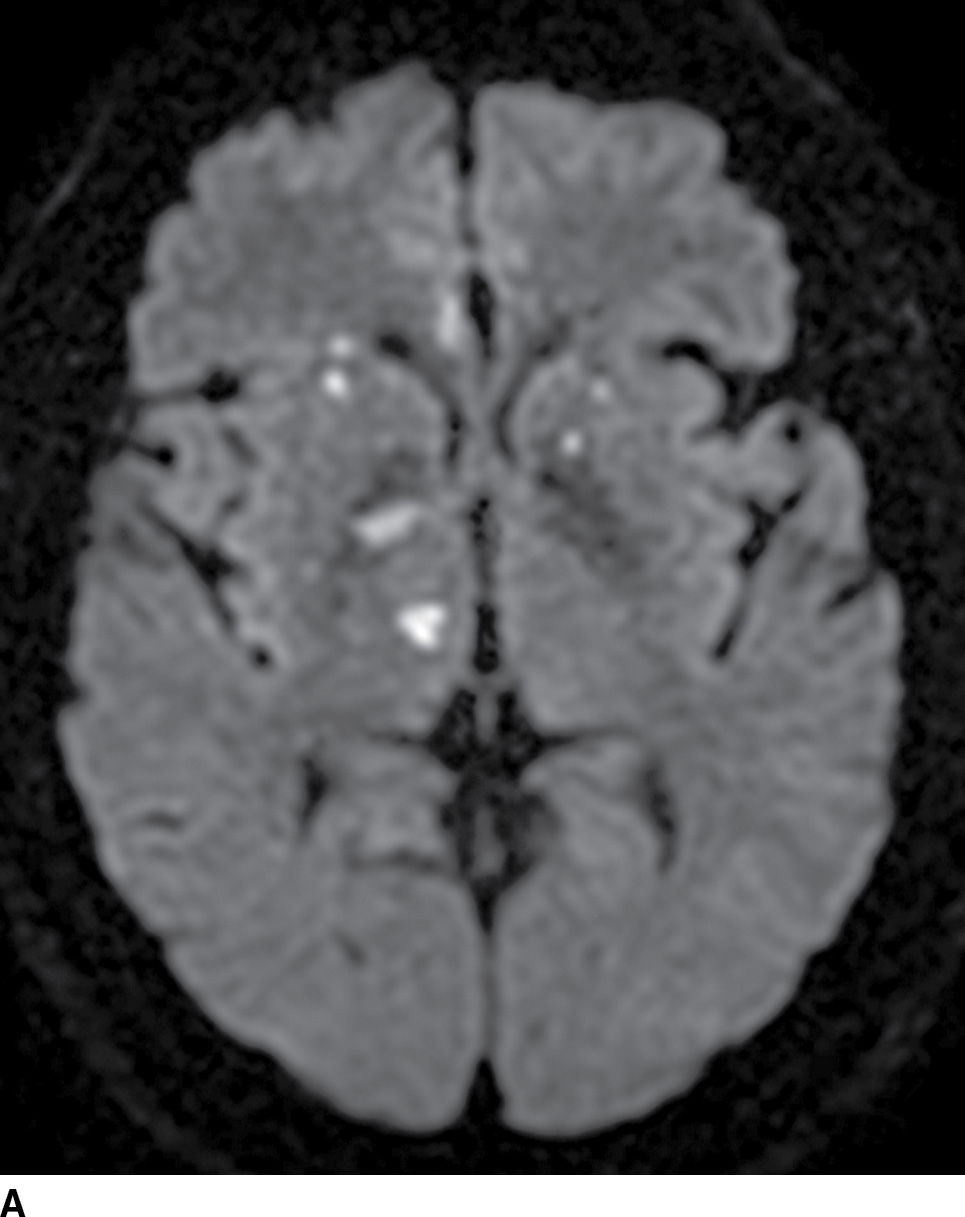
FIG. 5.7 Embolic infarcts.Diffusion-weighted images at the level of the basal ganglia (A) and at the level of the centrum semiovale (B) in the same patient show small scattered areas of restricted diffusion (hyperintensity) in multiple subcortical and cortical vascular territories, a classic embolic pattern of infarcts.
There should be a high index of suspicious for dissection in young patients, particularly with posterior fossa infarctions (vertebral artery dissection), regardless of whether significant trauma is part of the clinical history. Intimal tears can lead to intramural hematomas causing vessel stenosis or occlusion.
Vasculitis is a rare but important cause of stroke. Pathologically characterized by inflammation with or without necrosis of the blood vessel wall, the definitive diagnosis is made by biopsy of the leptomeninges and brain parenchyma. DSA is the most sensitive technique, which can show multifocal segmental narrowing, occlusion, or irregularities of small and medium-sized vessels. Vasculitis may be suggested when multiple territories and multiple ages of deep and or superficial infarcts are found (in a nonembolic pattern) (Table 5.4).
Table 5.4 ETIOLOGIES AND IMAGING PATTERNS OF ISCHEMIC STROKE
Stroke mimics
Stroke mimics have accounted for 3% to 13% of patients primarily diagnosed and treated as acute stroke (27,28) and recognition of these lesions is important. Tumor, infection, seizures, inflammatory, demyelinating diseases, and metabolic disorders can all mimic stroke by clinical presentation and/or imaging. In general, the distribution of the lesion in an atypical vascular territory should prompt the suspicion of a stroke mimic. Gliomas, metastasis, or lymphoma can present with focal neurological symptoms and can also demonstrate restricted diffusion on MRI due to increased cellularity. However, mass lesions usually demonstrate contrast enhancement in a nodular or rim pattern and do not follow a vascular territory. Encephalitis can mimic a subacute ischemic insult, particularly with gyral or leptomeningeal enhancement. Herpes encephalitis has a typical distribution involving predominantly the limbic system (mesial temporal lobes, cingulate gyrus, and insula) and usually spares the basal ganglia (Fig. 5.8). Seizure/postictal imaging can demonstrate cortical areas of abnormal FLAIR signal and restricted diffusion; they typically involve the mesial temporal region and are transient. Posterior reversible encephalopathy syndrome (PRES) is usually characterized by bilateral occipitoparietal vasogenic edema. Other metabolic encephalopathies such as hypoglycemic encephalopathy and mitochondrial encephalomyopathy, lactic acidosis, and strokelike episodes (MELAS) can cause restricted diffusion.
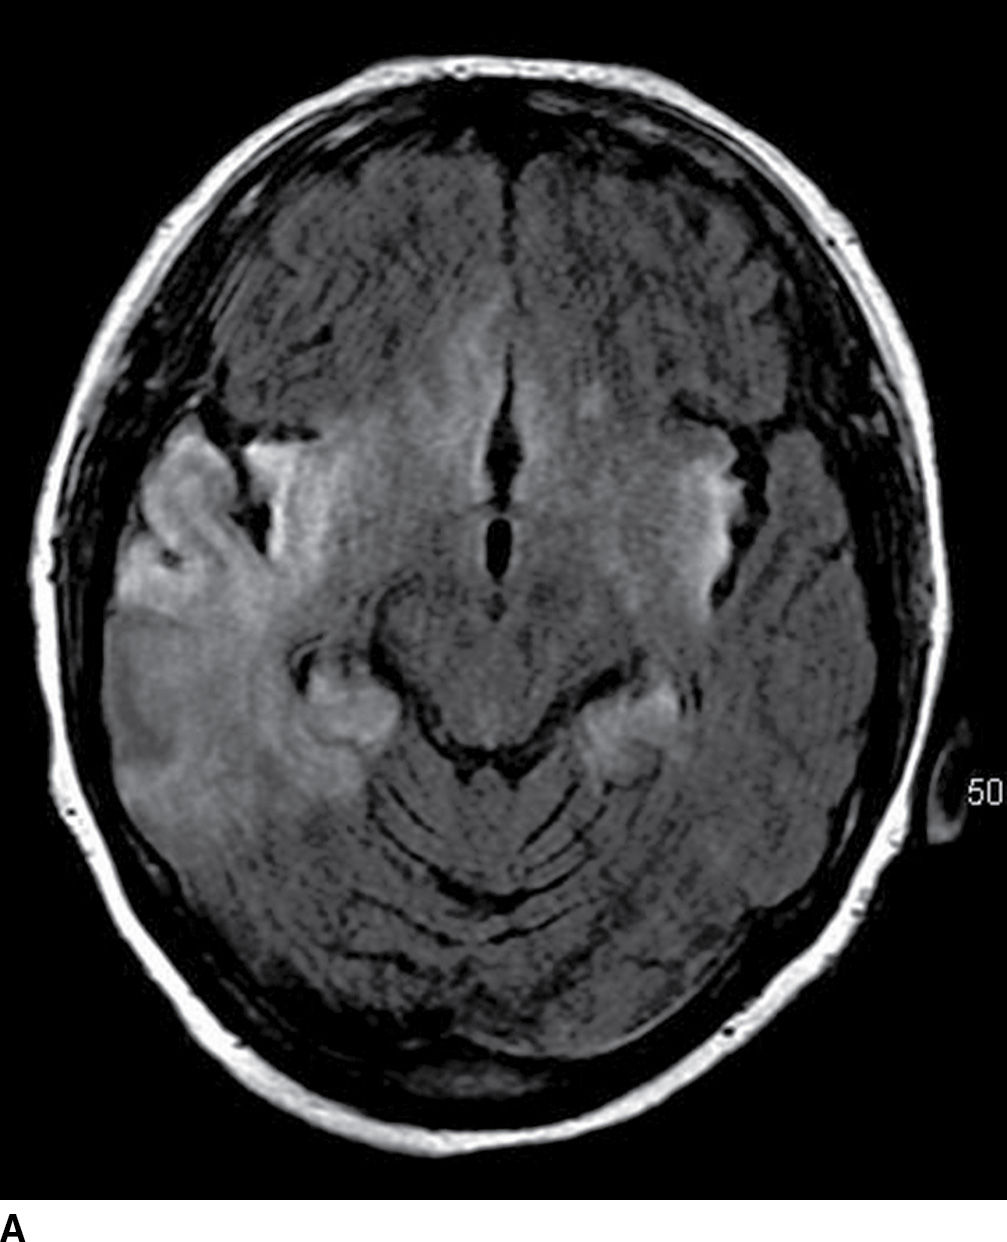
FIG. 5.8 Herpes encephalitis.60-year-old patient with acute-onset confusion and seizures. Axial FLAIR (A) and postcontrast T1WI MR images (B) show bilateral diffuse areas of cortical and subcortical increased FLAIR signal and gyral/cortical enhancement in the temporal, insular, and cingulate gyrus regions with no distinct vascular territory.
Intracranial Hemorrhage
Intracranial hemorrhage encompasses both intracerebral (traumatic and nontraumatic) and extracerebral hemorrhage (subarachnoid, subdural, and epidural hemorrhages). The nontraumatic spontaneous intracranial hemorrhage (ICH) leading to hemorrhagic stroke will be discussed in this chapter.
The CT appearance of ICH varies with the stage of the hematoma. In the acute stage, the ICH measures 30 to 60 HU immediately after vessel rupture and 60 to 80 HU with fibrin clot within minutes to hours. The center can demonstrate higher attenuation in acute stages, measuring 80 to 100 HU due to clot retraction and serum extrusion. The hematoma attenuation decreases in the subacute stage to that of normal cortex within 4 to 9 days, and within 2 to 3 weeks to that of normal white matter and in the chronic stage, the hematoma is fluid filled and slitlike in appearance (29). Table 5.5 demonstrates the evolution of intracranial hemorrhage on CT and MRI. The MR appearance of ICH is more complex and depends on the evolution phase, the compartment of hemoglobin molecule, and the MR sequence used (Fig. 5.9; Table 5.5). There may be additional variability in evolution of the hematoma depending on the size/location of the hematoma, red blood cell morphology, oxygen tension, integrity of the blood–brain barrier, the presence of rebleeding, and intrinsic repair processes (30).
Table 5.5 CT AND MR IMAGING CHARACTERISTICS OF INTRACRANIAL HEMORRHAGE
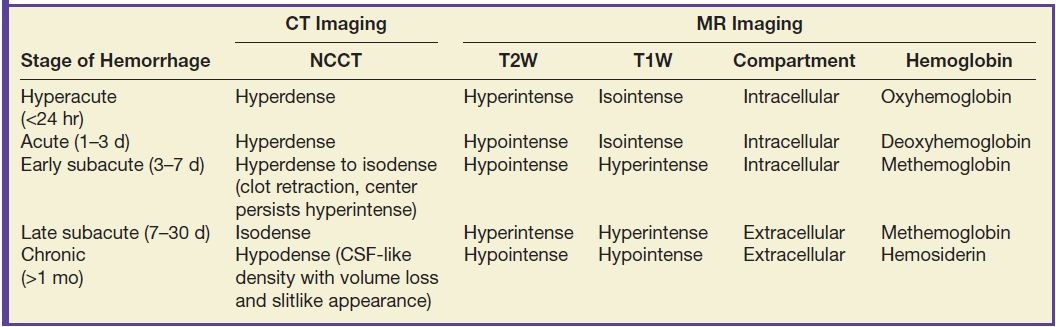
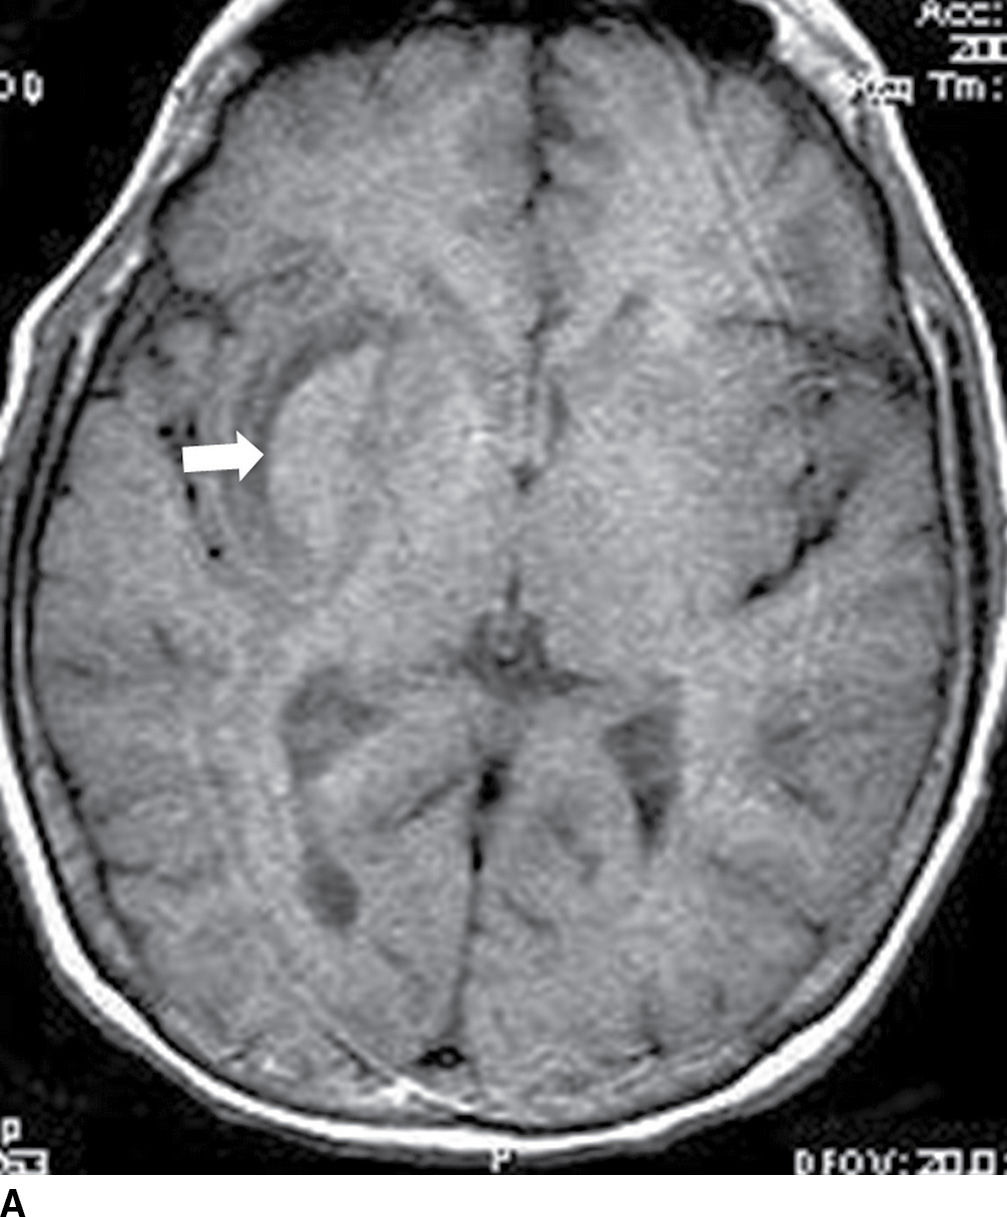
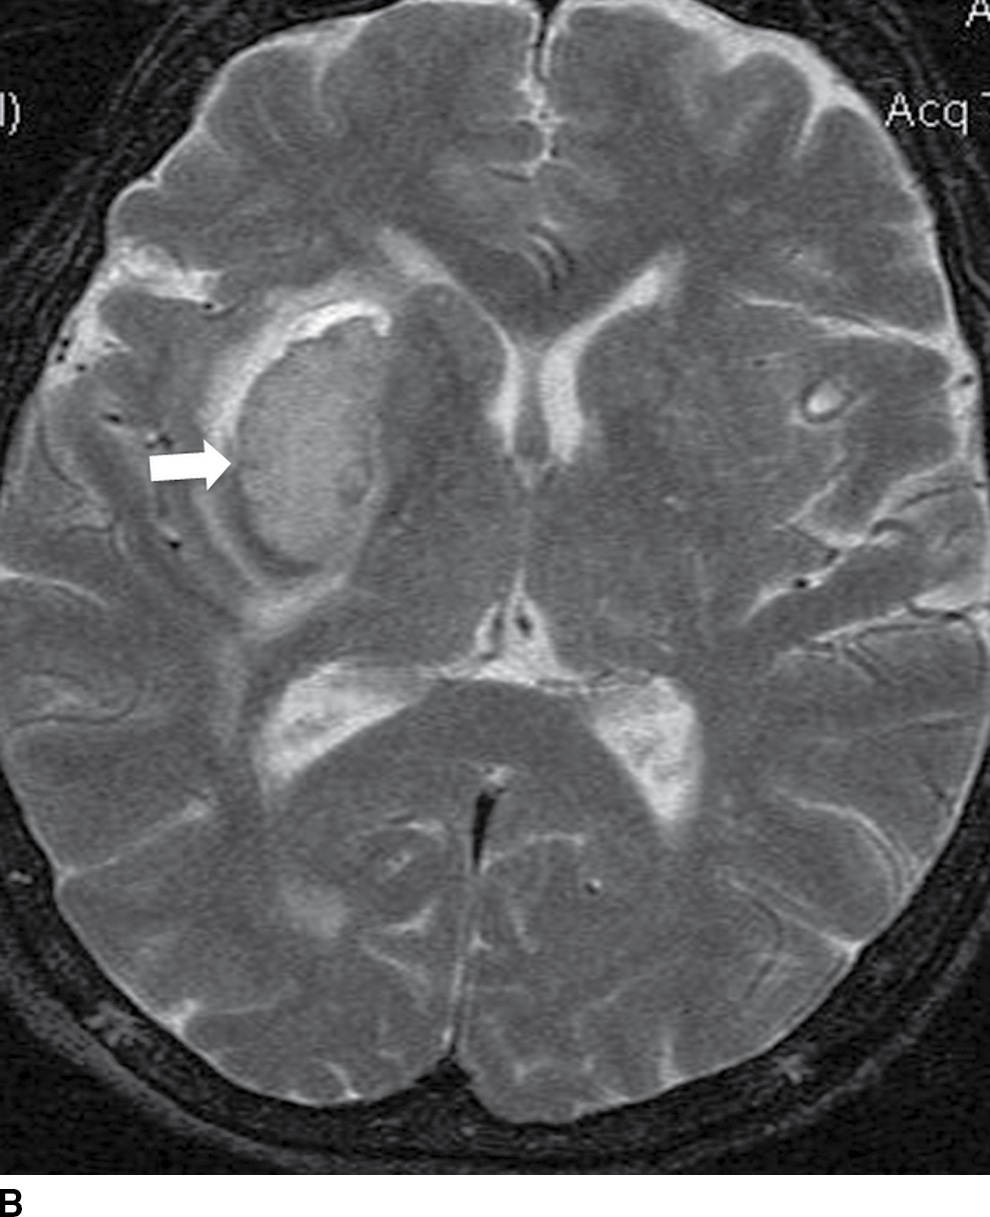
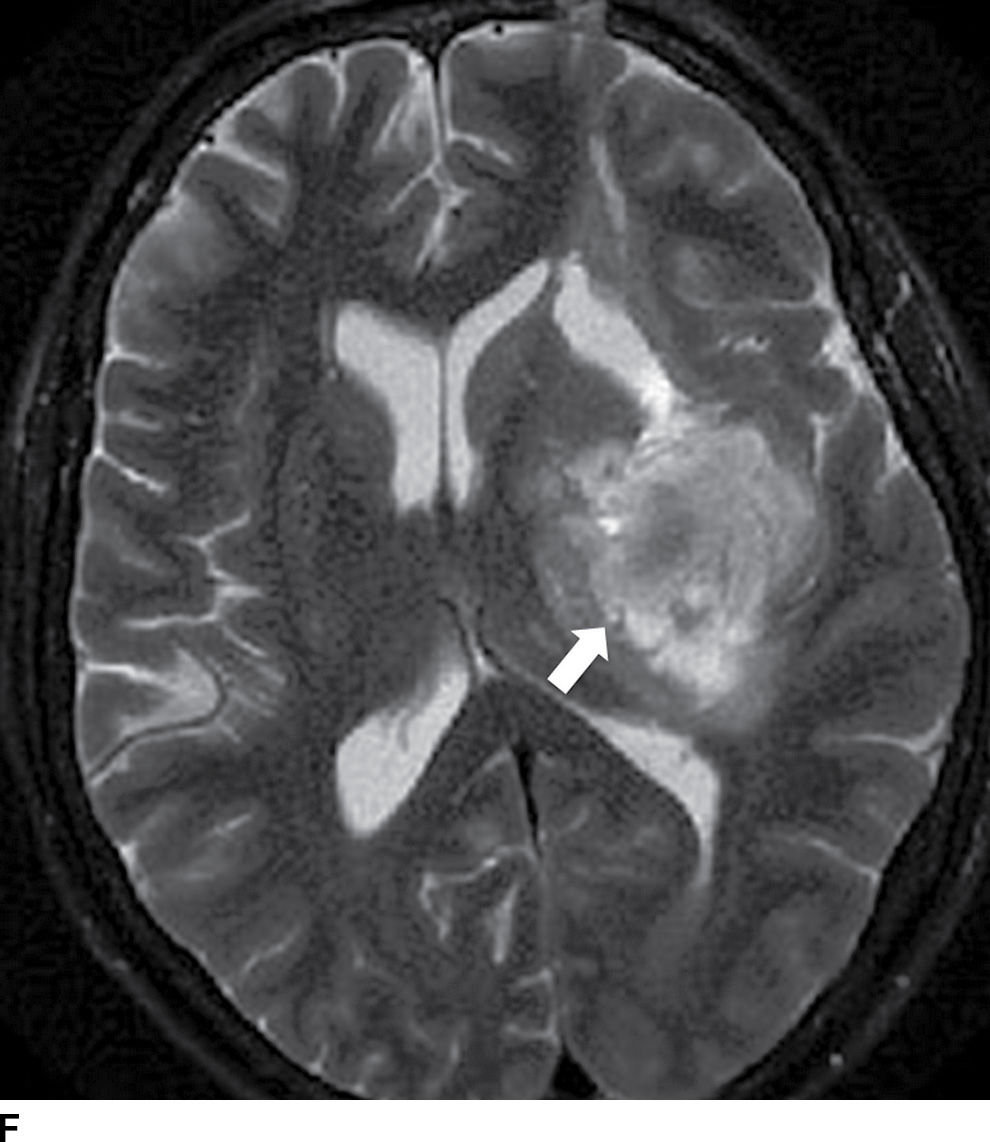
FIG. 5.9 MR imaging appearance of hemorrhage. Axial T1 (A,C,E,G) and T2 (B,D,F,H) images in four different patients. A,B: Hyperacute hemorrhage in the right basal ganglia demonstrates isointensity on T1 and hyperintensity on T2 (arrows). C,D: Acute hemorrhage in the left basal ganglia demonstrating isointensity on T1 and hypointensity on T2 (arrows). E,F: Subacute hemorrhage demonstrates hyperintensity on both T1 and T2 (arrows). G,H: Chronic hemorrhage in the high right frontal lobe; demonstrating hypointensity on both T1 and T2 (arrows).
As previously mentioned, MRI is superior to CT in detecting chronic hemorrhages and microbleeds using GRE/SWI sequences and better at identifying underlying etiology including structural lesions. However, up to 20% of patients with acute stroke may be unsuitable for MRI. NCCT is more widely available, faster, and less expensive and can be combined with CTA, making it the first study of choice for imaging ICH.
The etiologies of ICH can be divided into primary versus secondary categories (Table 5.6). The determination of the etiology can be aided by the location of the hematoma (lobar versus nonlobar), age of patient, clinical history (hypertensive versus normotensive), and careful analysis of associated CT/MR findings and may be supplemented with additional vascular imaging (CTA/MRA) (see Table 5.7).
Table 5.6 CAUSES OF INTRACRANIAL HEMORRHAGE
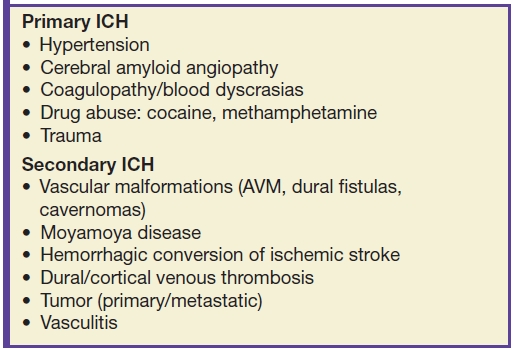
Table 5.7 CAUSES AND IMAGING PATTERNS OF INTRACRANIAL HEMORRHAGE
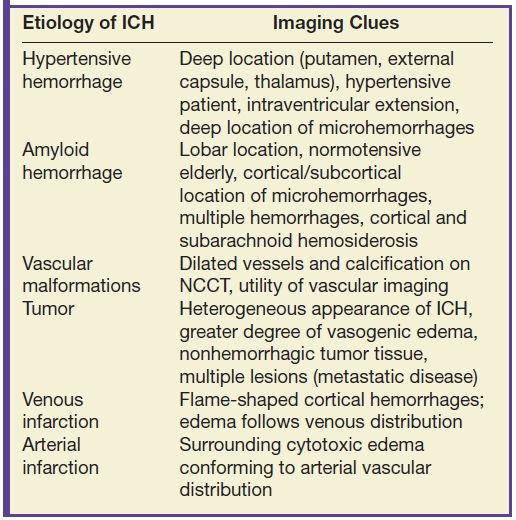
Hypertensive hemorrhage remains the most common cause of ICH between 45 and 70 years old. The characteristic location includes the deep gray matter (putamen, external capsule, thalamus), brainstem, and cerebellum. Large hematomas often dissect into the ventricles, causing intraventricular extension (Fig. 5.10). ICH caused by hypertension most commonly results from rupture of small lenticulostriate arteries or rupture of small microaneurysms (Charcot-Bouchard aneurysms) causing putaminal or caudate hemorrhage or from rupture of small perforating branches of the basilar artery, leading to pontine or thalamic bleeds. Clinical history of systemic hypertension and typical location are important clues to the etiology (Fig. 5.10).
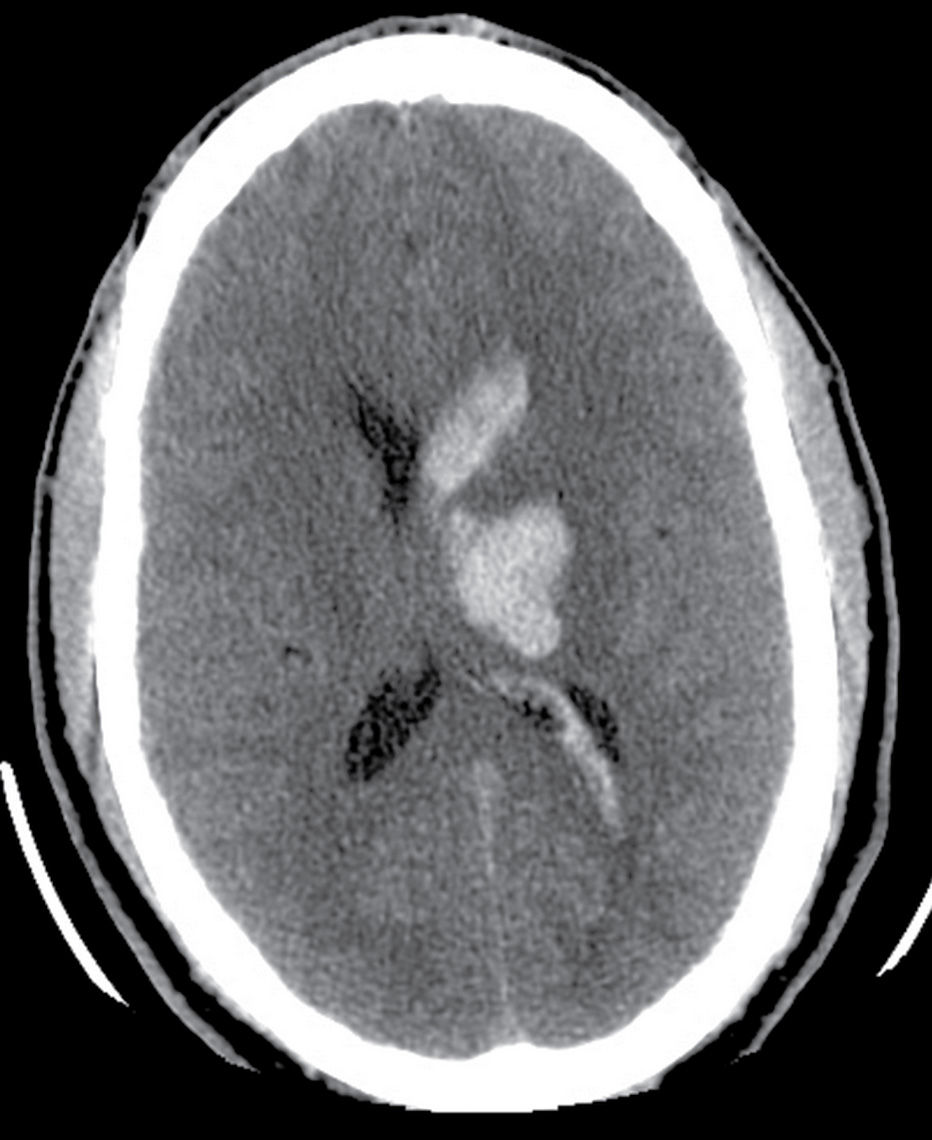
FIG. 5.10 Hypertensive hemorrhage.Axial noncontrast CT shows focal hyperdensity within the left thalamus and basal ganglia, a classic location for hypertensive hemorrhage. There is also extension of the parenchymal hemorrhage into the left lateral ventricle.
Cerebral amyloid angiopathy (CAA) is an important cause of spontaneous ICH in the normotensive elderly and characterized by the deposition of amyloid protein in the media and adventitia of small and medium-sized vessels of the cerebral cortex, subcortex, and leptomeninges. The classic imaging patterns include a cortical–subcortical location with a lobar distribution, often parieto-occipital lobes and frequently associated with clinically silent microbleeds. CAA can also be associated with subarachnoid or subdural hemorrhage resulting in cortical or subarachnoid hemosiderosis (Fig. 5.11) (31). In contrast to hypertensive ICH, CAA typically spares basal ganglia, has uncommon ventricular extension, and is associated with multiple events of hemorrhages and lobar location of macro- and microhemorrhages (Fig. 5.11).
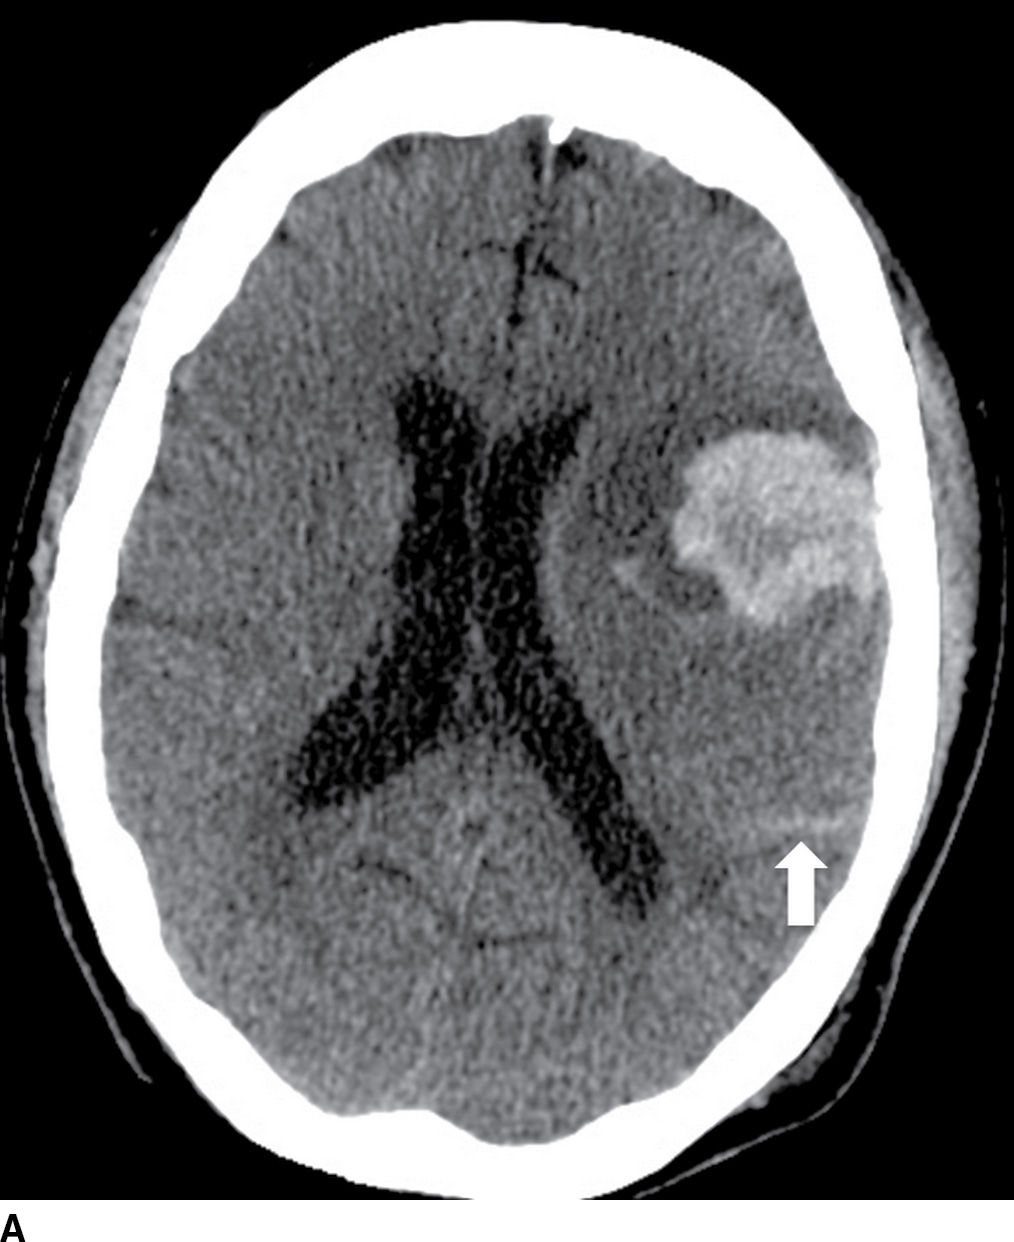
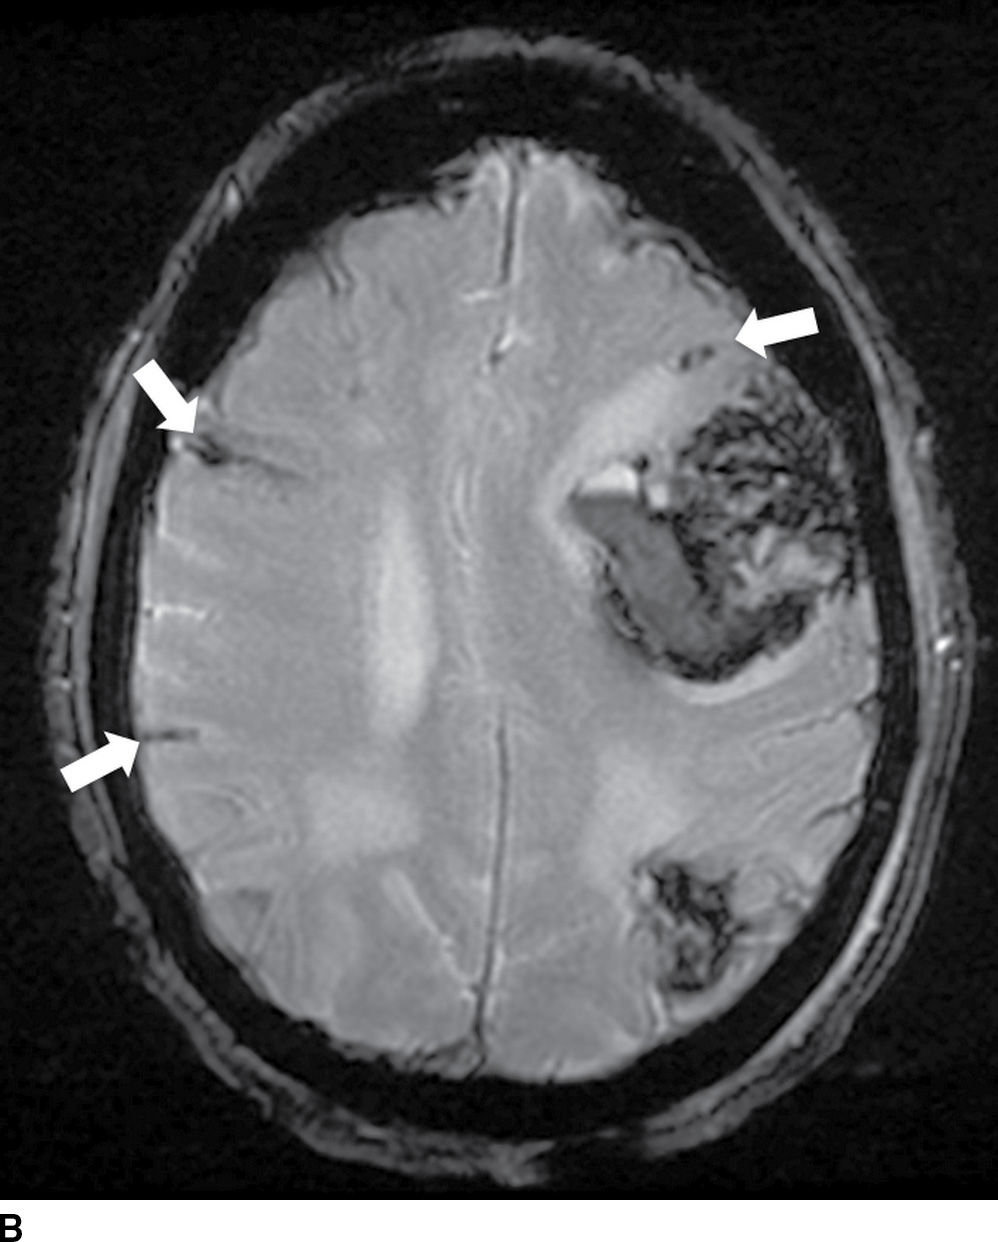
FIG. 5.11 Amyloid hemorrhage.Axial NCCT (A) and gradient-echo MR (B) image show acute large left lobar frontal hematoma. Small chronic cortical hemorrhage in the left parietal region is also noted (GRE image). In addition, areas of recent subarachnoid hemorrhage (arrow on A) and chronic subarachnoid hemorrhage/hemosiderosis (best seen on GRE, arrows) are seen. Combination of findings with different ages of lobar hemorrhages and hemosiderosis is most consistent with an etiology of amyloidosis.
Related posts:
Stay updated, free articles. Join our Telegram channel

Full access? Get Clinical Tree


