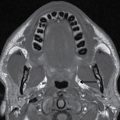
FIG. 25.1 Level I node. Axial CT image demonstrates defects in the mylohyoid muscles bilaterally (arrows). A lymph node is located just lateral to the right mylohyoid defect (arrowhead). Notice preservation of the fat plane between the node and the mylohyoid muscle, distinguishing this node from a structure that is herniating through the mylohyoid defect to the submandibular space.
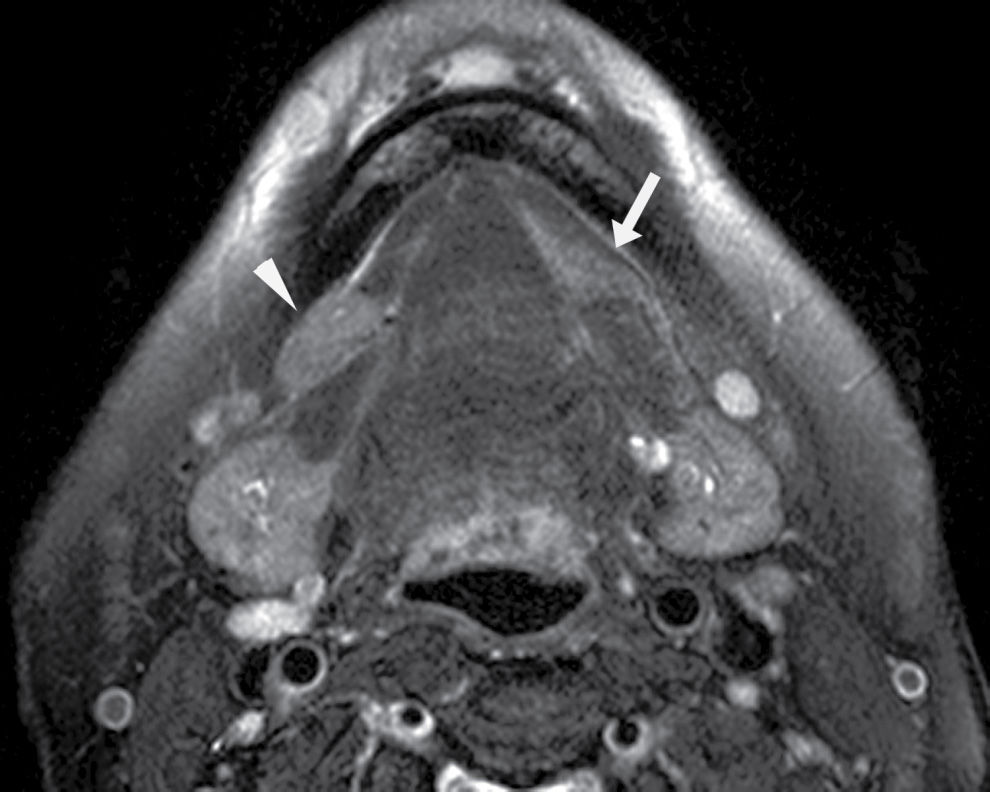
FIG. 25.2 Bilateral mylohyoid defects. Axial T2-weighted MR image demonstrates bilateral mylohyoid defects. Sublingual gland tissue insinuates into the mylohyoid defect on the left (arrow) and herniates through the mylohyoid defect on the right slightly into the submandibular space (arrowhead).
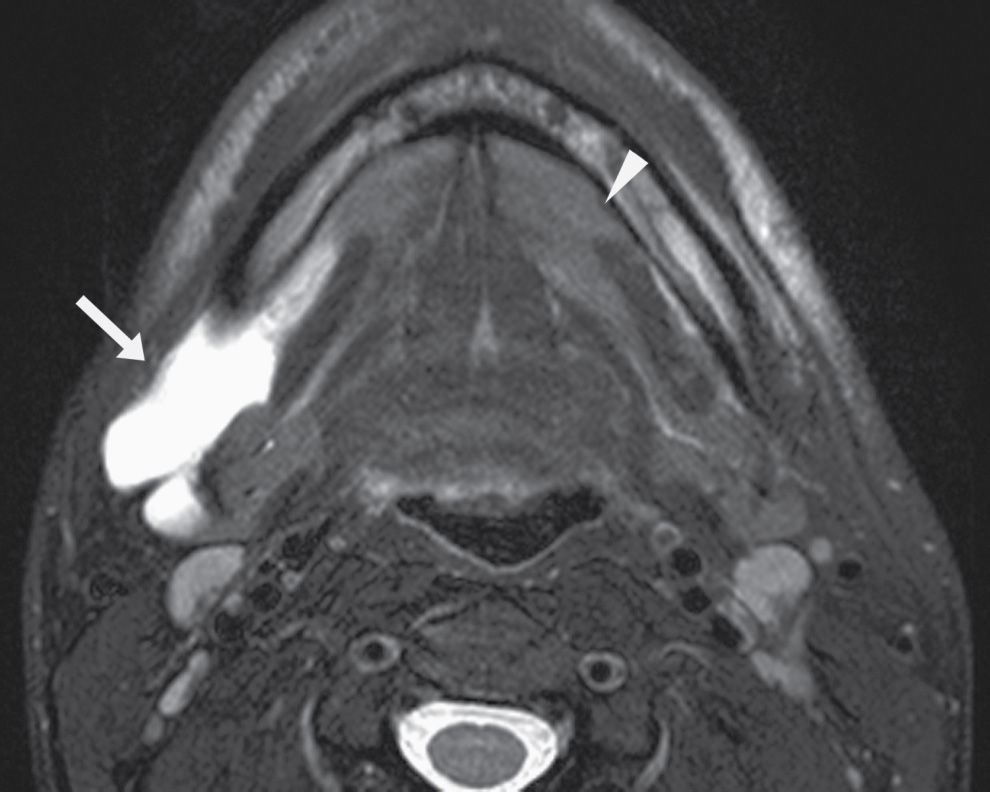
FIG. 25.3 Diving ranula and herniated sublingual gland tissue. Axial T2-weighted MR image shows a diving ranula herniating with some sublingual gland tissue through the mylohyoid defect on the right (arrow). There is also a small amount of sublingual gland tissue extending into a mylohyoid defect on the left (arrowhead).
Clinically and on imaging, herniated salivary gland or accessory salivary tissue through a mylohyoid defect may be mistaken for an abnormal soft tissue mass in the submandibular space, for example, a lymph node or neoplasm. It is important to recognize the imaging features of a mylohyoid defect and salivary tissue to differentiate this benign variant from a pathologic entity. Salivary tissue should be isodense on CT and isointense on all MRI sequences when compared to the major salivary glands (see Fig. 25.2). Accessory salivary tissue adjacent to mylohyoid boutonnières usually tapers toward the defect, in close proximity to the muscle, without a fat plane between it and the muscle. On the other hand, a fat plane should be preserved between the mylohyoid muscle and a submandibular (level Ib) node (see Fig. 25.1). The absence of a mylohyoid defect virtually excludes the possibility of herniated or accessory salivary tissue.
Level II cystic/necrotic metastatic node
Branchial cleft cysts (BCCs) are the most common cysts in the neck and the most common congenital masses in the lateral neck (5). Of all the branchial anomalies, second BCCs are the most common (95% of all cases). Second BCCs can be found anywhere along a path defined embryologically by the interrelationship and interaction of the branchial arches, clefts, and pouches during development, from the oropharyngeal tonsillar fossa to the supraclavicular region (6). BCCs are classified into four types based on their anatomic location. Type I second BCC is located just deep to the platysma along the anterolateral surface of the sternocleidomastoid muscle (Fig. 25.4). Type II second BCC is more medial, located just lateral to the carotid and posterior to the submandibular gland (Fig. 25.5). Type III second BCC is even more medial, between the internal carotid and external carotid arteries at the carotid bifurcation. Type IV second BCC is seen in the pharyngeal mucosal space just deep to the palatine tonsil and is the least common (7).
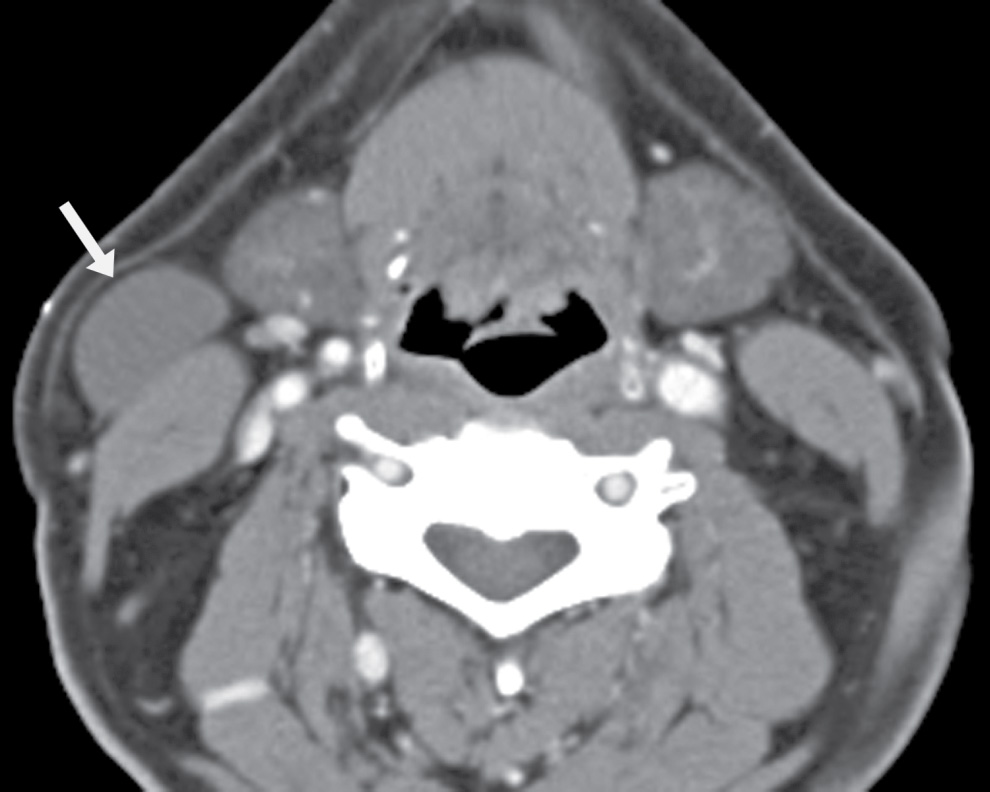
FIG. 25.4 Bailey type I second branchial cleft cyst. Axial contrast-enhanced CT image demonstrates a proteinaceous cystic lesion in the right lateral neck. It is deep to the platysma muscle along the anterolateral surface of the sternocleidomastoid muscle (arrow). This is a Bailey type I second branchial cleft cyst.
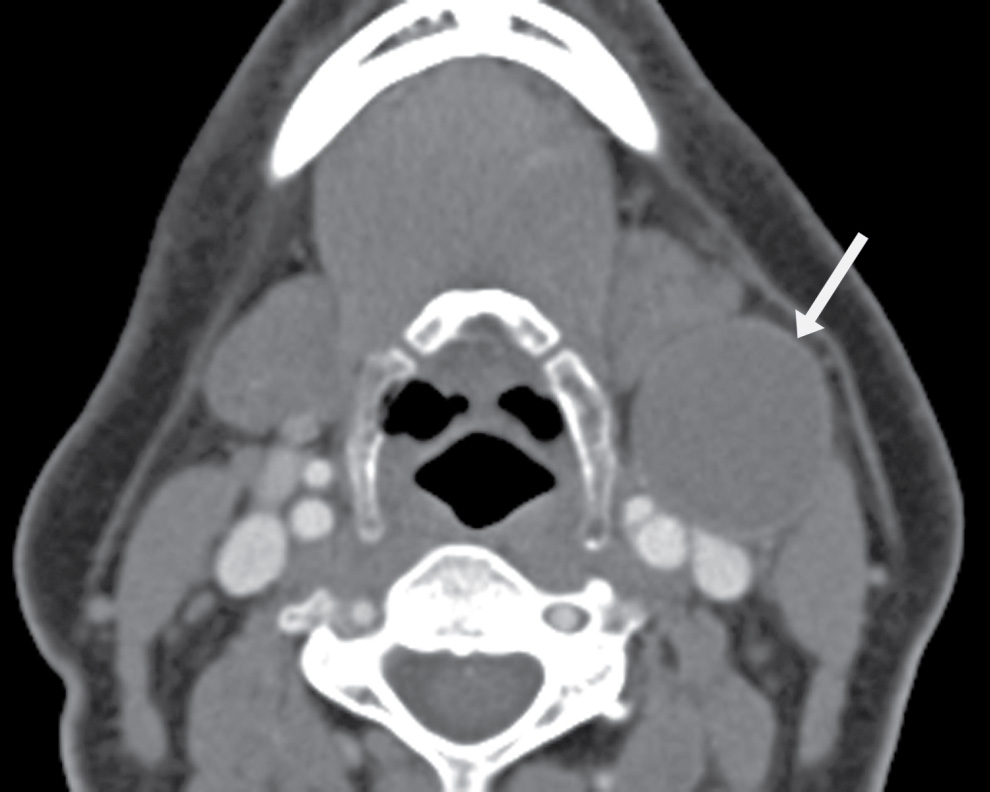
FIG. 25.5 Bailey type II second branchial cleft cyst. Axial contrast-enhanced CT image demonstrates a round, thin-walled cyst in the left neck, posterior to the submandibular gland, anterior to the sternocleidomastoid muscle, and lateral to the carotid (arrow). This is a Bailey type II second branchial cleft cyst.
Second BCC typically presents in young adulthood (average age 31 years) as a mass at the mandibular angle, frequently following upper respiratory tract infection or trauma, which causes their enlargement. On CT, it is well circumscribed, round, and hypodense. The wall is typically imperceptible or thin. However, if superinfected or otherwise inflamed (Fig. 25.6), the wall may become thicker, there may be surrounding fat stranding, and the internal density may become higher than that of simple fluid because of proteinaceous content.
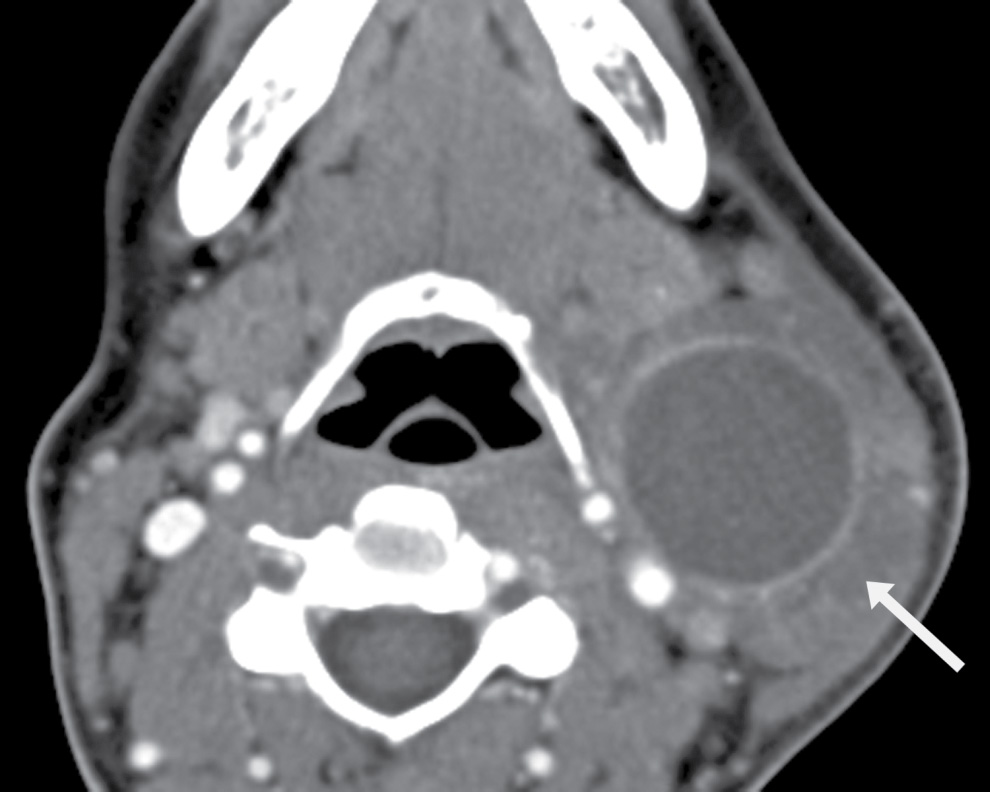
FIG. 25.6 Infected second branchial cleft cyst. Axial contrast-enhanced CT image shows a Bailey type II second branchial cleft cyst with superinfection. Note thickening and enhancement of the wall and fluid around the cyst infiltrating the surrounding fat planes (arrow).
The Bailey type II second BCC is in a location where level II nodes occur. A pathologic node that is cystic or necrotic can have a very similar imaging appearance as a second BCC (Fig. 25.7) and must be kept in mind as a differential consideration when a second BCC is suspected. Cystic nodal metastasis may be seen with a primary thyroid malignancy, while necrotic nodes are typically associated with squamous cell carcinomas. Increased thickness and mural nodularity of the lesion and increased age of the patient (above 40) would especially raise the suspicion for a pathologic node rather than a simple second BCC and should alert one to search for a potential site of primary malignancy in the head and neck, including the tonsil, oropharynx, and thyroid gland.
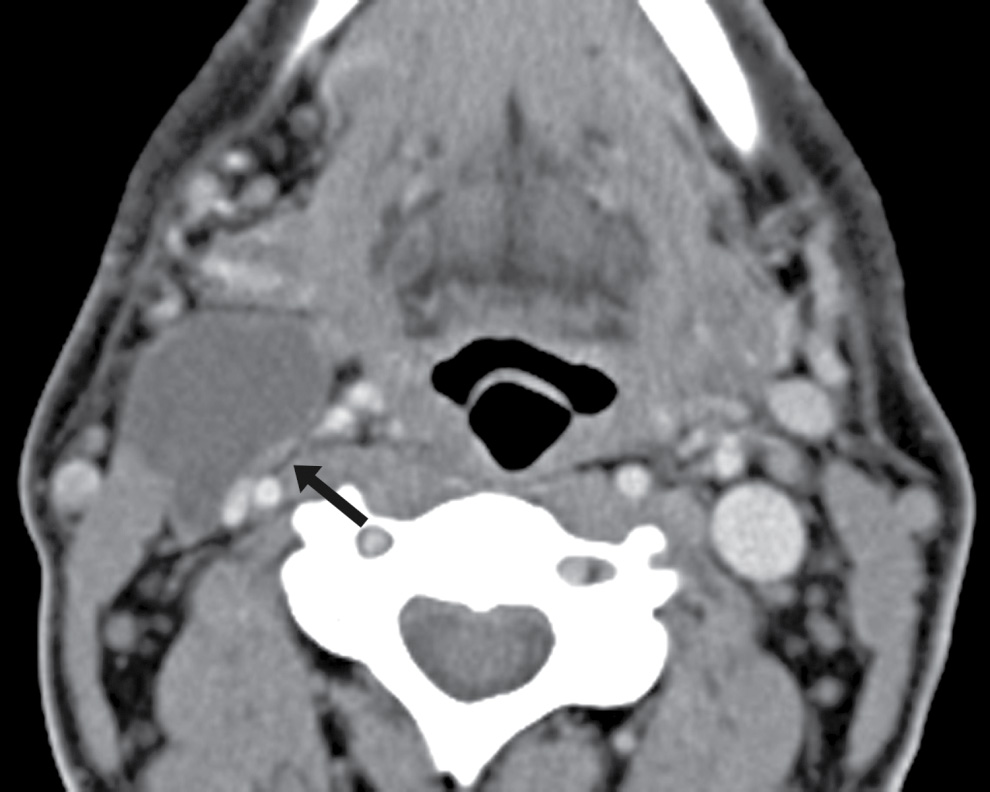
FIG. 25.7 Metastatic node. Axial contrast-enhanced CT image shows a cystic lesion in the right neck, posterior to the submandibular gland, anterior to the sternocleidomastoid muscle, and lateral to the carotid—in the classic location of a Bailey type II second branchial cleft cyst. However, there are areas of focal soft tissue thickening along the wall of the cyst (arrow). The patient is a 46-year-old man with a history of squamous cell carcinoma of the right tonsil. This is a biopsy-proven metastatic node.
Other differential diagnostic considerations for a cystic mass in the upper neck include suppurative adenopathy, lymphatic malformation, ectopic thymic cyst, cystic nerve sheath tumor, and dermoid or epidermoid cyst (5).
Calcific tendinitis of the longus colli
The longus colli muscles and the longus capitis muscles are neck flexors located in the prevertebral space. Anterior to the prevertebral space is the retropharyngeal space, and the two are separated by the deep layer of the deep cervical fascia. The retropharyngeal space contains mainly fat and lymph nodes. Anterior to it is the visceral space, and lateral to it is the parapharyngeal space on either side (8).
The retropharyngeal space may be involved by a deep neck infection, resulting in retropharyngeal edema (Fig. 25.8). Retropharyngeal edema may also be seen after radiation therapy, after surgery, or following penetrating trauma to the neck (9). If a retropharyngeal space lymph node (node of Rouviere) is involved by an infectious process and undergoes suppurative change, a retropharyngeal abscess will result, characterized on imaging by the classic hypodense fluid collection with an enhancing rim (Fig. 25.9).
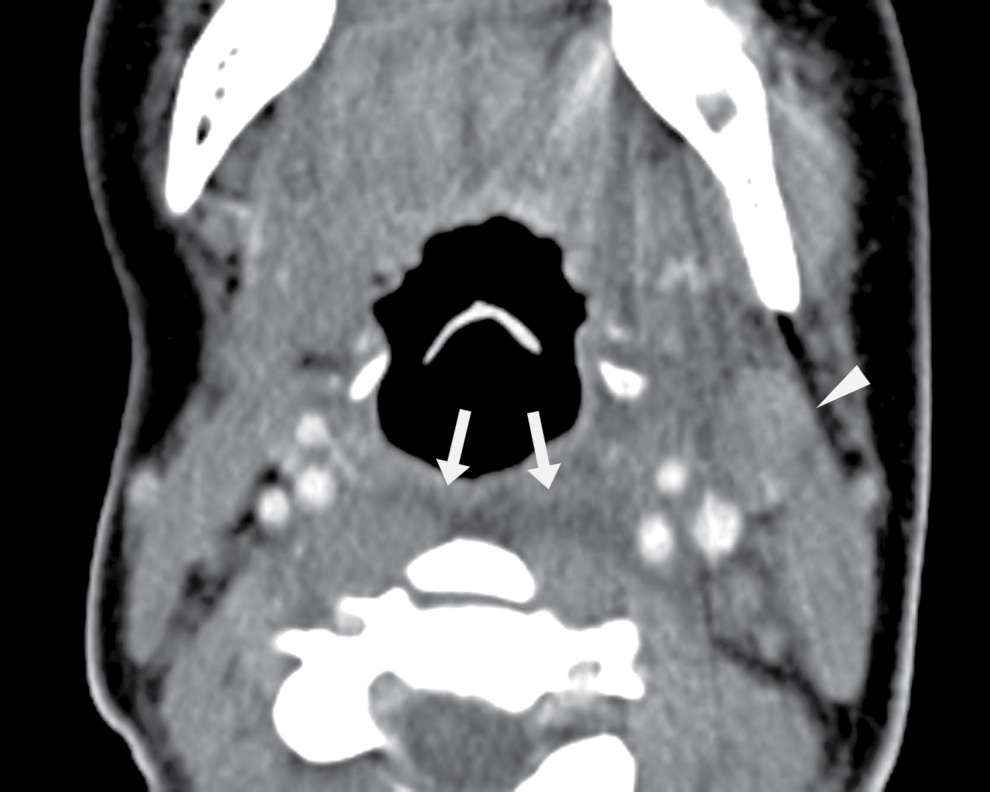
FIG. 25.8 Retropharyngeal edema. Axial contrast-enhanced CT image demonstrates retropharyngeal fluid compatible with edema/phlegmon (arrows). There is also reactive left level II lymphadenopathy (arrowhead). This was a 17-year-old female with 2 days of sore throat and dysphagia, trismus, and drooling.
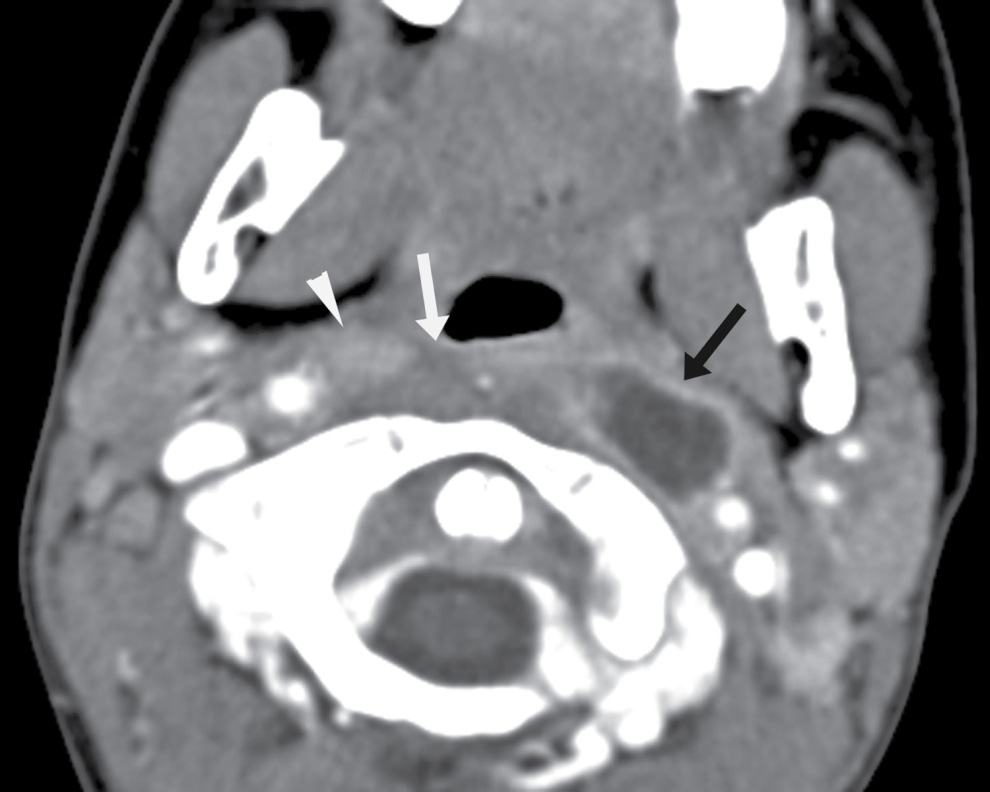
FIG. 25.9 Retropharyngeal abscess related to suppurative node of Rouviere in a 4-year-old boy. Axial contrast-enhanced CT image shows a rim-enhancing fluid collection in the left lateral retropharyngeal region that originated from an enlarged, suppurative node of Rouviere (black arrow). On the contralateral side is a mildly enlarged but nonnecrotic right node of Rouviere (arrowhead). There is also retropharyngeal edema (white arrow).
Calcific tendinitis of the longus colli, also known as calcific retropharyngeal tendinitis and acute calcific prevertebral tendinitis, is an inflammatory process involving the longus colli muscle. Deposition of calcium hydroxyapatite crystals in the superior oblique fibers of the longus colli tendons, typically at the C1 to C2 level, incites a secondary inflammatory tendinitis, with an associated retropharyngeal effusion (9). This is an uncommon entity and was initially described by Hartley in 1963 (10). It is usually seen in the third through sixth decades of life, although the condition has been reported in patients as young as age 21 and as old as 81 years. Patients present with acute onset of neck pain and stiffness associated with odynophagia and dysphagia. Clinically, there may be limited neck movement, a low-grade fever, mild elevation of erythrocyte sedimentation rate, and a mild leukocytosis (11). Conservative management with nonsteroidal anti-inflammatory agents and rest over a few weeks is usually sufficient for symptom resolution.
The imaging modality of choice is CT, which allows excellent visualization of calcification. Calcific density should be seen within the superiormost fibers of the longus colli tendons (Fig. 25.10), although the degree of calcification is variable, ranging from subtle to large, coarse, and globular (11). Fluid should be present in the retropharyngeal space without rim enhancement (Fig. 25.11). To distinguish this entity from an intrinsic retropharyngeal space infection, Eastwood et al. (9) summarized four findings that are specific to and diagnostic of calcific tendinitis of the longus colli:
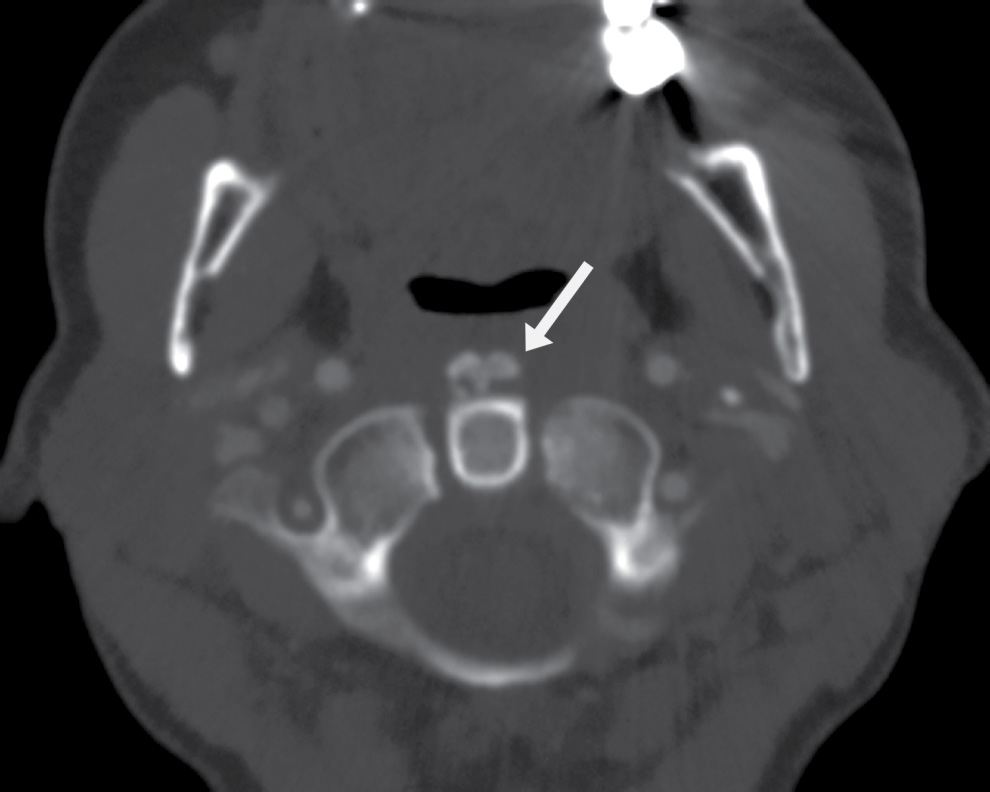
FIG. 25.10 Calcific tendinitis of the longus colli. Axial CT image in bone algorithm clearly delineates coarse calcific density in the superior aspect of the longus colli muscles (arrow). This is seen at the C1 to C2 level.
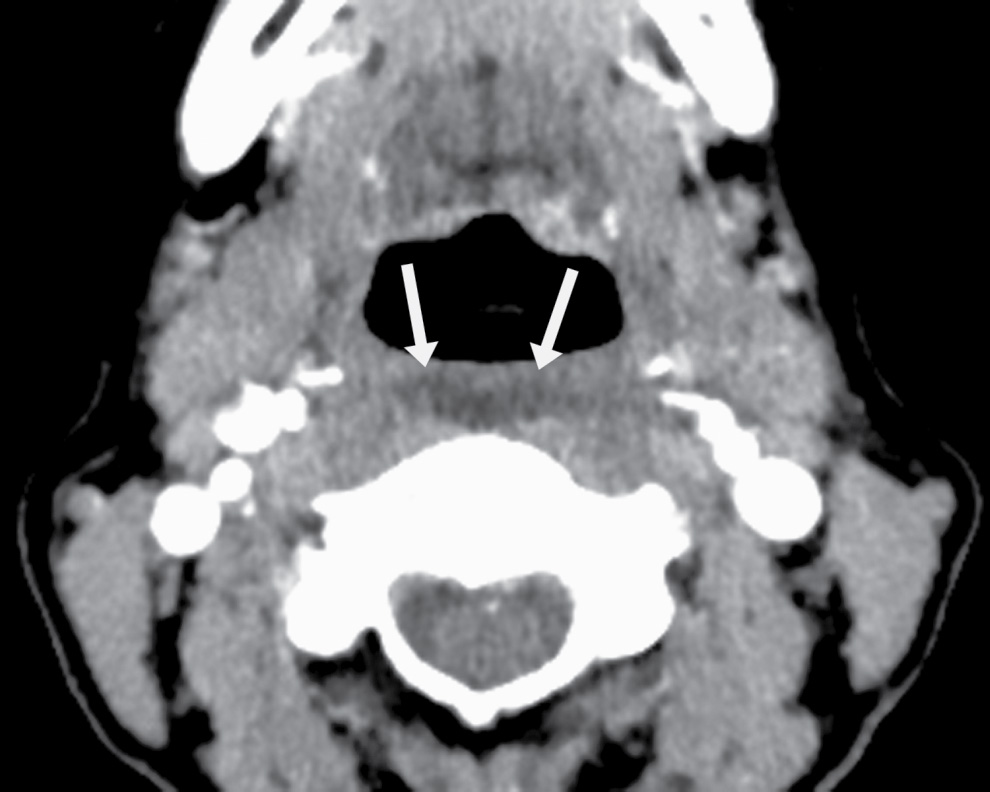
FIG. 25.11 Calcific tendinitis of the longus colli. Axial CT image in soft tissue algorithm in the same patient as in Fig. 25.10 demonstrates fluid in the retropharyngeal space (arrows). This fluid smoothly expands the retropharyngeal space in all directions and does not have rim enhancement. There are no regional enlarged or suppurative nodes.
- The fluid in the retropharyngeal space smoothly expands the space in all directions.
- There is no enhancing wall surrounding this fluid.
- There are no associated suppurative retropharyngeal space lymph nodes with low-attenuation centers.
- There are pathognomonic tendinous calcifications within the longus colli.
In addition, there should not be bone destruction in the adjacent cervical vertebrae.
Knowledge of this entity and familiarity with its imaging appearance are key to avoiding erroneous diagnoses such as retropharyngeal space infection, myositis ossificans, and neoplasm such as osteosarcoma.
Hemitongue denervation
Motor innervation of the intrinsic and extrinsic (with the exception of the palatoglossus) muscles of the tongue is by the hypoglossal nerve (cranial nerve XII). When there is damage to the hypoglossal nerve, related to tumor or prior surgery such as radical neck dissection, for example, denervation change of the ipsilateral hemitongue occurs.
In the subacute phase, denervated muscles appear iso- to hypointense relative to normal muscle on T1-weighted MR images and hyperintense on T2-weighted images. This may be due to increased water content within the enlarged interstitial spaces of the affected muscles. Over time, there is increasing fatty infiltration, resulting in an increase in T1 signal (Fig. 25.12) (12). There may be increased enhancement of the involved hemitongue compared to normal muscle, perhaps secondary to increased concentration of vessels in the muscles as atrophy progresses, or increased contrast accumulation in the more prominent interstitial spaces of the atrophic muscles. In all stages, the affected hemitongue is hypodense on CT (Figs. 25.13 and 25.14).
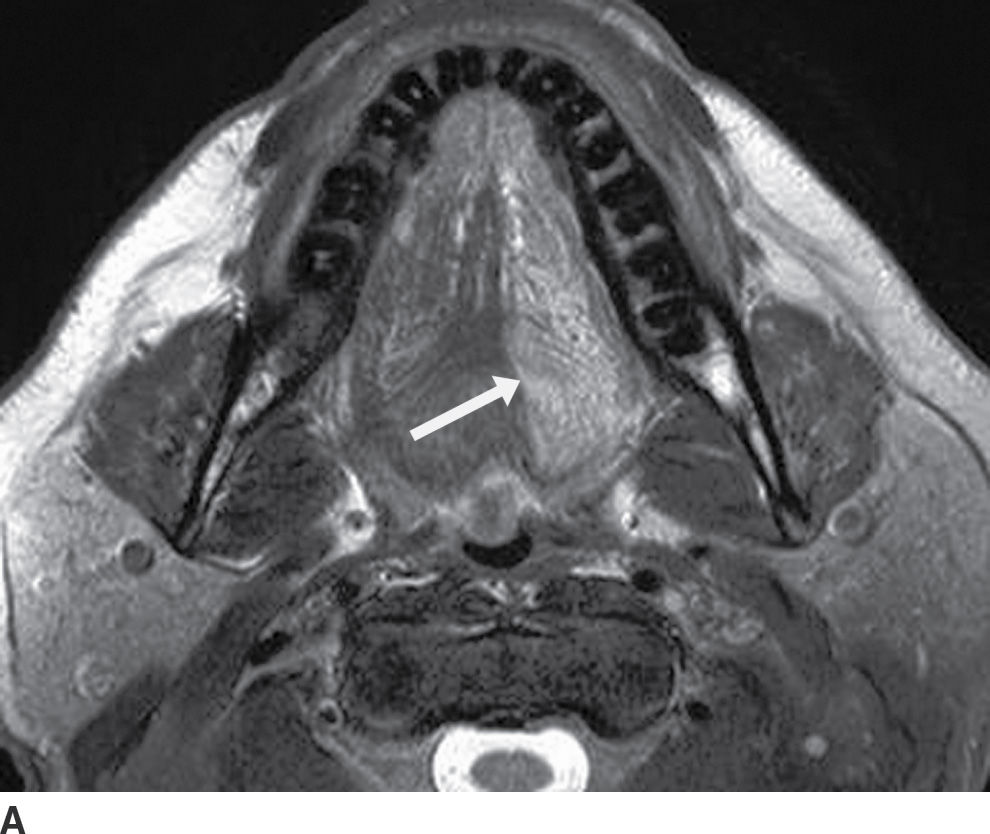
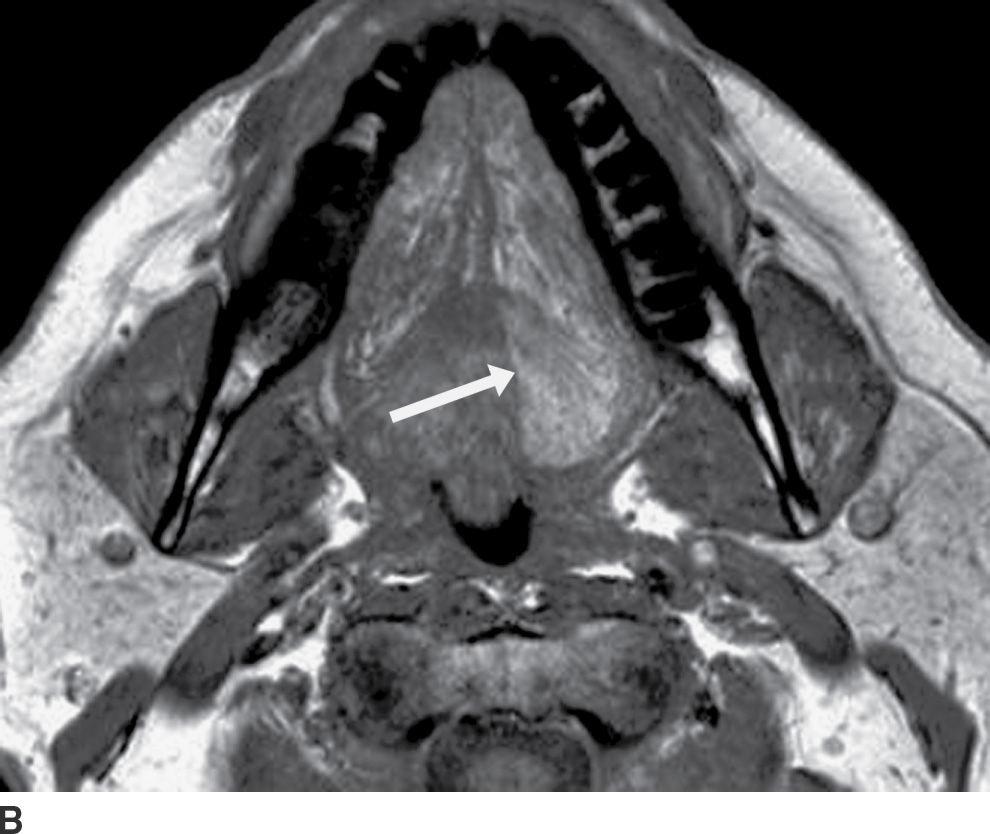
FIG. 25.12 Denervation of the left hemitongue related to malignancy at the base of the tongue and floor of the mouth. A,B: Axial T2-weighted and T1-weighted images, respectively, demonstrate abnormally increased signal intensity in the left hemitongue relative to normal muscle on both sequences (see arrows, images A and B). In this late subacute phase, there is increased signal on T1-weighted sequence from fat infiltration, but the volume of the hemitongue is still relatively normal, without significant atrophy or posterior prolapse as yet.
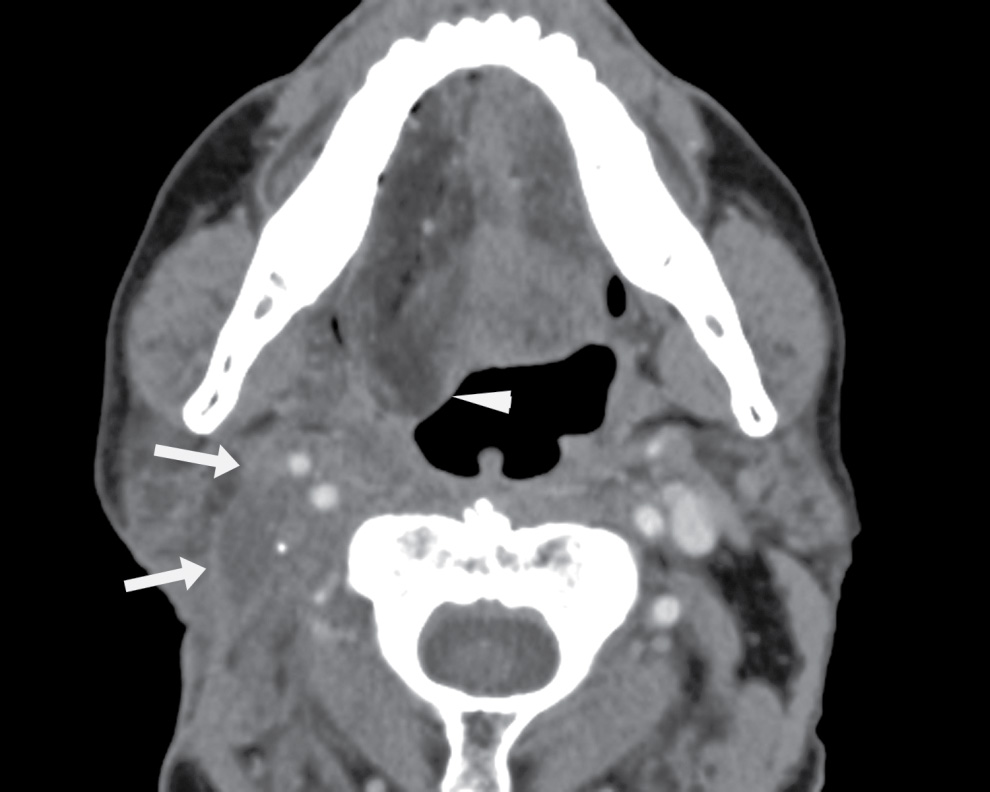
FIG. 25.13 Denervation atrophy of the right hemitongue related to prior neck dissection and radiation. Axial contrast-enhanced CT image demonstrates fatty infiltration of the right hemitongue. It is posteriorly prolapsed (arrowhead), giving the appearance termed “denervation pseudohypertrophy.” The patient is a 66-year-old man with a history of T3N0M0 squamous cell carcinoma of the right tonsil, status postchemoradiation, and right radical neck dissection. Note thickened soft tissue in the right neck around and posterior to the carotid sheath (arrows), related to prior surgery and radiation; the hypoglossal nerve courses through this region.
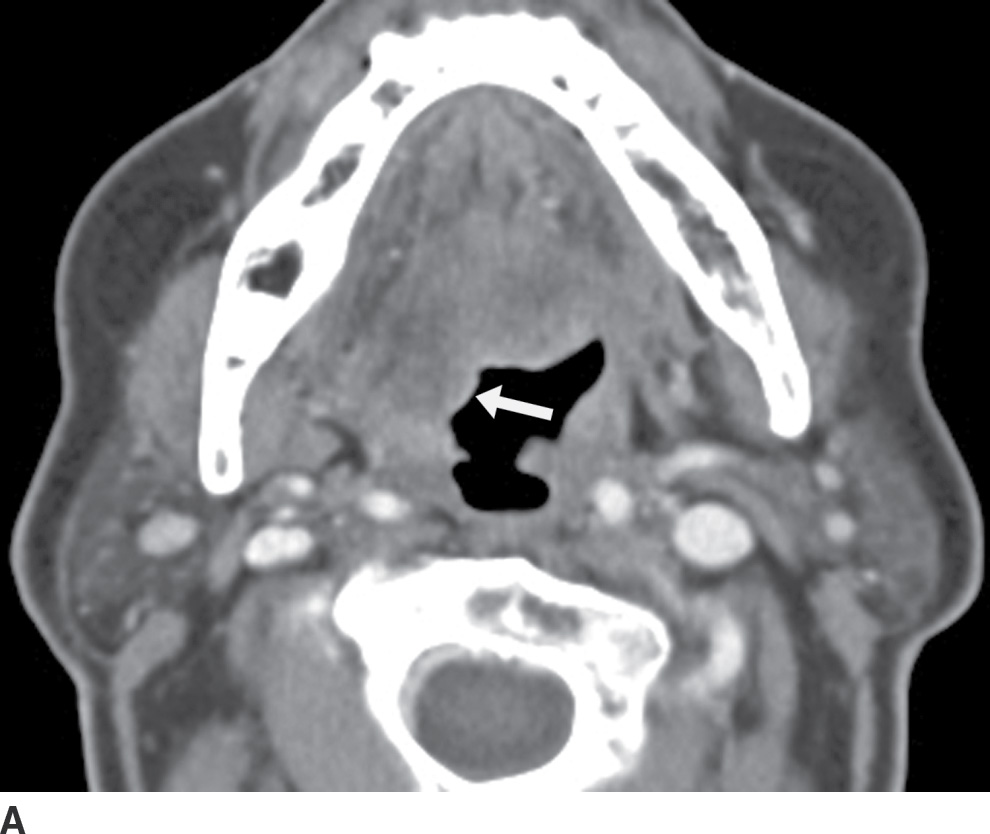
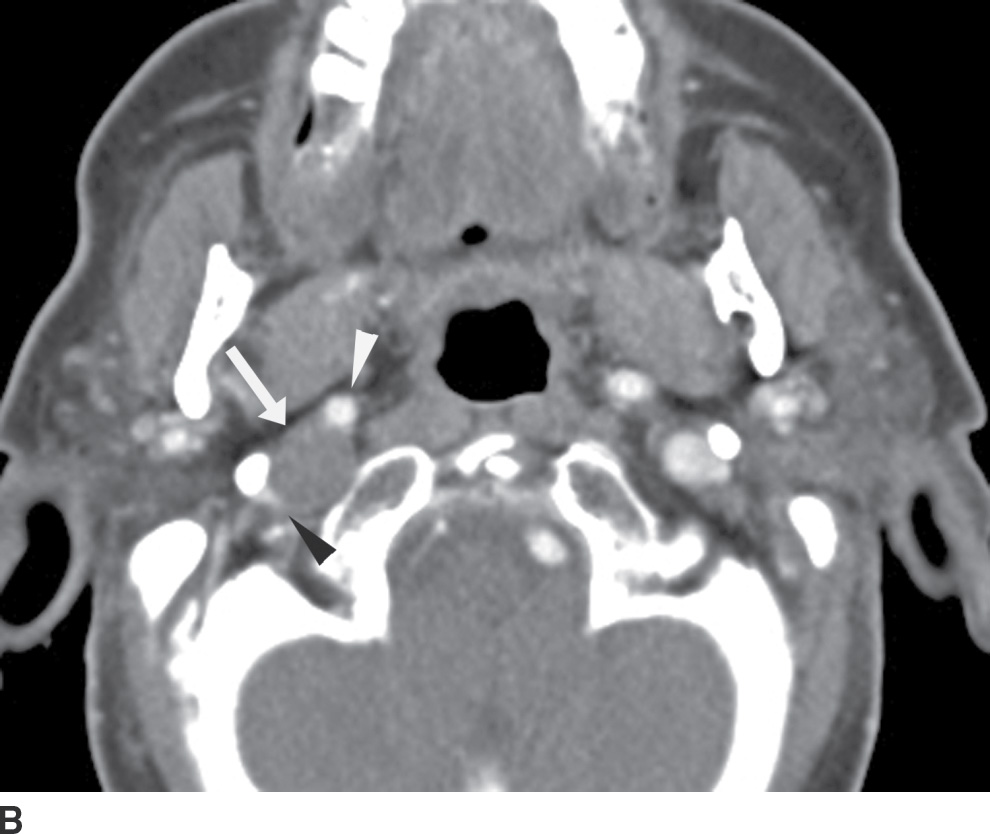
FIG. 25.14 Denervation atrophy of the right hemitongue related to a vagal schwannoma. A: Axial contrast-enhanced CT images demonstrate mild fatty infiltration and posterior prolapse of the right hemitongue (arrow). B: An image at the level of the skull base demonstrates a round mass (arrow) lateral to the internal carotid artery (white arrowhead) and medial to the internal jugular vein (black arrowhead), compatible with a vagal schwannoma, likely compressing the hypoglossal nerve, which descends within the carotid sheath just posterior to the vagus nerve.
Initially, with increased water content within the affected tongue muscles, the volume of the hemitongue may actually increase. Over time, muscle atrophy will lead to decrease in muscle volume. However, loss of muscle tone and fatty infiltration can lead to enlargement and posterior prolapse of the affected hemitongue with increased T1 signal, the so-called denervation pseudohypertrophy (13). True denervation hypertrophy is characterized by muscle enlargement without MR signal abnormality.
Summarizing the above description, the appearance of a denervated hemitongue depends on the chronicity of denervation. Acutely, the hemitongue demonstrates increased T2 signal, abnormal contrast enhancement, and increased muscle volume. This may be difficult to distinguish from an inflammatory or neoplastic process. Clinical history and time course are paramount to aid in image interpretation.
In the early chronic stage, T1 signal starts to be more hyperintense due to fatty infiltration. Signal becomes less hyperintense on T2-weighted sequence, and there is decreasing or no enhancement. Muscle volume loss may not be conspicuous yet. In the late chronic stage, there is extensive fatty replacement of the hemitongue. Volume loss will be increasingly apparent unless there is denervation pseudohypertrophy, related to extensive fat infiltration or to loss of muscle tone causing posterior prolapse of the hemitongue (13). The appearance of a nonatrophied contralateral hemitongue or an enlarged/prolapsed denervated hemitongue should not be mistakenly attributed to neoplastic involvement (Fig. 25.15).
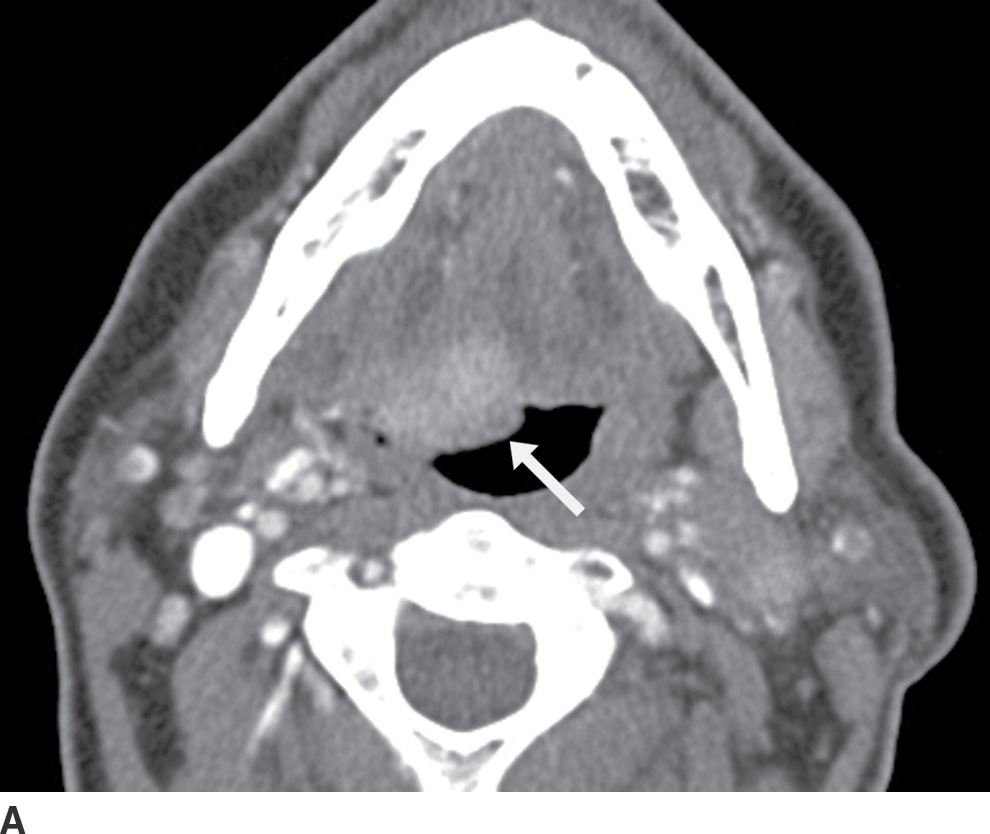
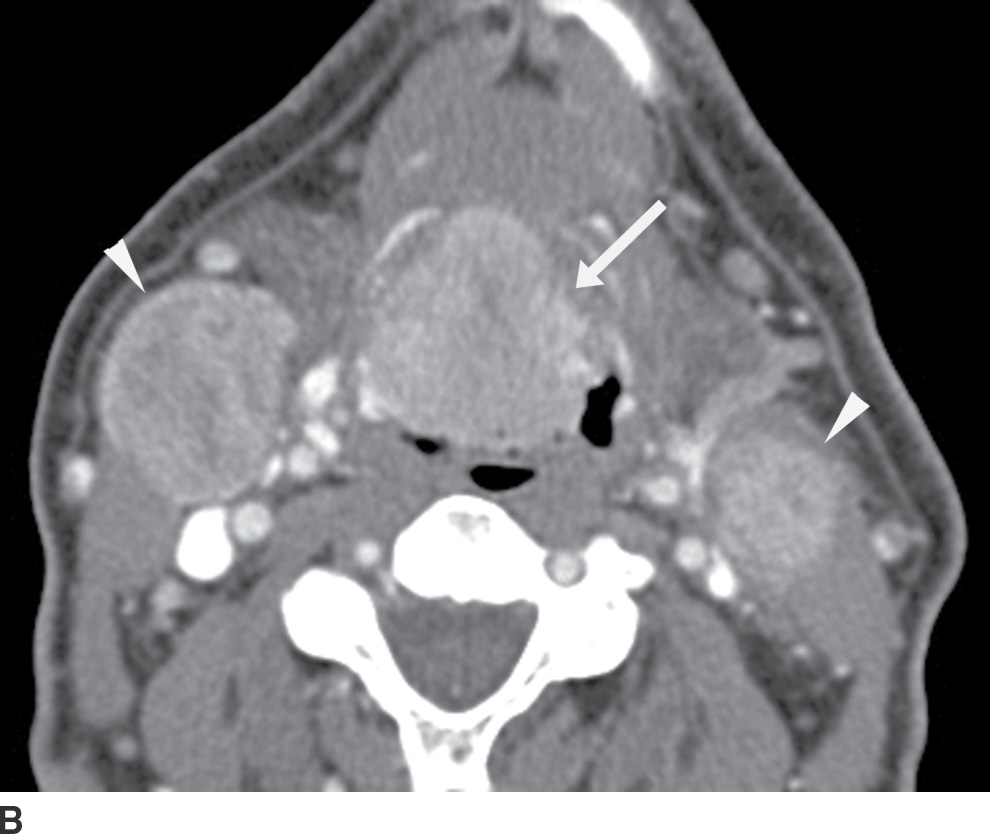
FIG. 25.15 Squamous cell carcinoma of the right base of tongue. A: Axial contrast-enhanced CT image demonstrates an enhancing mass at the right base of tongue (arrow), causing mass effect and “posterior prolapse.” However, the involved hemitongue is hyperdense/enhancing and not hypodense from fatty infiltration. B: An axial image more caudally shows that the base of tongue tumor, in fact, extends inferiorly into the vallecula (arrow). There are bilateral necrotic metastatic nodes (arrowheads).
Zuckerkandl tubercle
The Zuckerkandl tubercle (ZT) is a protuberance found at the posterolateral border of the thyroid lobes (14). The thyroid gland forms in utero from a median thyroid anlage arising from a midline endodermal thickening between the first and second branchial arches, situated just caudal to the two medial tongue swellings that would give rise to the anterior and posterior tongue. This is the area that will become the foramen cecum. This thickening forms the thyroid diverticulum, which then bifurcates into two lateral anlagen on either side of the median anlage. It descends in the neck, acquiring cells from the surrounding endoderm, and undergoes cellular proliferation and maturation (15,16). As the thyroid elements migrate caudally, C cells in the ventral portion of the fourth pharyngeal pouch (alternately attributed to the fifth–sixth pouch) localize to a transient embryologic region called the ultimobranchial body on the lateral aspect of each side of the neck. The ultimobranchial bodies then migrate medially, eventually merging with the descending anlagen anterior to the cricoid cartilage forming the definitive thyroid gland (17). It is at this point of fusion that the Zuckerkandl tubercle occurs. In surgery, the ZT is a reliable landmark for locating the upper parathyroid glands, the lower thyroid artery, and the recurrent laryngeal nerve.
The ZT can vary in size, ranging from being unrecognizable to larger than 1 cm (18). When large, it can be broad based against the main thyroid lobe (Fig. 25.16A), nodular and pedunculated with a narrow neck (Fig. 25.16B), or even appearing discontinuous from the thyroid lobe at times (Fig. 25.16C) (19). This nodular subtype of ZT is common and is seen more often on the right. With this nodular configuration, the ZT may be mistaken on imaging for a thyroid mass, or a mass (Fig. 25.17) or node (Fig. 25.18) extrinsic to the thyroid gland, especially if there is streak artifact on a CT from the shoulders, lowering attenuation in that particular region of the neck. If it is difficult to determine on CT whether a nodular structure represents the ZT or a pathologic finding, an ultrasound should be performed. If the ultrasound provides definitive characterization, then biopsy can be avoided.
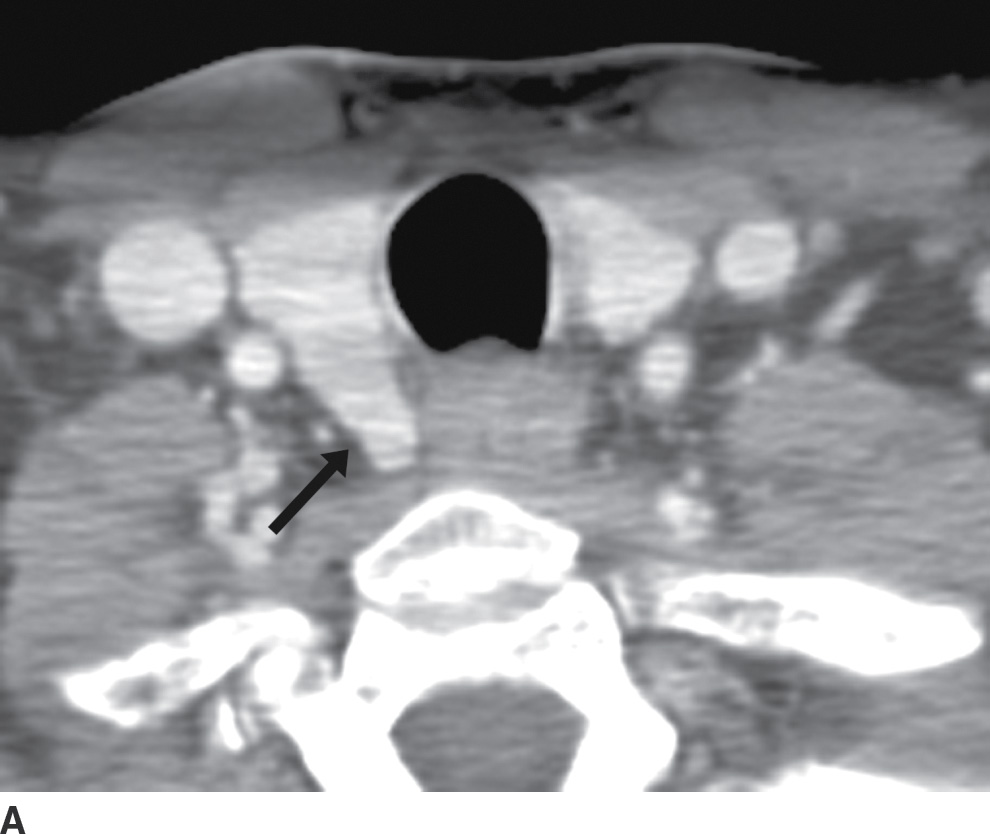
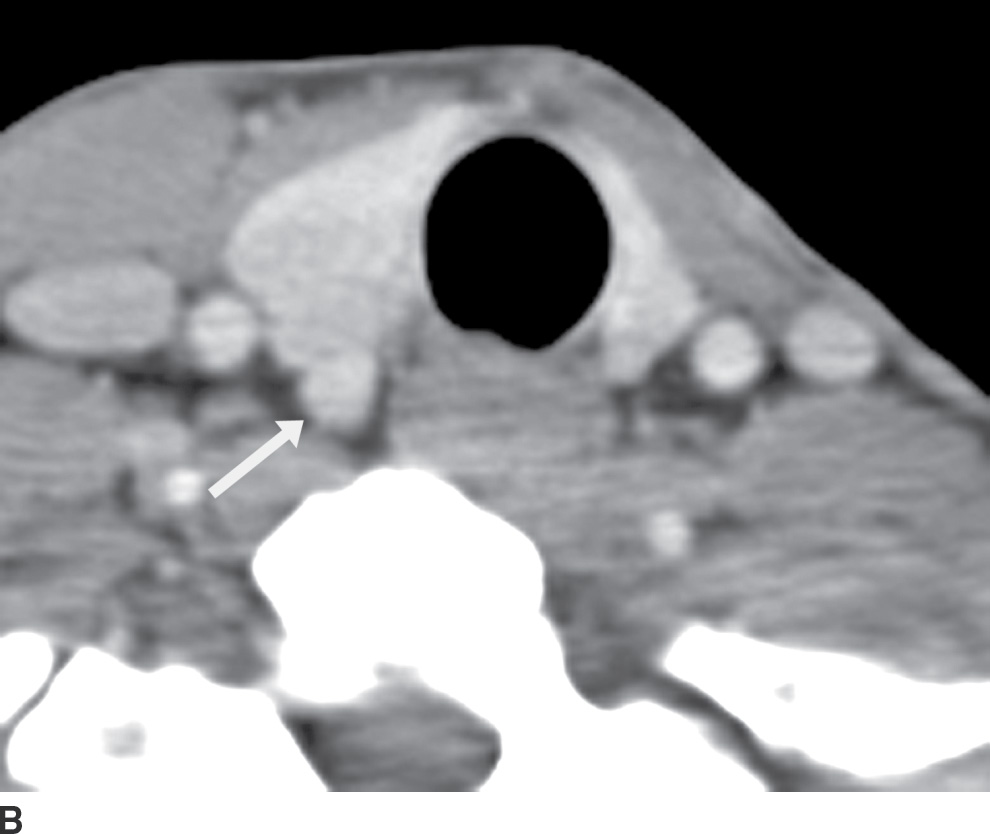
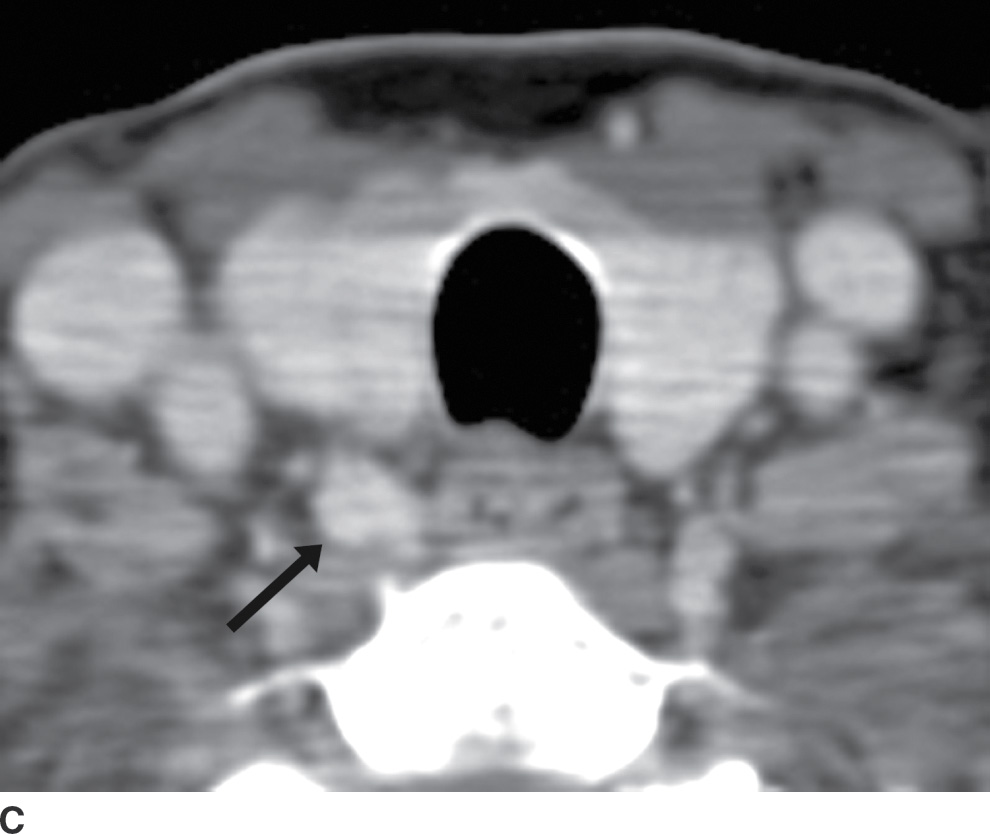
FIG. 25.16 A: Zuckerkandl tubercle appearing as a broad-based extension of the main thyroid parenchyma. Axial CT image demonstrates a broad-based protuberance at the posterior aspect of the right thyroid lobe, representing the Zuckerkandl tubercle (arrow). B: Zuckerkandl tubercle appearing as an exophytic nodule. Axial CT image demonstrates a nodule isodense to thyroid parenchyma, appearing exophytic off of the posterior edge of the right thyroid lobe (arrow). This is posterior extension of normal thyroid parenchyma as the Zuckerkandl tubercle. C: Zuckerkandl tubercle appearing as a discrete nodule. Axial CT image demonstrates a nodule (arrow) isodense to thyroid parenchyma but discrete from the main thyroid lobe. Images more cranially (not shown) show that this nodule is actually contiguous with the gland.
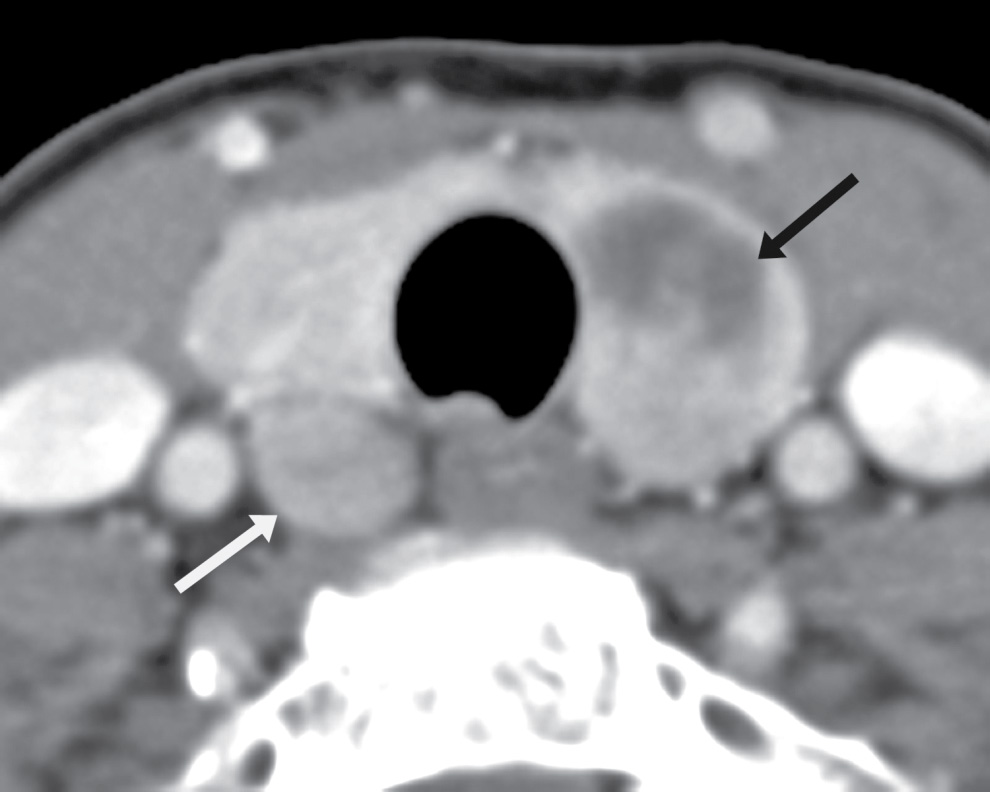
FIG. 25.17 Parathyroid adenoma. Axial CT image shows a heterogeneous solid and cystic mass in the left thyroid lobe (black arrow) that was a biopsy-proven papillary thyroid carcinoma. In this context, there was concern that the rounded lesion posterior to the right thyroid lower lobe (white arrow) could represent a metastatic node, or another focus of papillary carcinoma. The right lesion was sampled via ultrasound-guided fine needle aspiration biopsy and proved to be a parathyroid adenoma. The patient subsequently underwent total thyroidectomy and excision of the parathyroid adenoma.
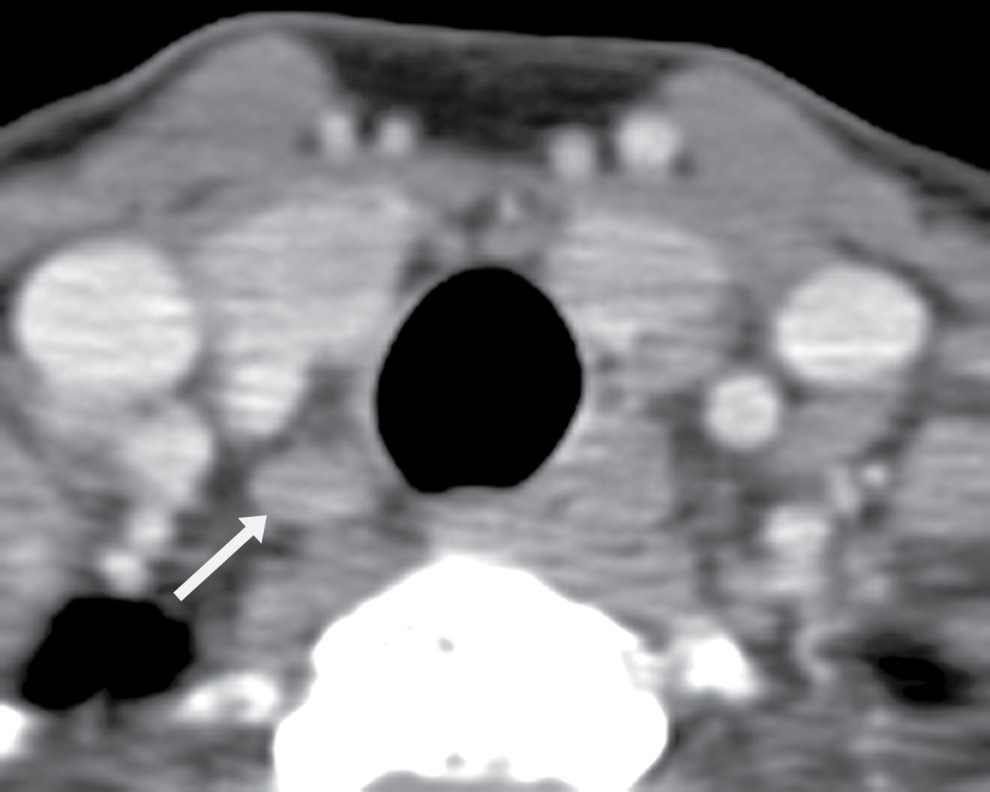
FIG. 25.18 Lymph node at the tracheoesophageal groove. Axial CT image shows a small nodule (arrow) hypodense to the thyroid parenchyma, representing a lymph node.
Mimics in the Orbit
Subperiosteal hematoma
The orbital periosteum consists of fibrous tissue, which completely lines the bony orbit. It is firmly attached at the orbital margin, at the bony sutures, at the orbital fissures and foramina, and at the lacrimal crest. Elsewhere, it is loosely attached and may be separated from the bony orbit by fluid collections (20). When these occur, they appear as lenticular fluid collections, which are sharply marginated and abut the bony wall of the orbit.
These fluid collections may contain either blood or pus, depending on the clinical circumstance. In the case of facial trauma, the collections are hemorrhagic. In the case of sinusitis, they typically represent subperiosteal abscesses due to infection, which has been transmitted across the thin bone of the paranasal sinuses.
The more rarely seen nontraumatic subperiosteal orbital hemorrhage can mimic subperiosteal abscesses because they occur without prior trauma (21). Nontraumatic subperiosteal orbital hemorrhage may occur spontaneously in the setting of increased venous pressure, often due to vomiting. They are seen most commonly along the orbital roof. Just as with subperiosteal abscesses, the hemorrhages appear as crescentic collections along the bony orbital wall, separated from the rest of the orbital fat by the periosteum. They can occur in the setting of sinusitis, leading to further confusion.
The clinical description of sudden-onset pain and proptosis, particularly in the setting of vomiting, may alert the radiologist to the possibility of a subperiosteal orbital hemorrhage, even when the sinuses are not opacified. On CT, the hematomas appear as somewhat hyperdense collections along the orbital wall. On MRI, the collections are heterogeneous in appearance, reflecting the presence of blood products (Fig. 25.19). Susceptibility-weighted images can be particularly useful in diagnosis.
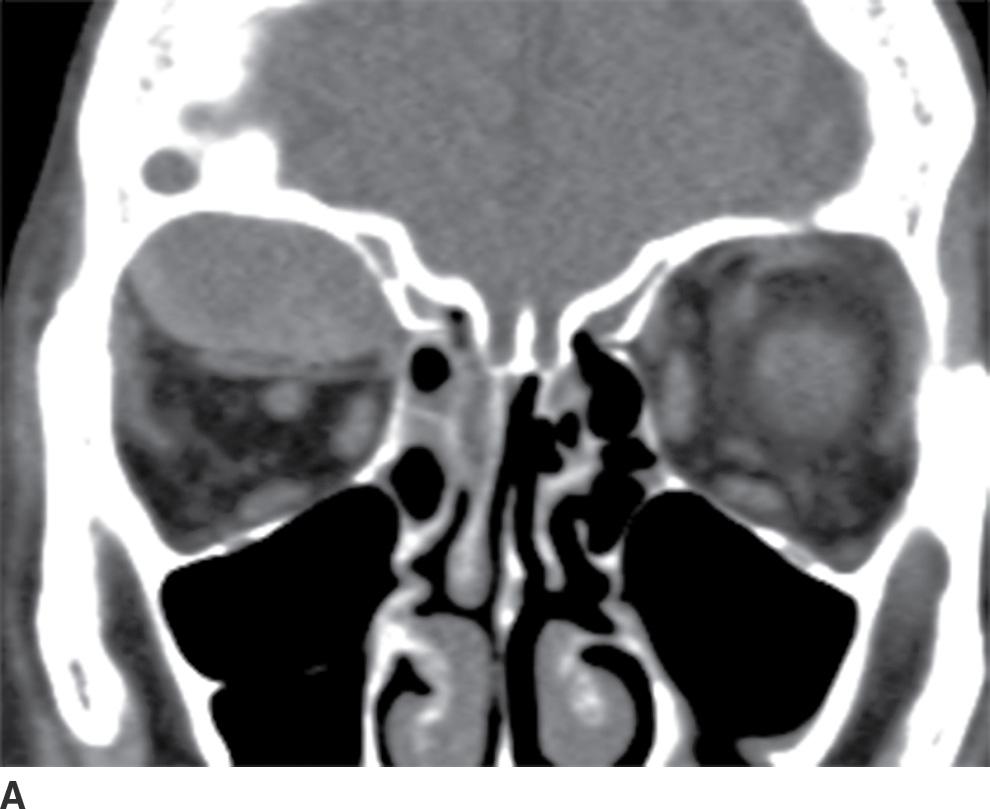
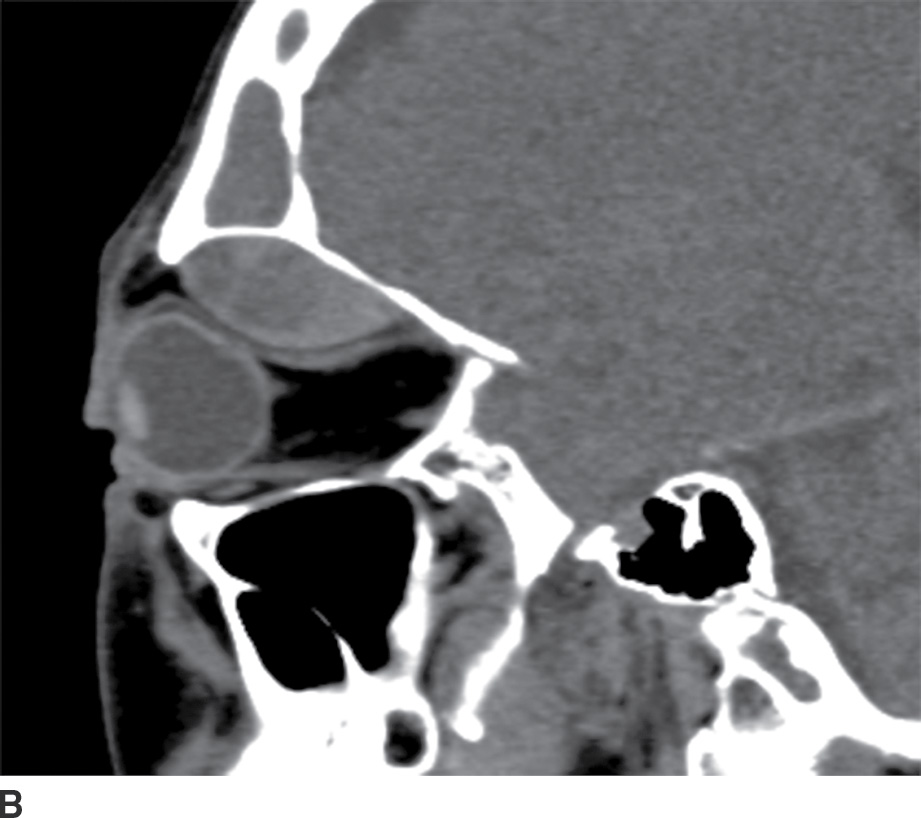
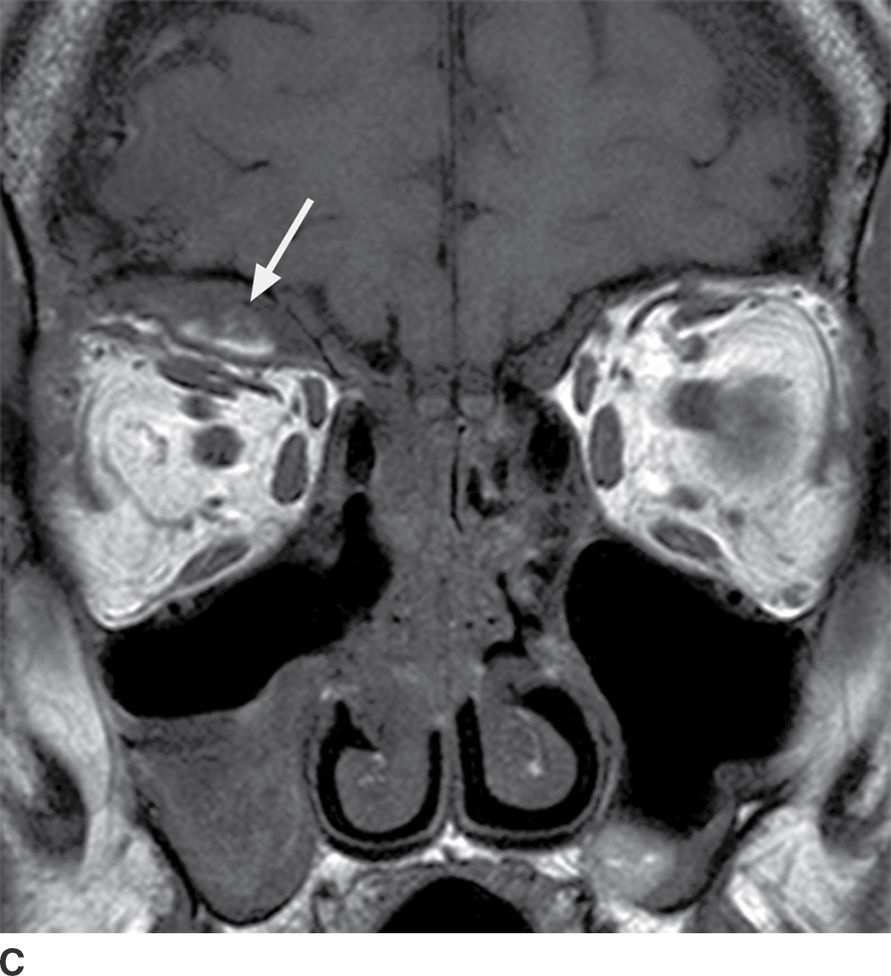
FIG. 25.19 Spontaneous subperiosteal orbital hematoma. A,B: Coronal and sagittal CT scans, respectively, in a patient who developed proptosis after Valsalva show a lens-shaped, heterogeneous fluid collection along the superior orbital roof, sharply demarcated from the orbital fat. There is no associated preseptal soft tissue swelling, and there is increased density in the posterior aspect of the fluid collection on the sagittal image, reflecting layering blood products. C: On T1-weighted MRI without contrast, there is hyperintense material within the collection (arrow), reflecting blood products.
Related posts:
Stay updated, free articles. Join our Telegram channel

Full access? Get Clinical Tree


