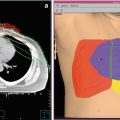
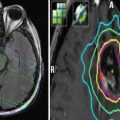
Fig. 1
(a) An example of 3D conformal radiotherapy planning based on CT scans acquired under free breathing conditions. The gross tumor volume (GTV) and planning target volume (PTV) are delineated. (b). The same patient is planned for CyberKnife treatment. Note the smaller margin from GTV to PTV. The PTV is surrounded by the 80 % isodose line
2 EBRT for Local/Regional Intrathoracic Recurrences After Previous EBRT
EBRT was also used to treat local/regional intrathoracic recurrences after previous EBRT for lung cancer, mostly NSCLC. Currently, there seems to be a total of 13 reports (Tables 1, 2, and 3) in the English literature with only 435 patients reported, so far, using radiotherapy techniques other than SABR. They cover the time period of more than three decades (1982–2015). In spite of existing reports and gradually documented effectiveness of RT in this setting, it is still questionable which proportion of patients initially treated with chest RT eventually undergo reirradiation during the natural course of the disease. To investigate this issue, Estall et al. (2007) examined the proportion of patients who received more than one series of RT for lung cancer. Although the initial RT utilization rate has been estimated to be 76 % (Delaney et al. 2003) accounting for the first RT episode delivered, in the study of Estall et al. (2007) it was 52 %. While initial RT was delivered to local disease in the chest in most cases (79 %), the second (22 %) and third (21 %) RT treatments were offered much less frequently. As the number of treatment episodes increased, the mean duration between each episode decreased. The total dose and number of fractions also decreased, possibly as reflection of deteriorating performance status (PS) and worsening prognosis of patients in the end stage of their disease and their life. Unfortunately, the study covered the data from 2 years (1993 and 1996) and not prolonged periods of time, limiting our understanding and applicability of the results. Additionally, there is a general lack of data provided from other regions/institutions. It is certainly possible that in different settings institutions would have different initial RT utilization rates as well as reirradiation rates.
Table 1
Patient and tumor characteristics (non-SABR studies)
Author (year) | N pts | Sex (M/F) | Age range (median) | Initial tumor staging, % of pts | Histology, % of pts | PS at re-RT, range (median) | Time interval in months from first to second RT (median) |
|---|---|---|---|---|---|---|---|
Green and Melbye (1982) | 29 | 23/6 | 35–85 (57) | n.s. | SCC-66 % ADC-14 % LC-14 % SCLC-6 % | n.s. | 3–40 (10) |
Jackson and Ball (1987) | 22 | 21/1 | 45–76 (62) | n.s. | SCC-50 % ADC-36 % other-14 % | n.s. | 5.7–48.5 (15) |
Montebello et al. (1992) | 30 | 18/12 | 45–83 (62) | I–II-23 %; IIIA-47 % | SCC-53 %; ADC-27 % LC-10 % Other-10 % | KPS 40–100 (60) | n.s. |
Gressen et al. (2000) | 23 | 13/10 | 47–87 (66) | n.s. | SCC-35 % ADC-30 % LC-9 % Other-27 % | n.s. | 3–156 (15) |
Okamoto et al. (2002) | 34 | 29/5 | 38–85 (69) | I–II-9 % IIIA-29 % IIIB-53 % IV-9 % | SCC-50 % ADC-18 % LC-6 % Other-24 % | PS0-1 = 41 % PS ≥2 = 59 % | 5–87 (23) |
Wu et al. (2003) | 23 | 21/2 | 43–79 (68) | II-30 % III-70 % | SCC-40 % ADC-30 % SCLC-30 % | KPS 70–100 | 6–42 (13) |
Kramer et al. (2004) | 28 | 27/1 | 52–83 (68) | n.s. | all NSCLC | n.s. | 6–72 (17) |
Tada et al. (2005) | 19 | 17/2 | 49–84 (64) | IIIA = 21 % IIIB = 79 % | SCC-74 % ADC-21 % LC-5 % | PS0-1 = 42 % PS2-3 = 58 % | 5–60 (16) |
Ebara et al. (2007) | 44 | n.s. | 49–86 (71) | n.s. | SCC-43 % ADC-27 % SCLC-20 % Other-10 % | PS0-1 = 86 % PS2-3 = 14 % | 5.8–47.2 (12.6) |
Cetingoz et al. (2009) | 38 | 35/3 | 33–80 (58) | IIB = 5 % IIIA = 10 % IIIB = 84 % | SCC-61 % ADC-13 % Other-26 % | n.s. | 1–47 (9) |
Ohguri et al. (2012) | 33 | 30/3 | 45–85 (68) | IB: 2 (6 %) IIB: 4 (12 %) IIIA : 7 (21 %) IIIB: 10 (30 %) IV: 4 (12 %) Postoperative recurrence: 6 (18 %) | SCC: 16 (48 %) ADC: 15 (45 %) Other: 2 (6 %) | PS0 : 3 (9 %) PS1: 21 (64 %) PS2: 9 (27 %) (median, PS1) | 1.1–28.2 (7.9) |
Yoshitake et al. (2013) | 17 | 15/2 | 69–88 (81) | Medically inoperable or refusing surgery (all early NSCLC) | SCC: 9 (53 %) ADC: 3 (18 %) NSCLC, NOS: 1 (6 %) Unknown: 4 (24 %) | PS0: 3 (18 %) PS1: 8 (47 %) PS2: 5 (29 %) PS3: 1 (6 %) (median, PS1) | 6.3–35.5 (12.4) |
Kruser et al. (2014) | 48 | 29/19 | 40–81 (61) | I: 2 (4 %) II: 5 (10 %) III:20 (42 %) IV:10 (21 %) SCLC: 11 (23 %) | SCC: 17 (35 %) Non-SCC: 15 (31 %) NSCLC NOS: 5 (10 %) SCLC: 11 (23 %) | n.s. | n.s. (19.1) |
Tetar et al. (2015) | 30 | 16/14 | 44–80 (63) | n.s. | n.s. | PS 0-2 (1) | 5–189 (30) |
Table 2
Treatment characteristics (non-SABR studies)
Author | Initial RT dose Gy (median) | Re-RT dose Gy (median) | Cumulative RT dose Gy (median) | RT fields and/or volume | RT field size in cm2 (median) | % pts receiving CHT |
|---|---|---|---|---|---|---|
Green and Melbye (1982) | 40–65 (53) | 6–54 (35) | 60–166a (82) | Tumor only = 76 % Uninvolved mediastinum = 24 % | average, 80 | 24 |
Jackson and Ball (1987) | 50–61 (55) | 20–30 (30) | 70–90 (85) | Volume encompassing the disease causing symptoms | n.s. | n.s. |
Montebello et al. (1992) | 28–66 (60) | 15–57 (30) | 43–122a (88) | Large fieldsb = 4–25 pts Tumor only = 30 pts | (96) (85) | 23 % |
Gressen et al. (2000) | 25–66 (59) | 6–40 (30) | 60–101 (86) | Tumor + 1–2 cm | 30–315 (81) | 61 % |
Okamoto et al. (2002) | 30–80 (66) | 10–70 (50) | 56.5–150 (110) | Radical = tumor only Palliative = affected region | 20–238 (65) | 47 % |
Wu et al. (2003) | 30–78 (66) | 46–60 (51) | n.s. | Tumor + 1.5–2.0 cm | 42–210 (104) | 100 % |
Kramer et al. (2004) | 40–60 (n.s.) | 16 (16) | 56–76 (n.s.) | “Limited RT” | n.s. | n.s. |
Tada et al. (2005) | 50–70 (n.s.) | 50–60 (50) | n.s. | “Limited RT” | 30–204 (64) | 6 % |
Ebara et al. (2007) | 50–70-(60) | 30–60 (40) | 80–130 (102) | Tumor + 5–10 mm | n.s. | 57 % |
Cetingoz et al. (2009) | 29–67 (30) | 5–30 (25) | n.s. | Tumor + 1–2 cm | 25–245 (89) | 24 % |
Ohguri et al. (2012) | 30–85 (70) | 29–70 (50) | 70–146 (115) | 3D PTV = GTV + 7–20 mm | 24–386 (112) | 15 (45 %) |
Yoshitake et al. (2013) | 48–60 (48) | 60–70 (60) | 168–189.6 (Gy10) (177.6) | 3D and 4D Tumor only | n.s. | 4 (23.5 %) |
Kruser et al. (2014) | 30–80.5 (57) | 12–60 (30) | 42–140.5 (87) | 3D, IMRT PTV = GTV + 5–11 mm | n.s. | 12 (32 %) |
Tetar et al. (2015) | 24–70 (60) | 39–66 (60) | 63–136 (120) | 4D-IMRT n.s. | n.s. | 20 (67 %) |
Table 3
Treatment outcome from reirradiation (non-SABR studies)
Author | MST months (range) | OS in years for % pts shown | % of pts showing symptom improvement | % of pts with high-grade (≥3) toxicities indicated | ||||
|---|---|---|---|---|---|---|---|---|
Hemoptysis | Cough | Chest pain | Dyspnea | Overall | ||||
Green and Melbye (1982) | 5 (1–54) | 1 year =14 % 5 years = 3 % | 33 % | 55 % | n.s. | 44 % | 48 % | Rib fracture – 3 % Pneumonitis – 3 % |
Jackson and Ball (1987) | 5.4 (n.s) | 1 year = 38 % 2 years = 15 % | 83 % | 50 % | 40 % | 67 % | 50 % | Myelopathy – 5 % |
Montebello et al. (1992) | 5 (n.s.) | n.s. | 89 % | 64 % | 77 % | 53 % | 70 % | Esophagitis – 20 % Skin-13 % 13 % Pneumonitis – 3 % Skin – 13 % Pneumonitis – 3 |
Gressen et al. (2000) | 4.9 (n.s.) | 1 year = 13 % | 100 % | 60 % | 80 % | 73 % | 72 % | Grade 5 (fatal) – 4 % |
Okamoto et al. (2002) | 8 (n.s.) | 1 year = 43 % 2 years = 27 % | n.s | n.s | n.s | n.s | 75 % | G2 pneumonitis – 35 % G3 pneumonitis – 21 % G2 esophagitis – 12 % G3 esophagitis – 6 % |
Wu et al. (2003) | 14 (2–37) | 1 year = 59 % 2 years = 21 % | n.s | n.s | n.s | n.s | n.s | G1-2 esophagitis – 9 % G1-2 pneumonitis – 22 % 2 years = 21 % G1-2 pneumonitis – 22 % |
Kramer et al. (2004) | 5.6 (n.s.) | 1 year = 18 % | 100 % | 67 % | n.s. | 35 % | 71 % | G2 esophagitis – 4 % |
Tada et al. (2005) | 7.1 (n.s.) | 1 year = 26 % 2 years = 11 % | n.s. | n.s. | 80 % | 100 % | n.s. | G3 pneumonitis – 5 % G2 esophagitis – 16 % |
Ebara et al. (2007) | 6.5 (n.s.) | 1 year = 27.7 % | n.s. | n.s. | n.s. | n.s. | 81 % | G2 pneumonitis-7 % G3 pneumonitis-7 % |
Cetingoz et al. (2009) | 3 (n.s.) | 1 year = 8.7 % 2 years = 5.8 % | 86 % | 77 % | 60 % | 69 % | 78 % | G1-2 esophagitis – 77 % G3 esophagitis – 4 % |
Ohguri (2012) | n.s. (18.1) | 1 year: 62 % (est.) | 100 % | 100 % | 100 % | 100 % | 16/17 (94 %) of all tumor-related symptoms | Platelets G3: 1 (3 %) Pleuritis G3: 1 (3 %) Brachial plexopathy G3: 1 (3 %) |
Yoshitake (2013) | n.s. (17) | 1 year: 74.7 % | n.s. | n.s. | n.s. | n.s. | n.s. | No G3-5 toxicity |
Kruser (2014) | n.s. (5.1) | 1 year: 22 % | n.s. | n.s. | n.s. | n.s. | 75 % | No G3-5 toxicity |
Tetar (2015) | n.s. (13.5) | 2 years: 23 % | n.s. | n.s. | n.s. | n.s. | n.s. | Bleeding G5: 5 (17 %) Subcutaneous and mediastinal emphysema : 1 (3 %) Bronchial stenosis and oxygen dependency: 1 (3 %) |
Reirradiation represents a challenge due to several reasons. There are limited data available to establish its efficacy (Tables 1, 2, and 3). The adequate dose/fractionation and duration of RT to achieve specific goals (cure, palliation) is still not well known. Neither are there clear data about the side effects reirradiation can cause, especially when previous high-dose radical RT was followed by high-dose reirradiation. In spite of these challenging aspects, feasibility and efficacy of reirradiation was clearly documented in several early reports on treatment of recurrent lung cancer (Green and Melbye 1982; Jackson and Ball 1987; Montebello et al. 1993). These studies were all retrospective and besides patients with parenchymal recurrences being reirradiated, sometimes included mixture of patients such as those with postsurgical relapses, postoperatively irradiated patients, those with metastasis, and those with second primary lung cancer. While doses of the initial course of RT ranged from 25 to 80 Gy, those administered at the time of recurrence ranged from 6 to 70 Gy, with cumulative doses ranging from 43 to 150 Gy. Occasionally, a few patients underwent a third course of RT (second reirradiation). RT treatment portals used during the initial course of RT usually included more or less of uninvolved (prophylactic) nodal regions, while those used at the time of reirradiation were obviously limited, in general only including visible recurrence with a safety margin of 1–2 cm (Green and Melbye 1982; Jackson and Ball 1987; Montebello et al. 1993; Gressen et al. 2000; Okamoto et al. 2002). It is likely that the fear of excessive toxicity, which primarily may have occurred in lung and spinal cord, clearly influenced the choice of both total dose and treatment fields used during the reirradiation. Symptom relief, rather than the prolongation of life, was the main goal of reirradiation. In a comprehensive review published 15 years ago (Gressen et al. 2000), clinical data of original articles were summarized. They indicated a beneficial effect of reirradiation on symptom control: control of hemoptysis was observed in 83 %, cough in 65 %, dyspnea in 60 %, and pain in 64 % of cases. Reirradiation carried a merely 5 % complication rate (Green and Melbye 1982; Jackson and Ball 1987; Montebello et al. 1993; Gressen et al. 2000; Okamoto et al. 2002), the most frequent event being radiation pneumonitis appearing in 3 % of cases, while radiation myelopathy and rib fracture were rare events. Although higher incidence of RT pneumonitis was noted in a recent study (Okamoto et al. 2002), described as grade 2 (moderate) and occurring after cumulative radiation doses of 12–150 Gy, in that study a somewhat different policy was instituted, resulting in not only symptomatic, but also asymptomatic patients being reirradiated. This has given the authors an opportunity to use higher RT doses. Patients received a median RT dose of 45 Gy. While symptomatic response in earlier studies ranged from 48 to 72 % with an average cumulative dose of 30 Gy (Green and Melbye 1982; Jackson and Ball 1987; Montebello et al. 1993; Gressen et al. 2000), in that study (Okamoto et al. 2002) palliation was achieved in 75 %. Again, this may indicate that higher doses may lead to higher palliation rate at no cost of increased high-grade (≥3) pneumonitis. Indeed, whereas earlier reports achieved MST of approximately 5 months (Green and Melbye 1982; Jackson and Ball 1987; Gressen et al. 2000), this study (Okamoto et al. 2002) reported a MST of 8 months and a 2-year survival of 27 %, being as high as 15 months and 51 %, respectively, for patients treated with curative intent and higher RT doses. Of additional importance is that it was also observed no difference in the treatment outcome between patients <70 years and those ≥70 years (Gressen et al. 2000), indicating greater applicability of EBRT in this disease, in particular when palliative intention is pursued and when severe late effects become less important. Kramer et al. (2004) confirmed this observation, using 2 fractions of 8 Gy given with 1 week split, a practical and comfortable palliative regimen for both patients and hospitals. The MST was 5.6 months and 71 % of patients had partial or complete relief of one or more of their symptoms. Relief of dyspnea, hemoptysis, and cough was observed in 35 %, 100 %, and 67 %, respectively. Karnofsky performance status (KPS) improved in 45 % patients. The overall median duration of symptom relief was 4 months. Figure 2 shows an example of palliative reirradiation.

Fig. 2
A 70-year-old male patient was diagnosed with asymptomatic squamous cell cancer in the right lung during surveillance approximately 12 years after he had been cured from two simultaneous squamous cell cancers in the left and right lung, respectively (initial surgical resection, no adjuvant therapy). When he developed this new primary tumor, his lung function was severely compromised and further surgery was not possible. PET-CT showed no lymph node metastases (a). He was referred for high-dose radiotherapy and received 3D conformal treatment to the primary lesion only with 2.2 Gy per fraction in October 2008. During treatment, he developed increasing neck pain, and further CT scans showed bone metastasis in the first thoracic vertebra. This metastasis was not detected on the initial PET-CT. In the light of this new finding, radiation treatment to the primary tumor was stopped after 52.8 Gy. The patient refused systemic chemotherapy. He was treated with palliative radiotherapy to the thoracic vertebra. Follow-up CT scans showed a partial remission of the lung tumor (b). However, in August 2009, i.e., 10 months after radiotherapy, the patient experienced increasing chest pain and dyspnea. His performance status was ECOG 2. New CT scans revealed local tumor progression and atelectasis (c), as well as two small lung metastases. As the patient continued to refuse chemotherapy and was considered ineligible for brachytherapy based on the disease extent, palliative external beam reirradiation was offered (10 fractions of 3 Gy, 2D anterior-posterior opposing fields, the previous course had not resulted in close to tolerance doses to any organ at risk). Clinical improvement was obtained in the absence of acute grade 2 or higher toxicity. Late toxicity could not be assessed because survival was limited to 3.5 months. In the light of this survival outcome, the administration of a different even more hypofractionated regimen might have been a reasonable choice
Contrary to Kramer et al. (2004), Tada et al. (2005) used more radical approaches with curative intent in 19 patients with stage III NSCLC (50 Gy in 25 daily fractions, including one patient treated with 60 Gy in 30 daily fractions). The overall 1-year and 2-year survival rates were 26 % and 11 %, respectively, and the MST was 7.1 months. However, for 14 patients who received the prescribed dose, it was 10.5 months. Reirradiation alleviated the symptoms in all symptomatic patients except for the one with chest pain. In the recent study of Wu et al. (2003), seemingly the first prospective phase I–II study, the median dose of the first course was 66 Gy (range, 30–78 Gy). Reirradiation was carried using a 3D conformal technique to deliver a median dose of 51 Gy (range, 46–60 Gy), using standard fractionation. The MST was 14 months and the 2-year survival rate was 21 %, while 2-year locoregional progression-free survival was 42 %.
In addition to this pioneering study, more than 10 years ago, Beavis et al. (2005) provided the first report on the use of IMRT, in the retreatment of a patient with NSCLC. With the conventional technique, the target coverage was clearly inferior to that offered by the IMRT plan. With the widespread use of IMRT in cases when it can be of a significant advantage (e.g., shape and location of the tumor as well as in cases of reirradiation), it was expected that this technique might play an important role in reirradiation of lung cancer.
Several recent studies (Ohguri et al. 2012; Yoshitake et al. 2013; Kruser et al. 2014; Tetar et al. 2015) used either three-dimensional (3D) or four-dimensional (4D) or IMRT (Tables 1, 2, and 3) and showed that all techniques allowed consistent use of higher reirradiation (and, therefore, total cumulative) dose of RT. Relatively limited fields also allowed for higher percentage of patients receiving additional CHT. It is, therefore, not surprising that somewhat higher MST (13.5–18.1 months) and 1-year survival rates of 60–70 % were observed. Interestingly, except the study of Ohguri et al. (2012), other studies did not report on symptom control, which may perhaps indicate a shift in philosophy of the treatment towards more curative (and less palliative) outcome. These reports provided evidence of the safety of such approaches, although the study of Tetar et al. (2015) stands as an exemption to this rule. They reported on mortality of 17 % due to bleeding or respiratory failure, likely as a consequence of overlapping high-dose regions of the first and the second RT course in patients with more centrally located tumors.
Observations coming from the literature, especially when more recent studies using highly sophisticated planning and delivery techniques (other than SABR) are taken into account, include but are not limited to the following facts: (1) a great variety of RT characteristics exists regarding the total dose, the dose per fraction and dose prescriptions used, due to different techniques used, including algorithms used to address inhomogeneities, (2) a tendency towards the use of smaller margins during treatment planning exists, although it is still unknown whether this was deliberately done due to special case of recurrent tumor or could perhaps be seen as a consequence of novel techniques being used, (3) a tendency for better reporting of toxicity occurring during and after reirradiation using different toxicity scoring systems was observed, (4) there seems to be a shift in treatment intention, moving away from pure palliation of symptoms towards more radical approaches, with an unfortunate lack of reporting of symptom control in the most recent high-technology studies (Yoshitake et al. 2013; Kruser et al. 2014; Tetar et al. 2015), and (5) time intervals between the initial RT and reirradiation were specified more frequently in the past decade (Okamoto et al. 2002; Wu et al. 2003; Tada et al. 2005; Cetingoz et al. 2009; Oghuri et al. 2012; Yoshitake et al. 2013, Tetar et al. 2015), but not always (Kruser et al. 2014). The latter may well be the crucial issue due to several implications: better understanding of the natural history of the disease, discussing potential prognostic factors as well as the occurrence and timing of anticipated toxicity. Reirradiation started as early as 1–6 months after the first RT course and was as late as 39–189 months after it, with similar median values of 13–16 months (Wu et al. 2003; Tada et al. 2005). Exceptions were the studies by Cetingoz et al. (2009) where it was 8.5 months and Okamoto et al. (2002) and Tetar et al. (2015) where it was 23 and 30 months, respectively. Influence of time interval between the first and the second irradiation was documented by Tada et al. (2005) who showed that in addition to PS, time interval was an important factor influencing treatment outcome. The MST associated with time intervals of less than 12 months, 12–18 months, and more than 18 months were 2.1, 7.1, and 11.5 months, respectively. However, Gressen et al. (2000) did not observe this influence. Cetingoz et al. (2009) showed that time interval between the first and second irradiation was the only independent prognosticator influencing overall survival in multivariate analysis. While these findings may imply less aggressive behavior of tumors reirradiated later, they may also indicate willingness of radiation oncologists to use higher reirradiation doses with prolonged time intervals between first and second irradiation.
Related posts:

Stay updated, free articles. Join our Telegram channel

Full access? Get Clinical Tree


