Fig. 1
A 31-year-old patient. Axial T1-weighted sequence (a), axial T2-weighted sequence (b), axial T1-weighted fat sat sequence (c), and coronal T2-weighted sequence (d) images show a 1.3 cm endometrioma (white arrows) characterized by the presence of hyper-signal in T1-weighted/T1-weighted fat sat/T2-weighted sequences
Computer-Assisted Tomography
As we previously described the computer-assisted tomography (CAT) is not considered the first-line approach for the examination and diagnosis of endometriomas, because the first line is the ultrasonography. Moreover, it is important to underline that the CT findings of this pathology are often unspecific and not diagnostic.
Nowadays the use of the CT for the detection of endometriomas is not correct and cannot be justified because of the issue related to the radiation dose and contrast material risk. For these reasons the identification of endometriomas using the CT is an occasional finding in patients that undergo CT of the pelvis.
The aspect of the endometrioma in the basal scan without the administration of contrast material is a solid (but sometimes it can be cystic or shows mixed form) mass characterized by and hyperdensity (HU values usually > 100). After the administration of contrast material, there is no contrast enhancement in the mass, but it is possible to identify a mild wall enhancement (Fig. 2).
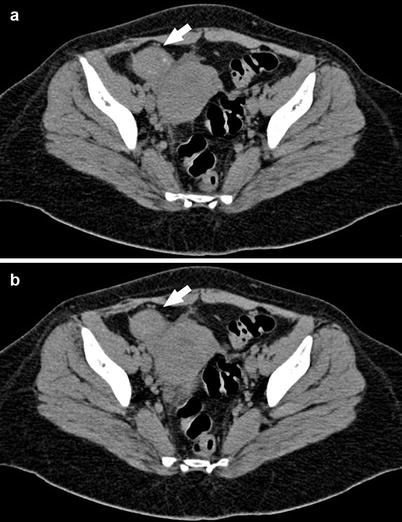
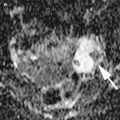
Fig. 2
A 29-year-old patient. Axial CT images (a, b) demonstrate a round mass that at the histopathological analysis was confirmed to be an endometrioma in the right adnexa
The fact that endometriomas appear on CT scanning as solid, cystic, or mixed form may cause potential problems in differential diagnostic. Buy et al. [23] reported that the CT findings of a hyperdense focus inside an ovarian cyst are (in the basal scan) and can be considered as suggestive of endometriotic cysts. However, this is unspecific because other hemorrhagic lesions, such as hemorrhagic cysts, may also demonstrate this finding [6, 23, 43].
The appearance of endometriomas on CT may also overlap with pelvic inflammatory disease, as well as by benign or malignant ovarian tumors. For this reason CT scanning should not be relied on for the diagnosis [3, 4, 21–23, 43].
Contrariwise, CT may be useful in detecting complications of endometriosis in general, such as bowel obstruction or ureteral obstruction, which may determine hydronephrosis, or complication of endometriomas such as rupture which may determine a condition of acute abdomen [22, 23]. Considering the low specificity and elevated radiation dose and also the poor contrast resolution, the use of CT in the evaluation of endometriomas has been replaced by MRI [22–25].
Magnetic Resonance Imaging
MRI represents a noninvasive approach which, according to recent reports, is widely considered an excellent technique for diagnosis and evaluation of endometriosis. Nishimura et al. firstly reported in 1987 the usefulness of MR imaging in the diagnosis and staging of this important disease [26–28]. Thanks to its high space/contrast resolution and its large field of view, MR imaging allows an optimal pre-surgery mapping, an excellent tissue characterization, and a multiplanar evaluation of the pelvis without using ionizing radiation or iodinated contrast agents [6, 26–28].
Besides, MR imaging is recommended in presence of extensive pelvic adhesions (which represents a limitation to the laparoscopic investigation) and permits a panoramic assessment and a complete survey of the anterior and posterior compartments of the pelvis unlike ultrasound approach [27, 29]. Moreover, MR imaging presents a higher accuracy than TVUS in distinguishing benign from malignant ovarian masses, especially when the examination is completed with the use of contrast enhancement [7, 30–33].
MR Protocol
The MR examination is usually performed regardless of menstrual cycle phase; in fact, in several studies, it has been reported that the MR signal of the nodules of endometriosis does not change according to the menses, and there is no evidence of a greater diagnostic accuracy in MR performed during the menstrual period [3, 35]. The patients are instructed to fast for 4/6 h before the onset of MR examination. Some reports recommend also a bowel preparation (consisting usually in the use of oral laxative the day before imaging and in a low-residue dietary regimen on the day before and the day of the MR examination) [3, 4]. A moderate repletion of the patient’s bladder is recommended in order to determine a modification of the angle of uterine anteversion; in fact an empty or overfilled bladder may obliterate the adjacent recesses [3, 27, 36]. Antispasmodic drug (20 mg of scopolamine-N-butyl bromide/Buscopan) is usually intravenously administrated just before the beginning of MR examination, in order to reduce artifacts determined by bowel peristaltic movements [3, 36]. If available, MR examination should be performed using a phased-array surface coil, because it ensures a higher signal/noise ratio, improves spatial resolution, and enhances anatomic details, permitting a better characterization of soft tissue in the female pelvis.
A conventional MR protocol for evaluation of pelvic endometriosis usually includes three standard planes: axial, sagittal, and coronal T2- and T1-weighted pulse sequences before and after fat suppression (Table 1, Fig. 3).
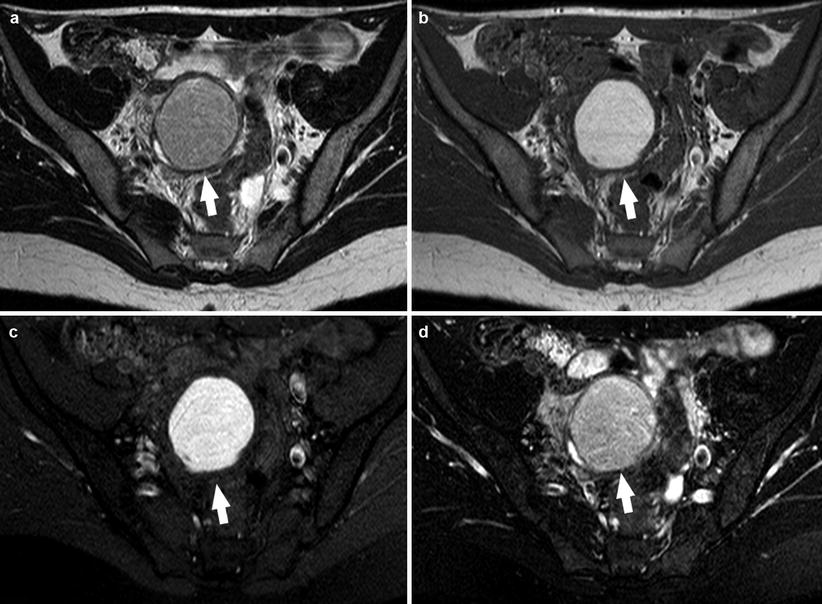
Table 1
Protocol for the MR imaging of endometriosis
Sequence | Plane |
|---|---|
T2-W | Sag-Ax-Cor |
T1-W | Ax |
T1-W fat sat | Ax |
T1-W enhanced | Ax |
T1-W fat sat enhanced | Ax |
Fig. 3
A 23-year-old patient. Axial T2-weighted sequence (a), axial T1-weighted sequence (b), axial T1-weighted fat sat sequence (c), and axial T1-weighted fat sat sequence after administration of contrast material (d) images show a 3.5 cm endometrioma (white arrows) characterized by the presence of hyper-signal in T1-weighted/T1-weighted fat sat/T2-weighted sequences
Fat-suppressed T1-weighted sequences, in fact, are the most sensitive for the detection of bloody foci, whereas high-resolution T2-weighted sequences are used for the evaluation of fibrotic lesions [3, 36]. Moreover, fat-suppressed sequences are very helpful, especially in the detection of small lesions, because they narrow the dynamic signal range increasing differences in tissue signal and permitting to discriminate between endometrioma (characterized by an hemorrhagic content) and other adnexal masses such as dermoid cyst (characterized by a fatty content) and to better evaluate small implants [3, 36–39, 46] (Fig. 4).
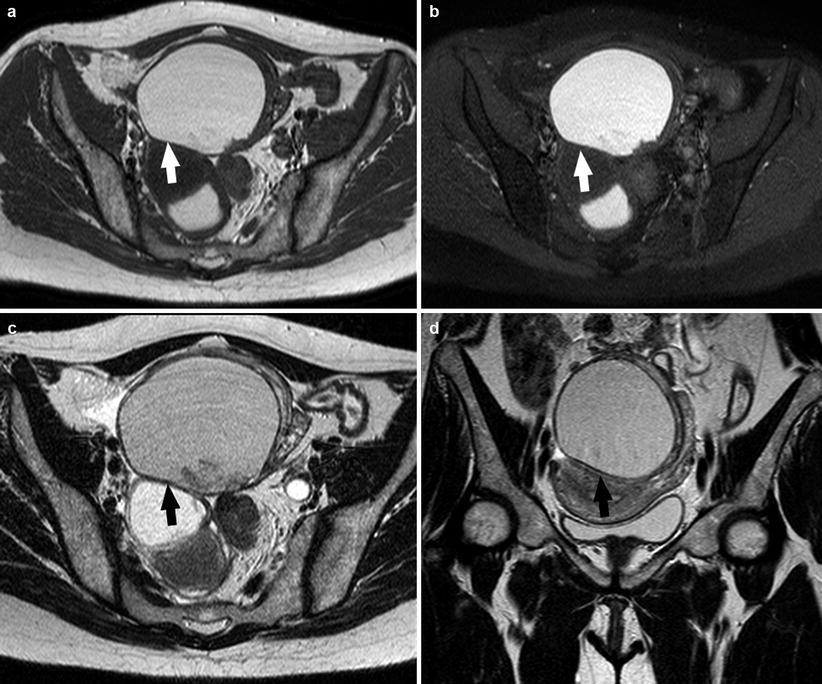
Fig. 4
A 25-year-old patient. Axial T1-weighted sequence (a), axial T1-weighted fat sat sequence (b), axial T2-weighted fat sat sequence (c), and coronal T2-weighted sequence (d) images show a 4.1 cm endometrioma (white arrows and black arrows) characterized by the presence of hyper-signal in T1-weighted/T1-weighted fat sat/T2-weighted sequences
Endometrioma: MR Findings
Although US represents the first-line approach and the main important method in the evaluation of endometrioma, MR imaging plays an important role in the diagnostic process, especially in presence of uncertain findings [3, 20, 32, 33]. The appearance of endometriomas on MR imaging is extremely variable and depends on the concentration of iron and protein in the fluid, products of blood degradation [7].
Most endometriomas have a coarse appearance of chocolate cysts, for the presence of highly concentrated blood products. On MR imaging, endometriomas (>1 cm) usually appear as cystic masses with very high and relatively homogeneous signal intensity on T1-weighted images (“light bulb-like brightness,” similar to or greater than that of fat, which is attributed to the high concentration of paramagnetic hemoglobin in blood breakdown products) and intermediate-to-low-signal intensity on T2-weighted images [7, 10, 39, 44, 45]. The degree of T1 and T2 shortening in endometriomas is attributable to their high protein concentration and viscosity (Fig. 5).
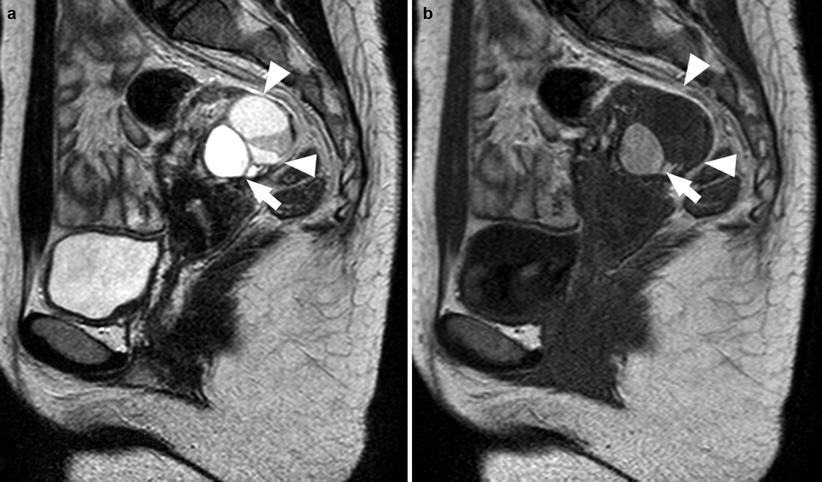
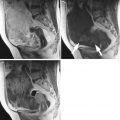
Fig. 5
A 21-year-old patient. Sagittal T2-weighted sequence (a) and sagittal T1-weighted sequence (b). In the left adnexa there are three visible formations: an endometrioma characterized by an high-signal intensity in both T1-weighted sequence and T2-weighted sequence (white arrows) and two cysts characterized by high signal in T2-weighted sequence and very low signal in T1-weighted sequence (white arrowheads)
Another common and very important feature of endometriomas is the “shading sign” which is characterized by the loss of signal within the lesion on T2-weighted images and is used to discriminate endometriomas from functional hemorrhagic cysts (Fig. 6). The precise mechanism of the shading sign is complex. Endometriotic cysts are highly viscous and have a high concentration of protein and iron from recurrent hemorrhage. All of these components may determine a shorten T2 and may contribute to signal intensity loss (or shading). In addition, intra-and extracellular methemoglobin markedly shorten the T1 of fluids. This results in hyperintensity on T1-weighted images and hypointensity on T2-weighted images [45–49].
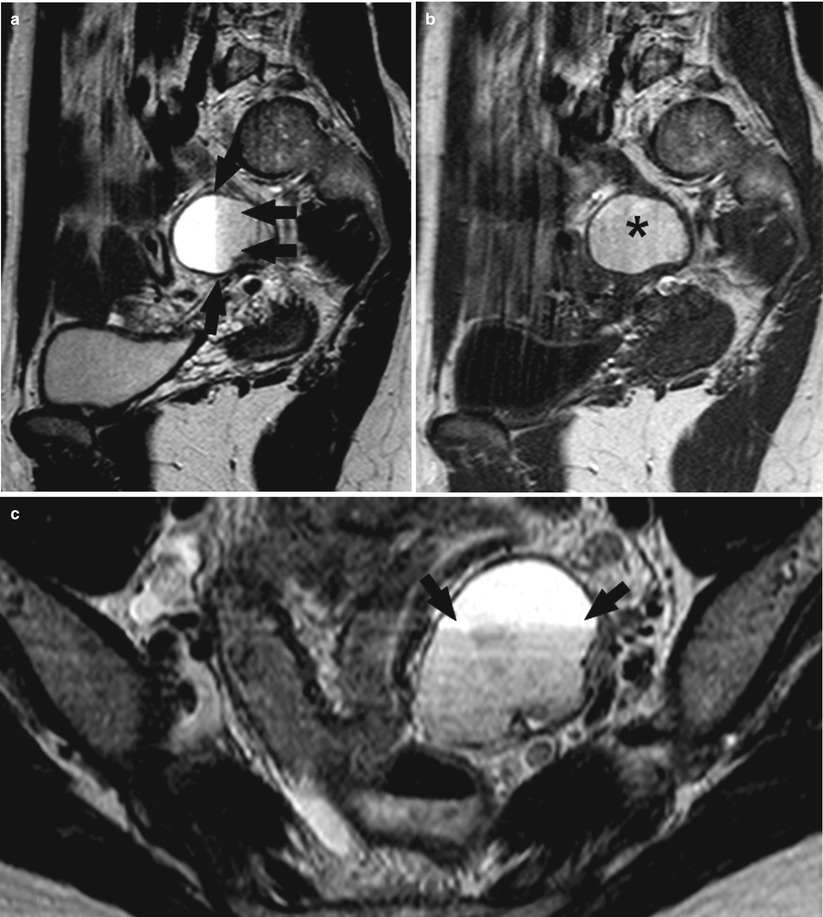
Fig. 6
A 36-year-old patient. Sagittal T2-weighted sequence (a), sagittal T1-weighted sequence (b), and axial T2-weighted sequence (c). In this patient with a 3.5 cm endometrioma in the left adnexa and in the T2-weighted sequences (a, c), the shading sign (black arrows) is visible where this effect is not visible in the T1-weighted sequence (b) (black asterisk)
Some endometriomas, however, are filled with watery fluid on gross cut sections and may not exhibit typical MRI findings [7]. Togashi et al. in their studies had reported that a “definitive” diagnosis of an endometrioma was made when a cyst was hyperintense on T1-weighted images and shading was observed on T2-weighted images [44, 49].
Another important feature is also represented by the frequent multiplicity of endometriotic cysts, because the cysts have a tendency to undergo repeated rupture due to recurrent cycles of internal hemorrhage (Fig. 7). Therefore, the presence of multiple T1 hyperintense cysts regardless of their signal intensity on T2-weighted images could be considered a diagnostic criteria permitting a reliable differentiation, with a high rate of accuracy (as demonstrated by Togashi et al. in 1991 that yielded an overall sensitivity, specificity, and accuracy of 90, 98, and 96 %, respectively), between endometriomas and other hemorrhagic lesions [7, 10, 46, 47, 49].
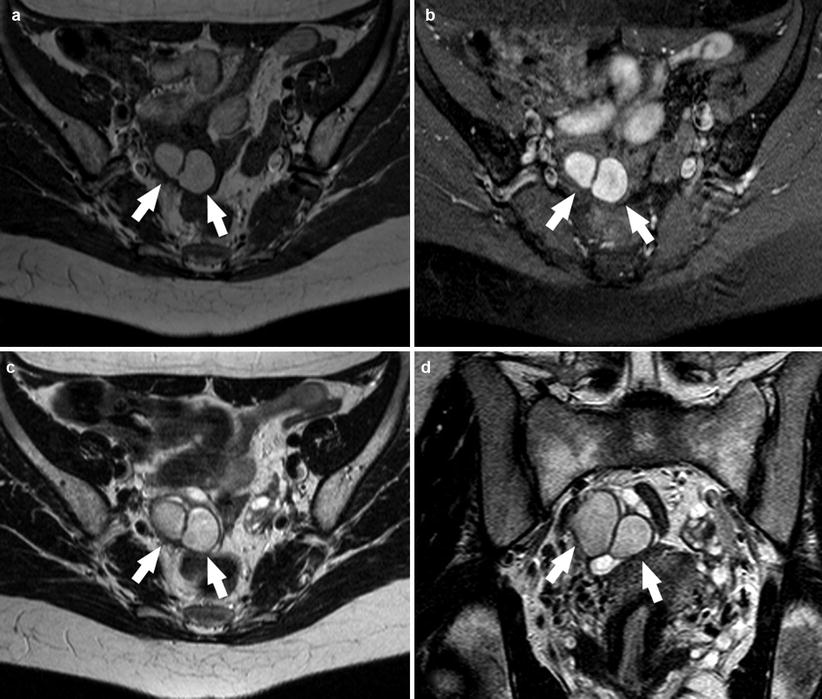
Fig. 7
A 19-year-old patient. Axial T1-weighted sequence (a), axial T1-weighted fat sat sequence (b), axial T2-weighted sequence (c), and coronal T2-weighted sequence (d) images show in the right adnexa the presence of 2 endometriomas repeated rupture due to recurrent cycles of internal hemorrhage (white arrows)
Considering that endometriomas are often bilateral (>50 % of cases), multilocular, and frequently associated with adhesions, another important diagnostic sign is “kissing ovaries” (Fig. 8) (characterized by the closing up of ovaries caused by inter-ovarian adhesions). Contrast material-enhanced MR imaging may show an intense contrast enhancement of the peripheral low-signal-intensity rim, which represents the thick fibrous wall of the endometrioma [10].
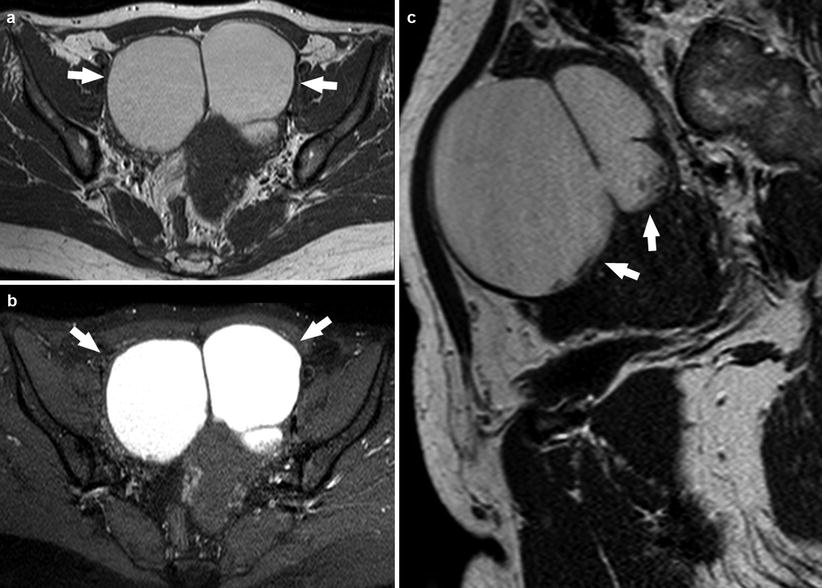
Fig. 8
A 25-year-old patient. Axial T1-weighted sequence (a), axial T1-weighted fat sat sequence (b), and sagittal T2-weighted sequence (c) images show in the right and left adnexa the presence of endometriomas that have the kissing ovaries configuration (white arrows)
Large endometrial cysts may contain clots or thin septa. A hematocrit effect is occasionally observed (Fig. 9) [10], especially in endometriomas that does not exhibit typical MR features. It may be helpful in the visualization of hemosiderin deposition in the cyst wall. Takeuchi et al., in 2008, had reported the usefulness of susceptibility-weighted MR, which is an MR technique that maximizes sensitivity to susceptibility effects and has excellent sensitivity to blood products such as hemosiderin and deoxyhemoglobin combining magnitude and phase information from fully velocity-compensated gradient-echo sequences. The magnetic susceptibility effects generated by local inhomogeneity of the magnetic field caused by hemosiderin or deoxyhemoglobin are visualized as signal voids, increasing, in this way, the diagnostic accuracy of MR approach [7]. Therefore, we can consider the following as imaging criteria for the diagnosis of endometrioma:
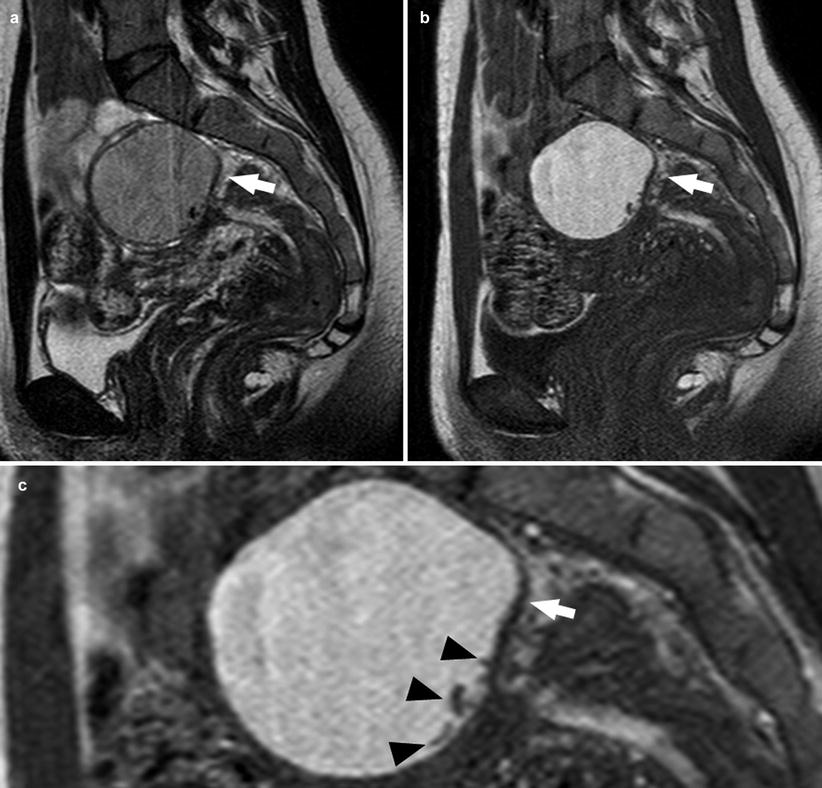
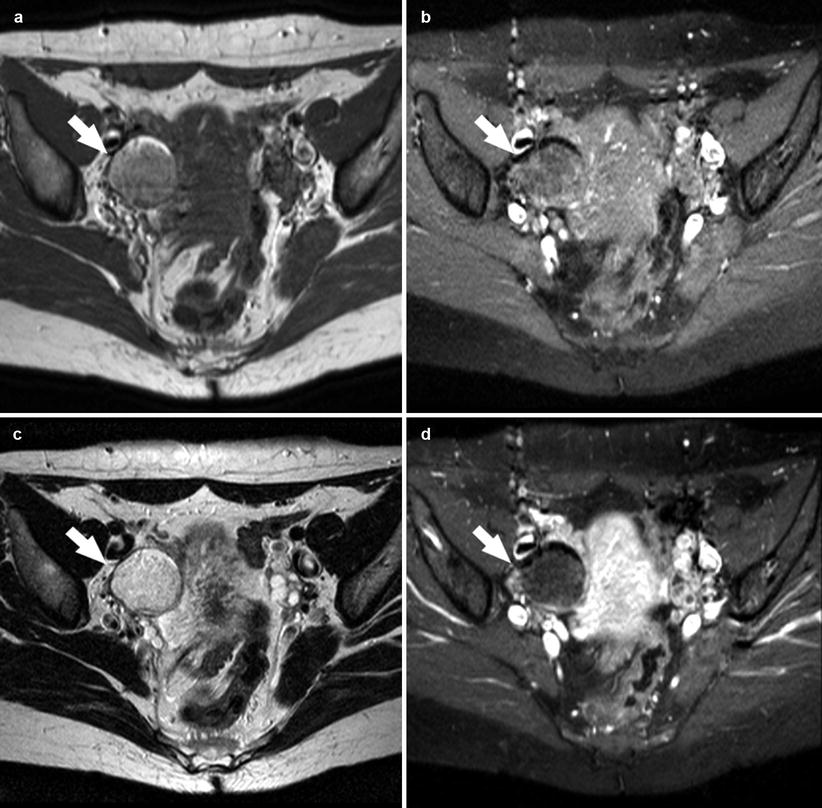
Fig. 9
A 28-year-old patient. Sagittal T2-weighted sequence (a), sagittal T1-weighted sequence (b), and sagittal T2-weighted sequence, zoom 200 % (c). In this patient with a 2.7 cm endometrioma (white arrows), some linear hypo-intense spot (black arrowheads) are present due to hemosiderin deposition in the cyst wall
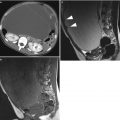
Fig. 10
A 33-year-old patient. Axial T1-weighted sequence (a), axial T1-weighted fat sat sequence (b), axial T2-weighted fat sat sequence (c), and axial T1-weighted fat sat sequence after contrast material (d) images show a 2.4 cm dermoid cyst (white arrows) characterized by the presence of moderate hyper-signal in T1-weighted and T2-weighted sequences and suppression in the T1-weighted fat sat sequence
One or more cysts with hyperintensity on T1-weighted fat-suppressed images
Shading sign on T2-weighted images
Presence of adhesions
Contrast enhancement of the peripheral low-signal-intensity rim of the thick fibrous capsule of the cyst
Using these criteria it has been demonstrated that MR imaging has a diagnostic accuracy of 91–96 %, a sensitivity of 90–92 %, and a specificity of 91–98 % [7, 10, 46, 47, 49, 61, 63].
In 1993, Outwater et al. [38] compared the MR imaging features of endometriomas and hemorrhagic cysts and concluded that endometriomas usually have higher T1 and lower T2 signal intensities than hemorrhagic cysts. Bilaterality and multifocality of adnexal lesions can help establish a diagnosis of endometrioma with even greater specificity than T1 signal hyperintensity alone.
In some centers it is used in the STIR sequence to exclude the presence of fat (and therefore the presence of teratoma), but low-signal intensity of adnexal masses on STIR MR images cannot be considered as specific for mature cystic teratoma and does not exclude endometrioma [71]. As previously demonstrated by Krinsky et al., the loss of T1 signal hyperintensity on STIR images is not a finding specific to fat because hemorrhagic ovarian cysts and endometriomas can have T1 relaxation times similar to that of fat (i.e., they can show “suppressed” signal intensity) and thus may mimic mature cystic teratomas at STIR imaging. Therefore, the use of an MR imaging system capable of chemically selective T1-weighted fat-suppressed imaging will help to prevent this pitfall.
It is possible to find also a rare condition of the so-called polypoid endometriosis of the ovary [76] that is characterized in the microscopic examination, by solid components with dilated endometrial glands with various amounts of endometrial stroma containing fibrous tissues. There are few papers describing this condition in the literature, and in each of these cases, there was a mass with cystic component containing polypoidal areas that were hyperintense on T2-weighted image and demonstrated homogeneous enhancement after administration of contrast material [69, 77, 78].
Diffusion-Weighted Imaging in MR
Recent technical advances in diffusion-weighted imaging (DWI) greatly enhanced the clinical value of magnetic resonance imaging (MRI) of the body. In fact DWI can provide excellent tissue contrast based on molecular diffusion [50–55]. Quantitative measurement of the apparent diffusion coefficient (ADC) may be valuable in distinguishing between malignant and benign lesions, and in the last years, it has been suggested to use the diffusion-weighted imaging with quantitative assessment of apparent diffusion coefficient (ADC) values into pelvic MR imaging protocols (Figs. 11 and 12).
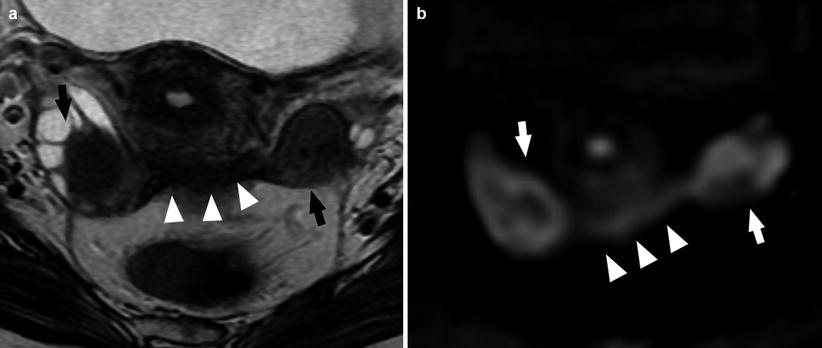
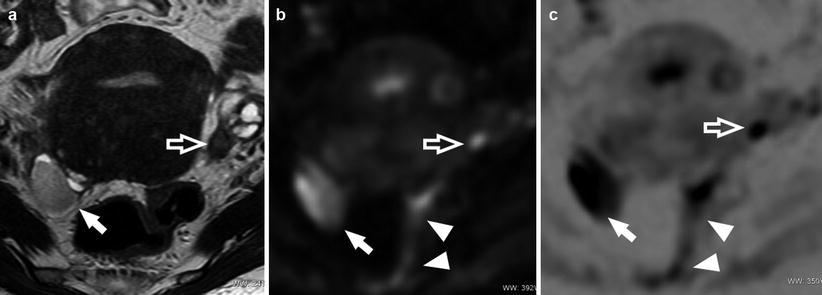
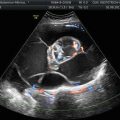
Fig. 11
A 29-year-old patient. Axial T2-weighted sequence (a) and axial DWI (b value = 1,000) (b). Bilateral endometrioma (white and black arrows) well demonstrated by the DWI; the presence of fibrosis involving the retrocervical region (white arrowheads) is also visible (Images courtesy of Carlo Nicola de Cecco MD – University of Rome la Sapienza – Polo Pontino)
Fig. 12
A 24-year-old patient. Axial T2-weighted sequence (a), axial DWI (b value = 1,000) (b), and axial DWI (b value = 1,000) with inverted window (c). Endometrioma in the right adnexa (white arrows) well demonstrated by the DWI; there is also a visible nodule of endometriosis in the para-uterine region (white open arrows) and the presence of fibrosis involving the sigma (white arrowheads) (Images courtesy of Carlo Nicola de Cecco MD – University of Rome la Sapienza – Polo Pontino)
Endometriomas usually have low ADC values in part because of the so-called “T2 blackout effects” [72]. On a diffusion-weighted image obtained with a low b value (which is a type of T2-weighted fat-suppressed image), an endometrioma exhibits low-signal intensity resembling the T2 shading. Thus, endometriomas have less signal intensity to lose on images obtained with higher b values than adnexal masses with higher T2 signal intensity do. Because the ADC value is based on the slope of the signal intensity loss between acquisitions at low b values and those at higher b values, endometriomas often have low ADC values. Busard et al. showed a significant correlation between the T2 signal intensity and the ADC value in a study evaluating both endometriomas and solid endometrial implants [73].
Previous publications demonstrated that restricted diffusion and low ADC values within an adnexal lesion does not have a high PPV (positive predictive value) or specificity for the diagnosis of malignancy because endometriomas demonstrate restricted diffusion but also benign hemorrhagic ovarian cysts solid endometrial implants as well as benign mature cystic teratomas also demonstrate restricted diffusion.
3 T MRI Imaging
In the last years, 3 T systems have been introduced in the clinical use [74, 75] and, compared with 1.5 T, the signal-to-noise ratio at 3 T has been increased and background suppression has been improved, which allows better categorization of variable components of endometriomas. The 3 T systems guarantee high spatial and contrast resolution, providing also an accurate information about endometriosis implants, with a good pre-surgery mapping of the lesions involving both bowels and bladder surface and rectouterine ligaments. In a recently published paper in Radiology by Hottat et al., the sensitivity and specificity in detecting endometriomas using a 3 T system was 96 % and 80 %, respectively, and also a very high interobserver agreement was found. However, further investigations are necessary to define the role of this technology in the detection and characterization of endometrioma.
Differential Diagnosis
MR findings of endometrioma may overlap with MR findings of other adnexal masses, in particular with other lesions that appear with high-signal intensity on T1-weighted images, such as dermoid cysts, hemorrhagic masses, mucinous cyst, and neoplasms. Thus, a differential diagnosis is necessary [6, 44, 49]:
Dermoid cysts may be differentiated from endometriomas thanks to fat-saturated T1-weighted sequences, in which the endometrioma’s signal intensity does not decrease. This signal characteristic differentiates endometriomas from fatty adnexal masses, such as dermoids that show instead a chemical shift artifact and signal dropout [10, 44, 49] (Fig. 10).
Mucinous lesions present a definitely lesser increased signal intensity on T1-weighted images than that of fat or blood [6].
Hemorrhagic cysts (most commonly a corpus luteum cyst) represent the most difficult differential diagnosis, because of the similarity in MR imaging appearance to that of endometriomas. In fact hemorrhagic cysts remain bright on fat-saturated T1-weighted images. However, what better allows in the differential diagnosis is that, unlike endometriomas, hemorrhagic cysts are usually solitary, unilocular, and thin walled. They do not exhibit shading on T2-weighted image, since they do not repeatedly bleed. Without recurrent hemorrhage and concentration of contents, viscosity of the cyst remains lower, and shading is unlikely to be present. Endometriomas that are not bright on T1-weighted images may be difficult to distinguish from other adnexal masses [4, 7, 10]. In addition, hemorrhagic cyst will resolve with time, so it is helpful a follow-up examination rather with TVUS [4, 45, 64].Related posts:
 Benign Sex Cord-Stromal Tumors: Clinical and Ultrasound Features
 Ovarian Tumors: Computed Tomography and Magnetic Resonance
 Cord-Stromal Tumors: Computed Tomography and Magnetic Resonance
 and MR of Benign Ovarian Germ Cell Tumours
 Ovarian Tumors (Serous/Mucinous/Endometrioid/Clear Cell Carcinoma): Clinical Setting and Ultrasound Appearance
 Histopathology

Stay updated, free articles. Join our Telegram channel

Full access? Get Clinical Tree


