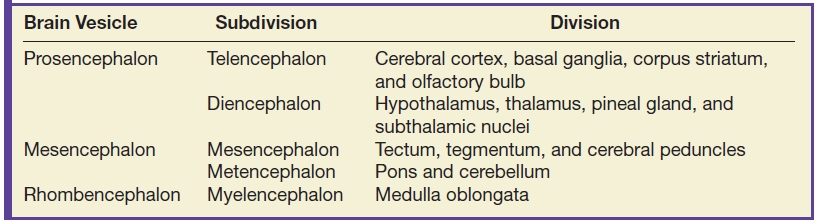
Table 8.2 VENTRAL INDUCTION AND DESIGNATION OF THE BRAIN VESICLES
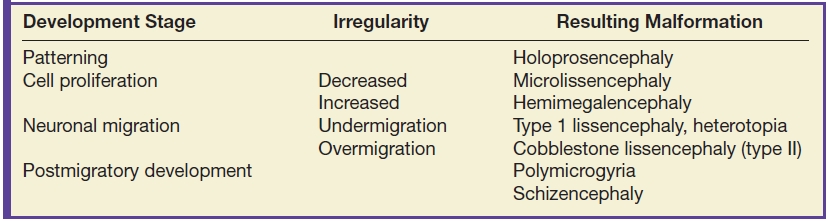
The cerebral cortex develops in four stages including patterning, cell proliferation, neuronal migration, and postmigratory development with a potential insult (noxic, ischemic, genetic, or infectious) at each stage causing a different malformation as listed in Table 8.3 (4). These stages begin at approximately 7 weeks of gestation and extend to 2 years of age (4). On imaging, abnormal cortical development can manifest as delayed appearance of sulcation, a thin and irregular cortical mantle, abnormal sulci and gyri, and a wide opening of isolated sulci (5).
Table 8.3 CORTICAL DEVELOPMENT STAGES AND ASSOCIATED MALFORMATIONS
Anomalies of Dorsal Prosencephalon Development
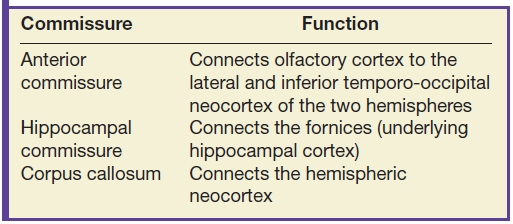
The cerebral commissures are bundles of axons that cross the midline and connect the two cerebral hemispheres. They include the anterior commissure, the hippocampal commissure, and the largest commissure, the corpus callosum (3). Abnormalities of the commissures, specifically involving the corpus callosum, are among the most common congenital malformations with a reported prevalence of 0.02% to 0.5% in the general population and 2% to 3% in patients with intellectual disability (6). Patients with corpus callosum agenesis can present with a spectrum of clinical abnormalities including seizures, developmental delay, mental retardation, visual problems, and behavioral and psychiatric disorders (3,7). They may also be discovered incidentally in asymptomatic individuals with normal development or a history thereof, imaged for unrelated reasons.
The formation of the corpus callosum occurs during a critical period of gestation at 8 to 20 weeks corresponding to the time of neuronal migration in the forebrain and formation of the cerebrum and cerebellum (3). As a result, anomalies of the corpus callosum are rarely isolated and often are seen in association with other congenital malformations such as Dandy-Walker malformation, Chiari II malformation, and malformations of sulcation and cortical development (3,8), which should be carefully ruled out when interpreting the imaging study. Commissural anomalies can result from exogenous factors (including toxic or infectious) as well as genetic factors such as chromosomal rearrangements and other genetic disorders (7,9).
The normal anatomy of the cerebral commissures and the respective connections is reviewed in Table 8.4. This chapter will primarily focus on the largest of the commissures, the corpus callosum. The corpus callosum is composed of the rostrum, genu, body, and splenium. Formation of the corpus callosum begins at 13 to 14 weeks of gestational age with the characteristic C shape essentially complete by 20 weeks gestation (6). The growth of the corpus callosum is from anterior to posterior with the exception of the rostrum, which forms last, and portions of the splenium, which form early using axons of the hippocampal commissure for guidance (10); the genu forms early, followed by the anterior body, posterior body, and finally the majority of the splenium (11,12). The anatomy of the corpus callosum is best appreciated on a sagittal plane and appears low in signal intensity on T2W images with high signal intensity on T1W images, similar to other white matter structures.
Table 8.4 FUNCTIONS OF THE CEREBRAL COMMISSURES
Congenital malformations of the corpus callosum include partial or complete absence and can be isolated or more commonly are seen in association with other malformations. Furthermore, the remaining commissures including the anterior commissure and hippocampal commissure are typically affected with abnormal development of the corpus callosum (3). MRI is the optimal imaging modality to assess for commissure malformations and to evaluate for additional associated malformations (3). Imaging findings of corpus callosum agenesis include parallel configuration of the lateral ventricles, colpocephaly, and upward deviation of the third ventricle as seen in the axial plane (3). Additionally, midline sagittal images are helpful in assessing the degree of callosal dysgenesis and identifying the segments of the corpus callosum that are hypoplastic (Fig. 8.1).
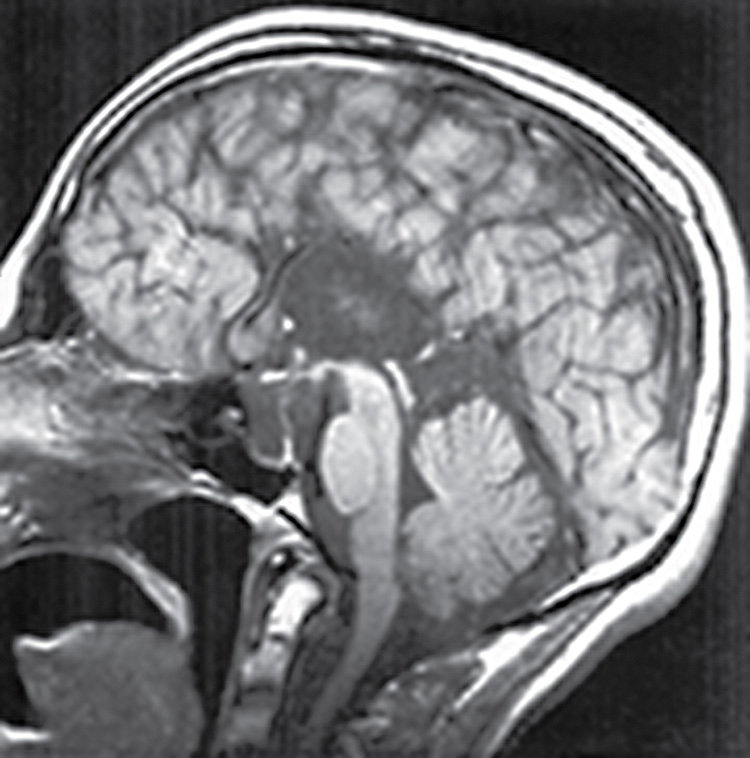
FIG. 8.1 Agenesis of the corpus callosum. Midline sagittal T1 image demonstrates complete agenesis of the corpus callosum and hippocampal commissure.
Corpus callosum agenesis can also be associated with interhemispheric cysts. These cysts occur in less than 7% of patients with agenesis of the corpus callosum (11). Interhemispheric cysts associated with agenesis of the corpus callosum are classified into two groups, type 1 and type 2 as seen in Table 8.5 (3). Type 1 cysts communicate with the ventricular system, whereas type 2 cysts do not (Figs. 8.2 and 8.3). These cysts can be unilocular or multilocular (mostly type 2) and for the most part follow CSF signal characteristics on all imaging sequences (3).
Table 8.5 TYPES OF INTERHEMISPHERIC CYSTS ASSOCIATED WITH AGENESIS OF THE CORPUS CALLOSUM
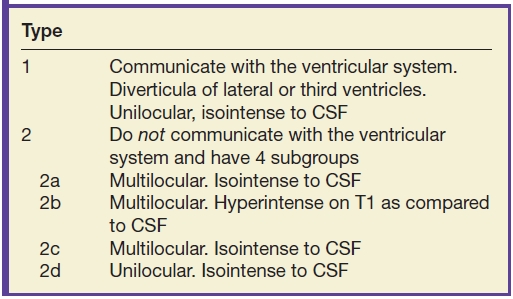
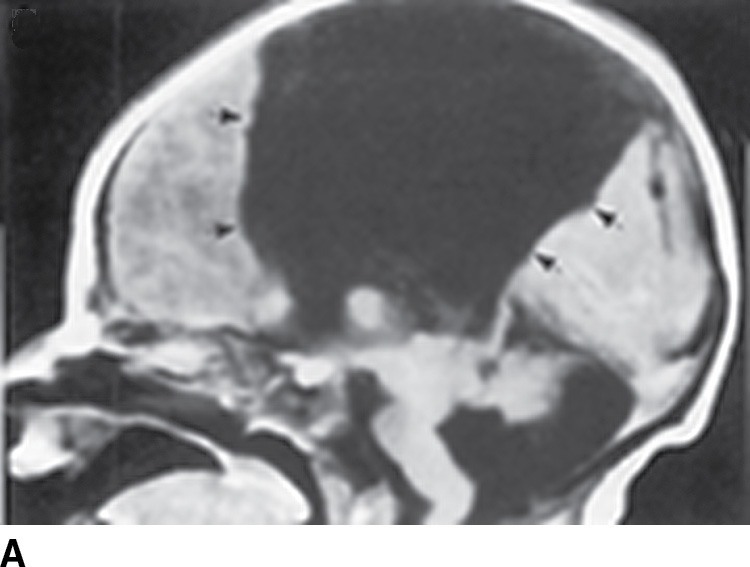
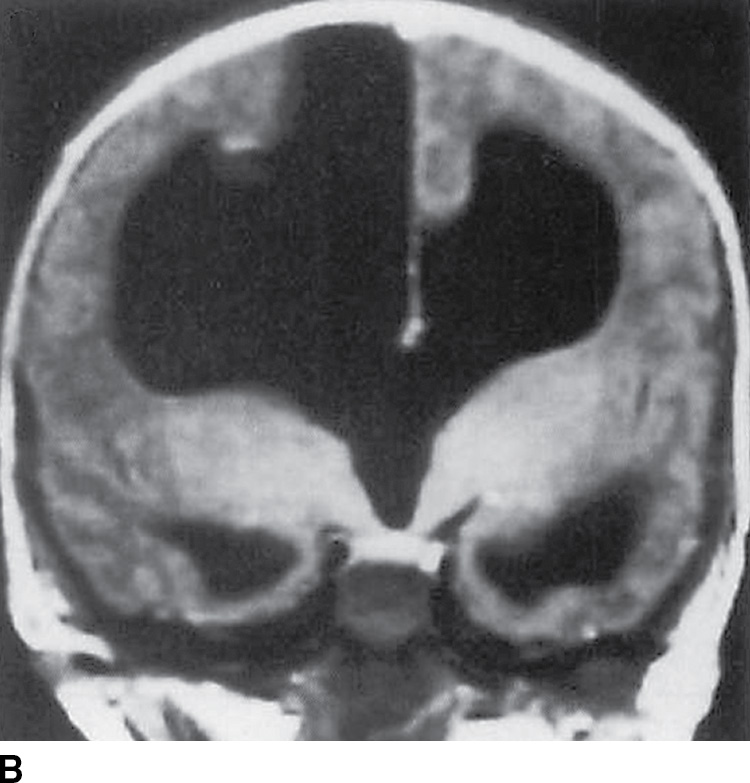
FIG. 8.2 Type 1 interhemispheric cyst. Sagittal (A) and coronal (B) T1-weighted images demonstrate absence of the corpus callosum and a large interhemispheric cyst (black arrows) where the cyst is seen to be continuous with the third and lateral ventricles and straddles the falx cerebri.
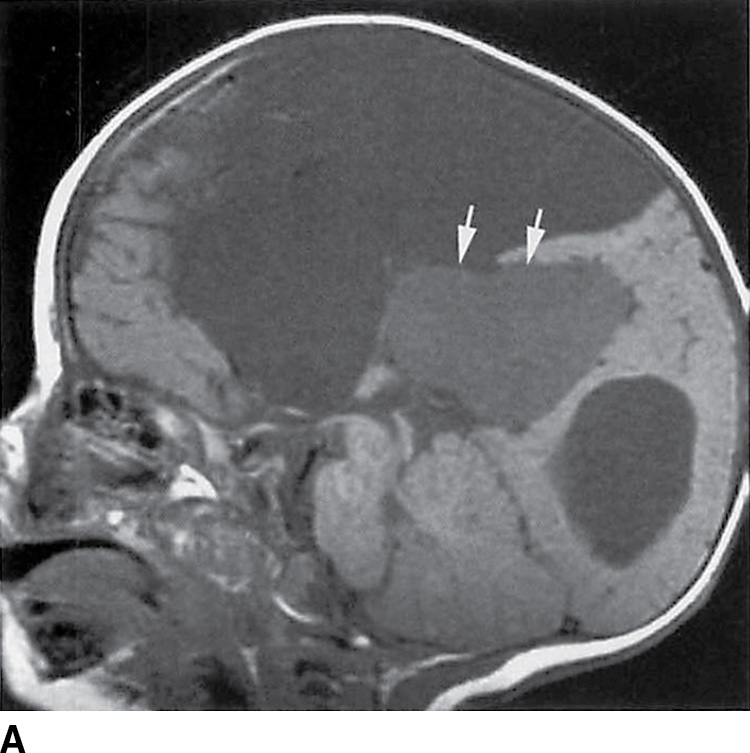
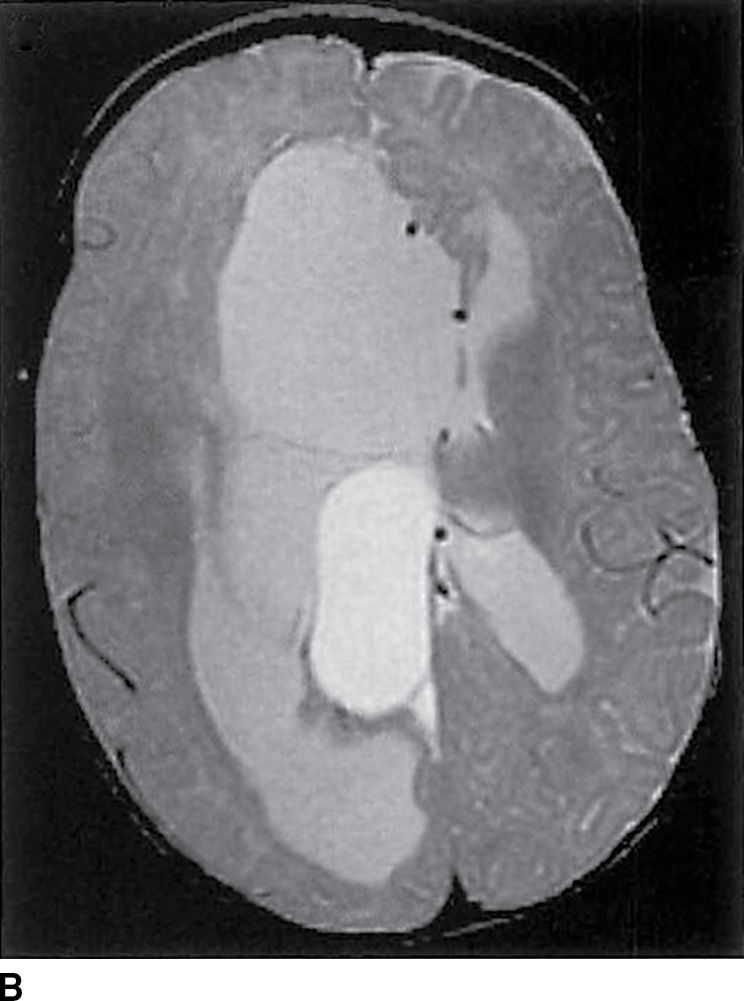
FIG. 8.3 Type 2 interhemispheric cyst. A: Sagittal T1-weighted image demonstrates absence of the corpus callosum with a dorsal interhemispheric collection of CSF intensity and a second collection (arrows), which is hyperintense as compared to CSF. B: Axial proton density image demonstrates multiple loculations between the hemispheres.
Malformations of cortical development are classified according to the embryologic stage of the cerebral cortex at which the abnormality occurred. In 2012, Barkovich et al. (13) updated the classification scheme of cortical malformations based on the stages of cortical development, which include neuronal/glial proliferation or apoptosis, neuronal migration, and postmigrational development. Underlying causes of cortical malformations include genetic mutations, destructive events such as infection or ischemia, and metabolic disorders (3).
Patients with malformations of cortical development may present with seizures, developmental delay (with spastic quadriparesis in severe cases), or cognitive impairment (14). In the workup of epilepsy or developmental delay, cortical malformations must be ruled out in every pediatric patient (3). Essential imaging techniques for the evaluation of cortical malformations include T1W volumetric 3D Fourier transform spoiled gradient echo with 1.0-mm partition size as well as 3D FLAIR and T2W 3D FSE to evaluate for subtle white matter abnormalities (3).
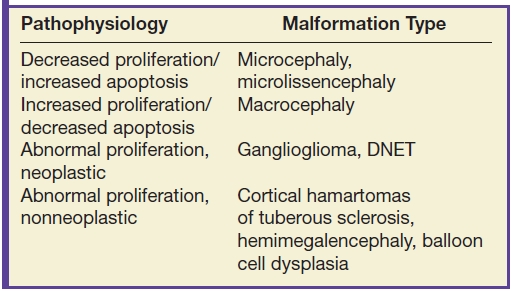
Malformations secondary to abnormal neuronal/glial proliferation may result from production of too many cells, too few cells, or abnormal cells (Table 8.6). Microcephaly is defined as a head circumference of three or more standard deviations below normal for age and gender (14). The disorder is diagnosed clinically by measuring head circumference; MRI is utilized to evaluate the cortex for focal or diffuse abnormalities, which include fewer than normal gyri with abnormally shallow sulci (simplified gyral pattern), callosal anomalies, or heterotopias among many other malformations (13–15). Microlissencephaly demonstrates a smooth cortical surface with a thick cortex (greater than 3 mm) (15).
Table 8.6 STEM CELL PROLIFERATION MALFORMATIONS
Focal cortical dysplasias (FCDs) are a heterogeneous group of lesions that may develop secondary to abnormal cell proliferation or abnormal layering of cells in the cortex. They are subdivided into three major groups as seen in Table 8.7. FCD is found in 15% to 20% of pediatric patients who undergo surgery for medically refractory epilepsy (3,16). In FCD type I, MRI is often normal, although it may show areas of high signal intensity in subcortical white matter. In FCD type II, abnormal cells are seen in the cerebral cortex and in the underlying white matter (17). Imaging findings include a linear or curvilinear focus of abnormal signal intensity extending from the cortical–white matter junction to the ventricular surface, often referred to as the “transmantle sign,” usually seen with FCD IIb (Fig. 8.4) (3,18). Additionally, the cortical–white matter junction can appear blurry on high-resolution T1W and T2W images; this is attributed to incomplete myelination and can be seen with FCD IIa (3). Furthermore, FCDs can have similar imaging findings as low-grade glial neoplasms and differentiating clues are included in Table 8.8.
Table 8.7 TYPES OF FOCAL CORTICAL DYSPLASIA
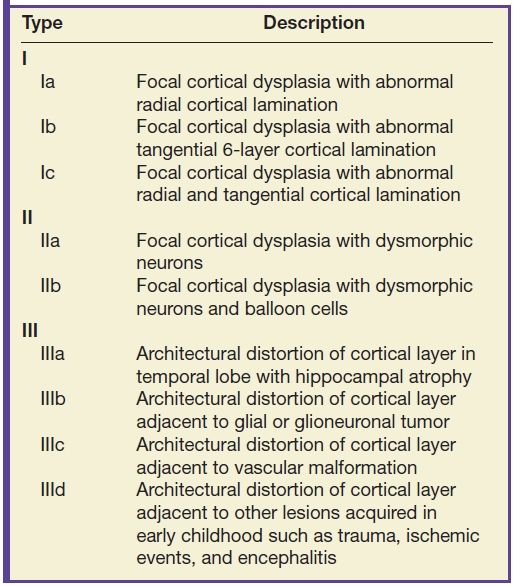
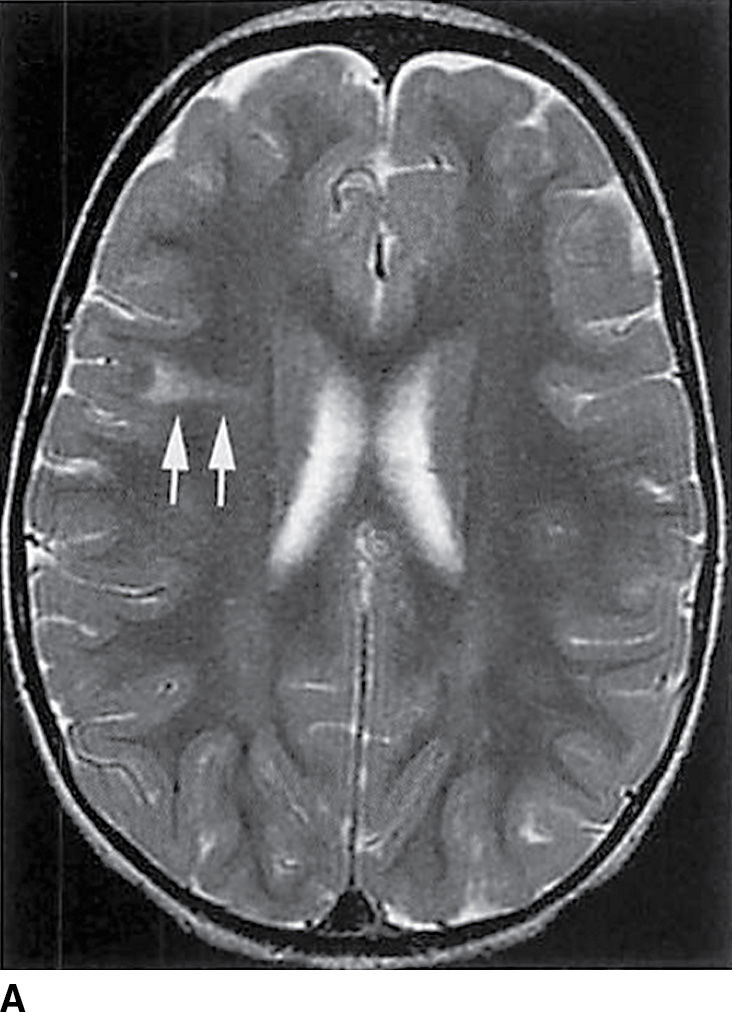
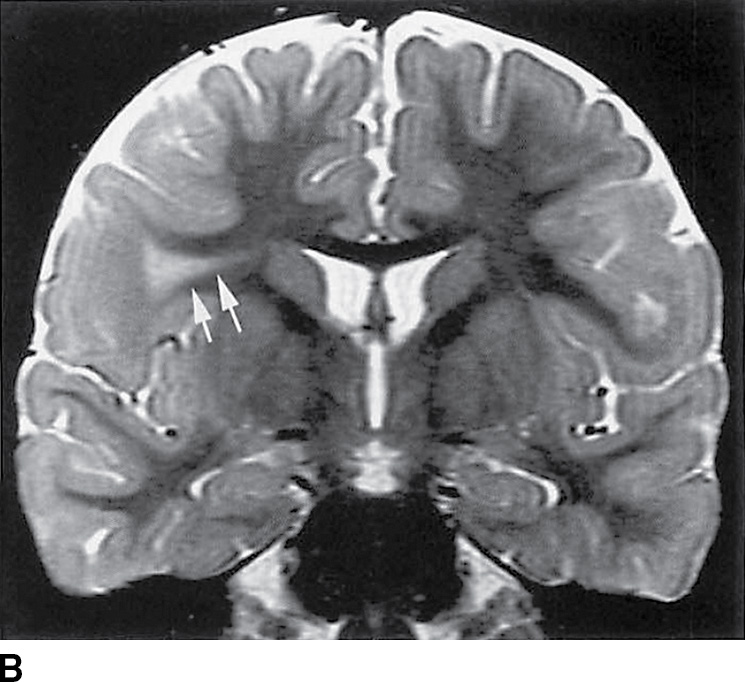
FIG. 8.4 Focal cortical dysplasia. Axial (A) and coronal (B) T2-weighted images demonstrate a hyperintense “transmantle” sign (arrows).
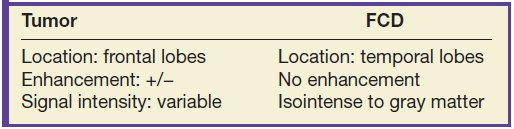
Table 8.8 DIFFERENTIATING FEATURES OF FOCAL CORTICAL DYSPLASIA VERSUS TUMOR
In hemimegalencephaly, overgrowth of all or part of the affected cerebral hemisphere is present secondary to abnormal cell proliferation. Clinical presentation includes epilepsy, mental retardation, hemiparesis, and hemianopsia and may include hemihypertrophy of the face, trunk, and limbs (14,19). On imaging, multiple abnormalities are detected including focal or hemispheric enlargement of the cortex, which appears dysmorphic, with broad gyri, shallow sulci, and blurring of the gray–white junction (14) (Fig. 8.5). Additionally, the ipsilateral lateral ventricle is enlarged with a characteristic shape of the frontal horn that appears straight and pointed anteriorly and superiorly (15).
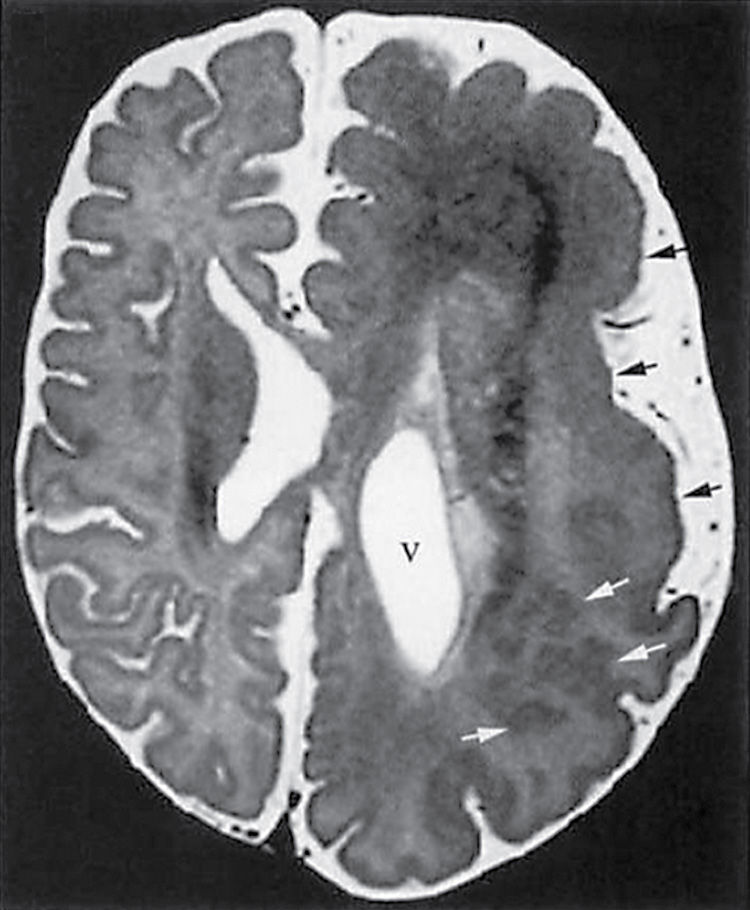
FIG. 8.5 Hemimegalencephaly. Axial T2-weighted image demonstrates multiple abnormalities in a case of hemimegalencephaly with polymicrogyria (black arrows) and subcortical heterotopia (white arrows) as well as ipsilateral enlargement of the ventricle (v).
Malformations of cortical development secondary to abnormal neuronal migration include lissencephalies and heterotopias. Lissencephaly is a severe form of abnormal neuronal migration characterized by a smooth brain with absence of gyri and a thickened cortex or presence of a few broad gyri with a variably thickened cortex (14,20). Multiple subcategories of lissencephaly have been described in the literature, including classic lissencephaly and several variant forms. In nearly all, the clinical presentation includes diffuse hypotonia, early developmental delay, seizures, and mental retardation (14). On MR imaging, there is a smooth appearance of the cortical surface; the cortex is thick with vertical orientation of the sylvian fissures demonstrating a “figure-of-eight” appearance on axial images (Fig. 8.6) (14,15). Furthermore, the white matter volume is decreased. The basal ganglia however are usually normal.
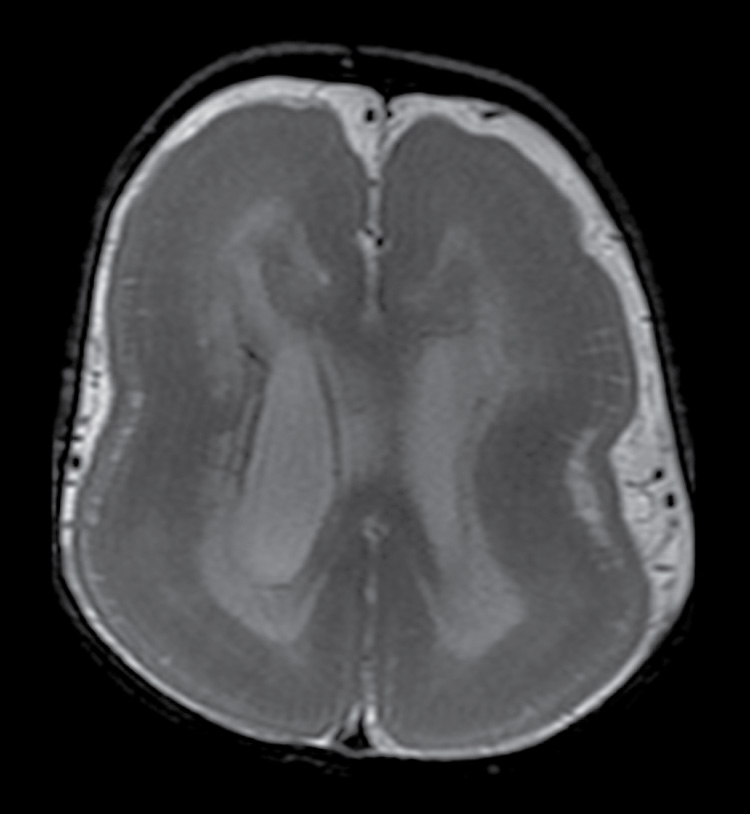
FIG. 8.6 Lissencephaly. Axial T2-weighted image demonstrates a “figure-of-eight” or “hourglass” configuration of the cerebral hemispheres with absence of sulci and thickened cortex.
Heterotopias are focal collections of normal neurons in abnormal locations secondary to interrupted neuronal migration. Patients with heterotopia often present with seizures. Heterotopias are classified as periventricular (subependymal), subcortical, or leptomeningeal (3). Periventricular nodular heterotopia results from lack of radial neuronal migration and can be sporadic or familial (14,21). On imaging, periventricular nodular heterotopias appear as ovoid lesions that are isointense to gray matter on all sequences and are primarily confined to the frontal horns, trigones, and temporal and occipital horns (Fig. 8.7) (3). Unlike subependymal hamartomas of tuberous sclerosis, which are isointense to myelinated white matter and can also be seen in a subependymal/periventricular location, heterotopias are isointense to gray matter and do not enhance. Subcortical heterotopias differ from periventricular heterotopias in that these nodular masses develop in the white matter as swirling, irregular, curvilinear areas of ectopic gray matter (Fig. 8.8) (22). The affected hemisphere is small with a thin cortex, shallow sulci, and overall decreased white matter volume (14). A subcortical heterotopia may appear to have mass effect on the adjacent ventricle, so it is important to use imaging clues, such as lack of enhancement, isointense signal to gray matter, lack of associated edema, and diminished volume in the affected region of brain, to differentiate this entity from tumor.
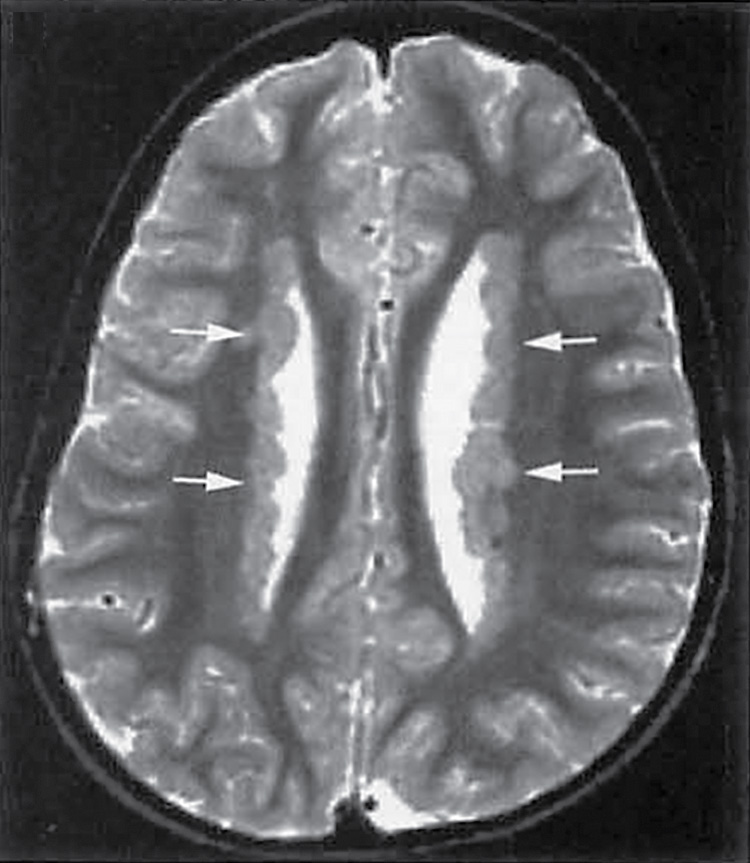
FIG. 8.7 Subependymal heterotopia. Axial T2-weighted image demonstrates gray matter heterotopia (arrows) along the ventricular bodies.
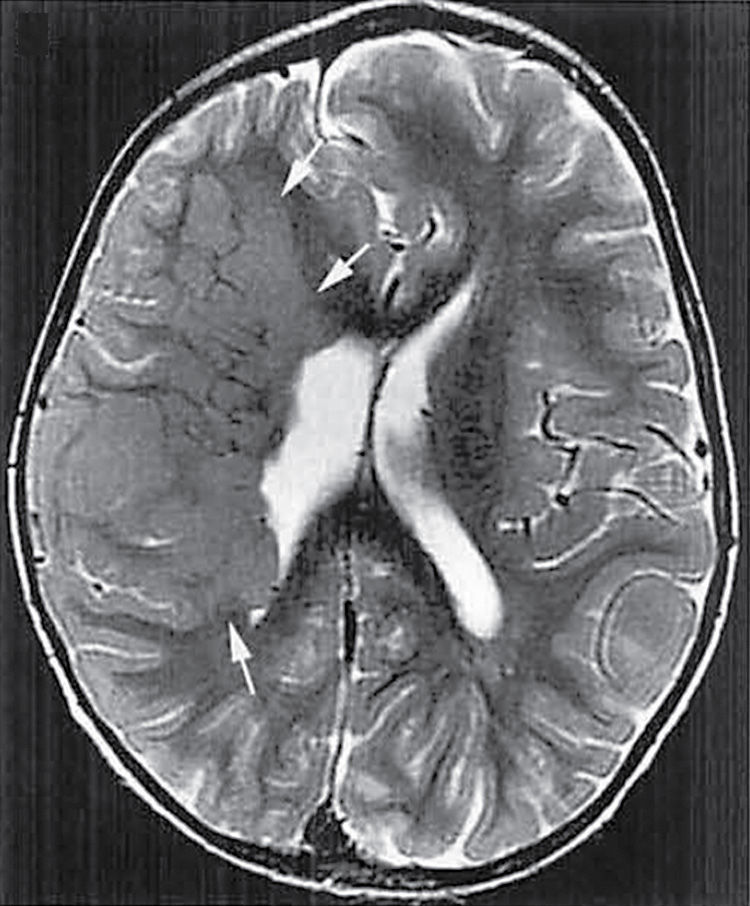
FIG. 8.8 Subcortical heterotopia. Axial T2-weighted image demonstrates a large curvilinear swirling mass of gray matter (arrows) extending from the ventricular surface to the cortex.
Postmigrational development of the cortex includes synaptogenesis and neuronal maturation, which lead to normal cortical morphology and function (14). Malformations from abnormal postmigrational development include polymicrogyria and schizencephaly. Polymicrogyria results from abnormal development of the upper layer of the cortex, manifesting as small gyri separated by small sulci, with fusion of the overlying molecular layer of the cortex. The result is an irregular, undulating cortical surface (23). Polymicrogyria can be unilateral/focal, hemispheric, multifocal, or bilateral and symmetrical. Most commonly, polymicrogyria is seen in the region of the sylvian fissures (greater than 60%), followed by the frontal lobes (3,14). Patients present with developmental delay and, more commonly, seizures. Imaging findings include an apparent slight thickening of the cortex (the cortex is really too thin, but the undulations make it look thick) with an irregular, undulating cortical surface (Fig. 8.9) (3). Two distinct patterns have been described with polymicrogyria: normal to thinner appearing cortex with small fine undulating surface and thicker appearing cortex with a smoother surface (15). The difference is secondary to the degree of subcortical myelination, with the unmyelinated regions demonstrating an undulating pattern of the deep boundary (3). In addition to the abnormal cortical appearance, veins can also be seen in the subarachnoid space near polymicrogyria secondary to anomalous venous drainage (3). It is important to recognize that these vessels, which are often seen in the infolding of the thickened cortex, do not represent vascular malformations and therefore do not require further workup with angiography (3).
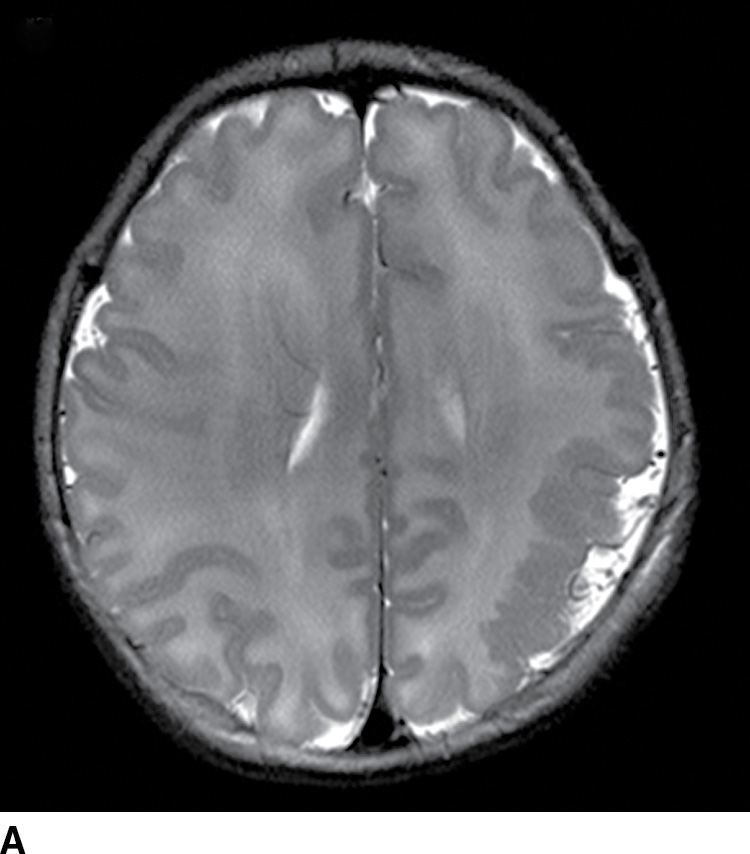
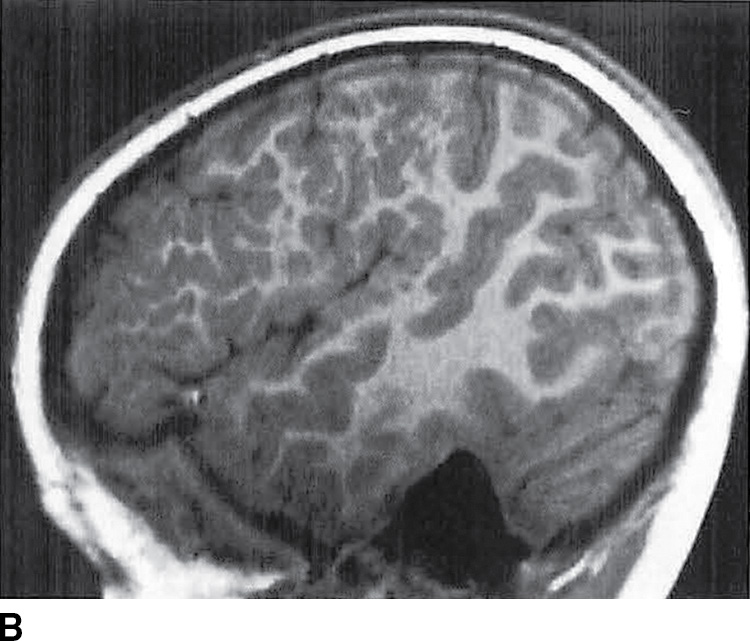
FIG. 8.9 Polymicrogyria. Axial T2-weighted image (A) and sagittal T1-weighted image (B) demonstrate focal polymicrogyria in the left cerebral hemisphere.
Schizencephaly is characterized by gray matter–lined clefts that extend from the cortex to the ventricular surface. Patients often present with seizures, developmental delay, and hemiparesis. The malformation results from disruption of the entire cerebral mantle secondary to infectious or ischemic injury (14). On imaging, the schizencephalic clefts are divided into two types, fused lip and separated (open) lip, and can be unilateral or bilateral (Fig. 8.10) (3).
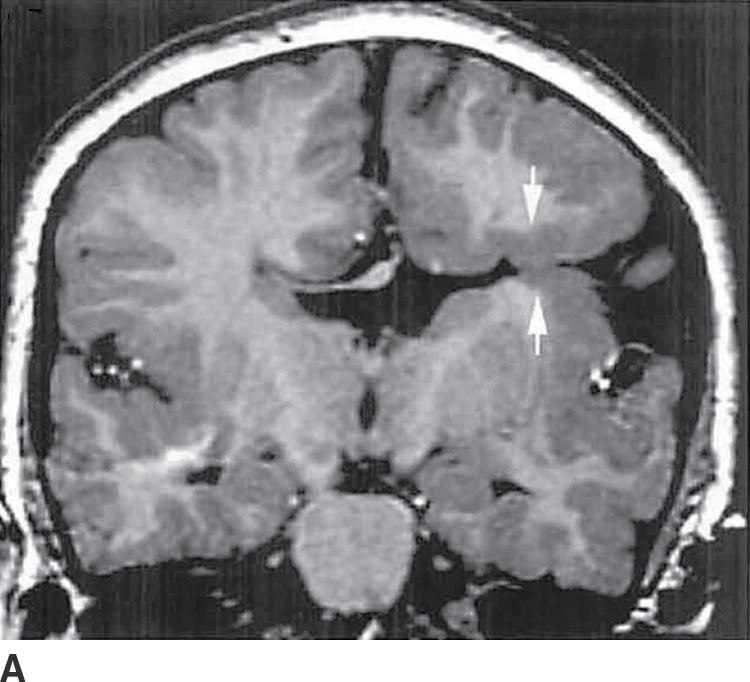
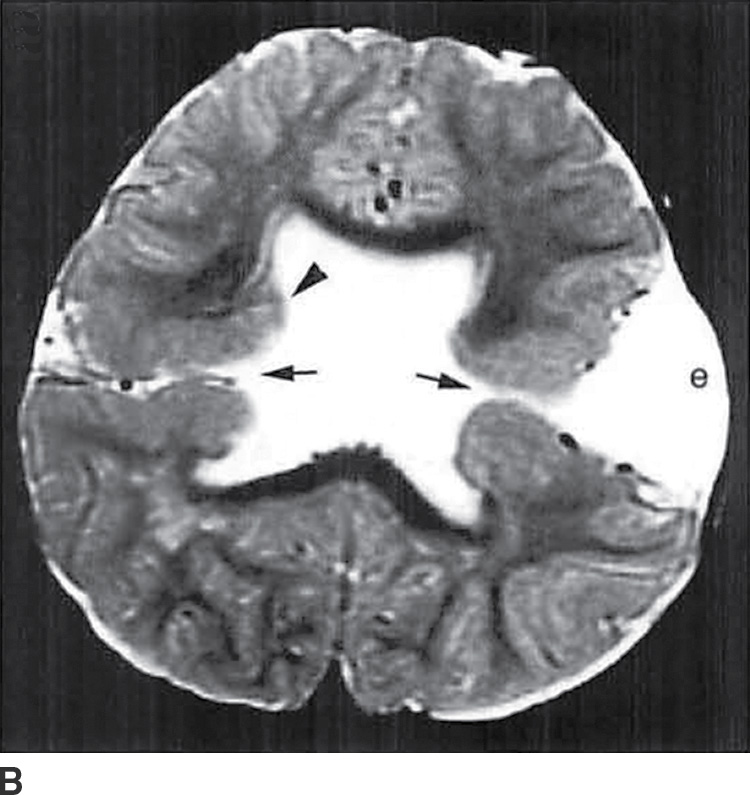
FIG. 8.10 Schizencephaly. A: Coronal T1-weighted image demonstrates abnormal gray matter extending from the cortex to the ventricular surface in closed lip lissencephaly. B: Axial T2-weighted image demonstrates bilateral open-lip schizencephaly with open CSF clefts (arrows) and irregular gray matter (arrowhead) lining the clefts as well as an expanded left calvarium (e).
Anomalies of Ventral Prosencephalon Development
Ventral induction occurs during the 5th through 10th weeks of gestation when the three primary vesicles including the prosencephalon, mesencephalon, and rhombencephalon differentiate to form the forebrain, midbrain, and hindbrain (14). Anomalies of ventral prosencephalon development include primarily holoprosencephaly (HPE) and septooptic dysplasia. Additional anomalies of ventral induction, which will not be discussed in this chapter, include arrhinia/arhinencephaly and isolated absence of the septum pellucidum.
HPE is the most common congenital malformation of the forebrain with a live birth prevalence of 1 in 10,000 (14). There are multiple underlying causes ranging from disorders of carbohydrate metabolism and maternal diabetes to mutations of genes important in patterning of the anterior neural plate to environmental etiologies such as teratogens (14). HPE is characterized by failure of formation of midline structures of the forebrain as well as the face (3). Clinically, patients have variable presentations depending on the severity of the malformation. In more severe cases, patients do not survive beyond infancy. However, in milder forms, patients can present with seizures, movement disorders, and developmental delay (3,24). Although the DeMyer classification divides HPE into three subtypes with variable degrees of forebrain cleavage, it is important to know that there is a continuum among the imaging findings (3,24).
Important key imaging features of the different subtypes of HPE in the DeMyer classification are listed in Table 8.9. All forms of HPE have absence of the septum pellucidum and continuity of the cerebral hemispheres across the midline. Alobar HPE is the most severe and most common form of HPE. Affected patients are often stillborn or have a short life span, while the survivors have severe facial deformities (including cyclopia, proboscis, and cleft lip/palate), fail to achieve early milestones, and develop early seizures and spasticity (3,24). The interhemispheric fissure, falx cerebri, septum pellucidum, and corpus callosum are absent (3). Imaging findings demonstrate small, fused basal ganglia and thalami with a monoventricle and a cerebrum consisting of a round “ball” or curved “pancake”-flattened mass of tissue anteriorly surrounding a crescentic single ventricle (14) (Fig. 8.11). Additionally, a dorsal cyst communicating with the monoventricle is frequently present.
Table 8.9 ANATOMIC CLASSIFICATION OF HOLOPROSENCEPHALY
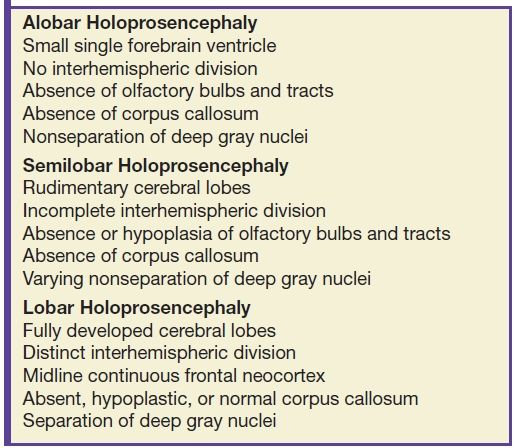
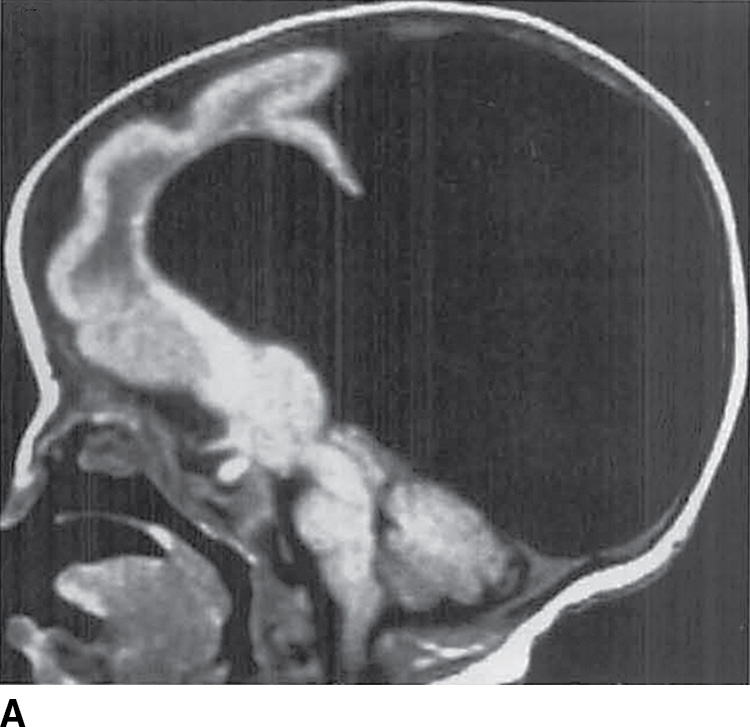
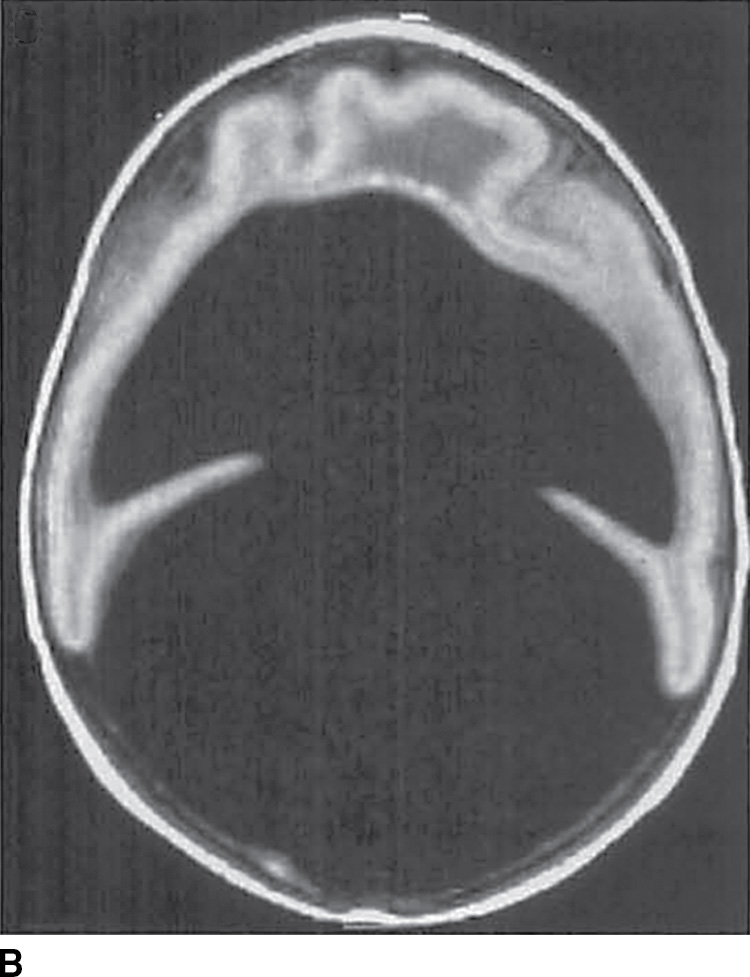
FIG. 8.11 Alobar holoprosencephaly. Sagittal (A) and axial (B) T1-weighted images demonstrate a large monoventricle with a mantle of thin cortex and a large dorsal cyst.
Semilobar HPE represents a less severe form of prosencephalic developmental malformation with partially formed interhemispheric fissure and falx cerebri posteriorly. The anterior frontal regions of the brain, however, remain underdeveloped and continuous across the midline (3). It is important to note that in the case of HPE, development of the corpus callosum more anteriorly corresponds to better development of the brain, as the callosal axons cannot cross the midline in the absence of a normal interhemispheric fissure (3). In semilobar HPE, at least some of the corpus callosum anteriorly is present (as opposed to the alobar form), and therefore, the forebrain is better developed, correlating with improved prognosis. MR imaging of semilobar HPE demonstrates separation of the cerebral hemispheres and partial formation of a shallow interhemispheric fissure posteriorly with absence of the falx cerebri anteriorly as seen in Figure 8.12 (14).
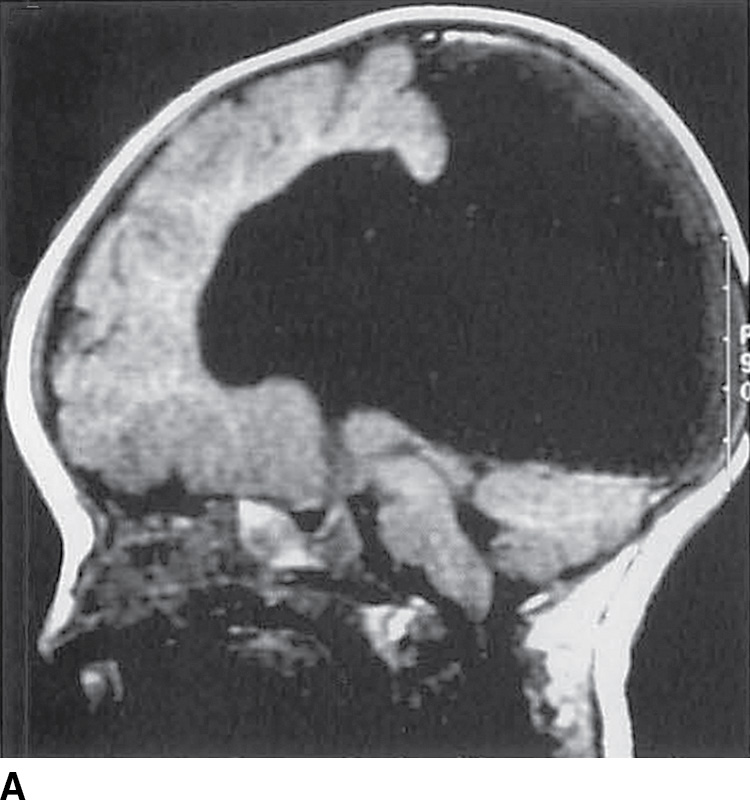
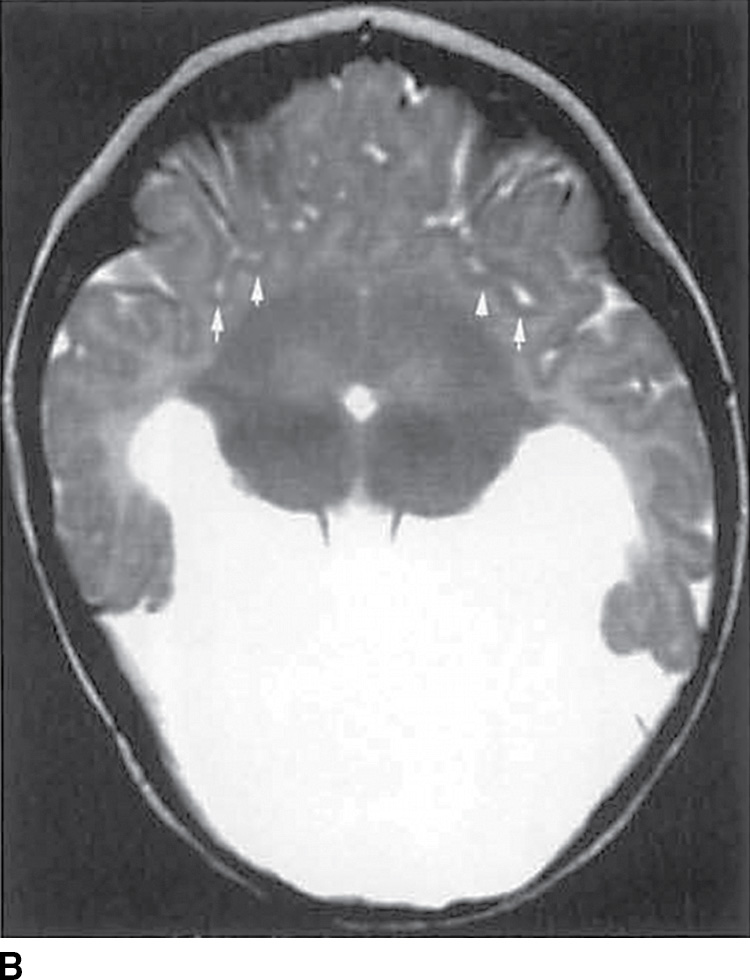
FIG. 8.12 Semilobar holoprosencephaly. Sagittal T1-weighted (A) and axial T2-weighted (B) images demonstrate semilobar HPE with abnormal anterior sylvian fissures (arrows), fused basal ganglia and thalami, and absence of the septum pellucidum.
Lobar HPE is the least severe of the three types of HPE. Abnormalities are confined to the rostral cerebrum, while the parietal, occipital, and temporal lobes are well formed. Clinical manifestations include developmental delay and visual problems (3). On imaging, the third ventricle is fully formed and the right and left lateral ventricles are separated; some continuity across the midline is present in the frontal cortex (24) (Fig. 8.13).
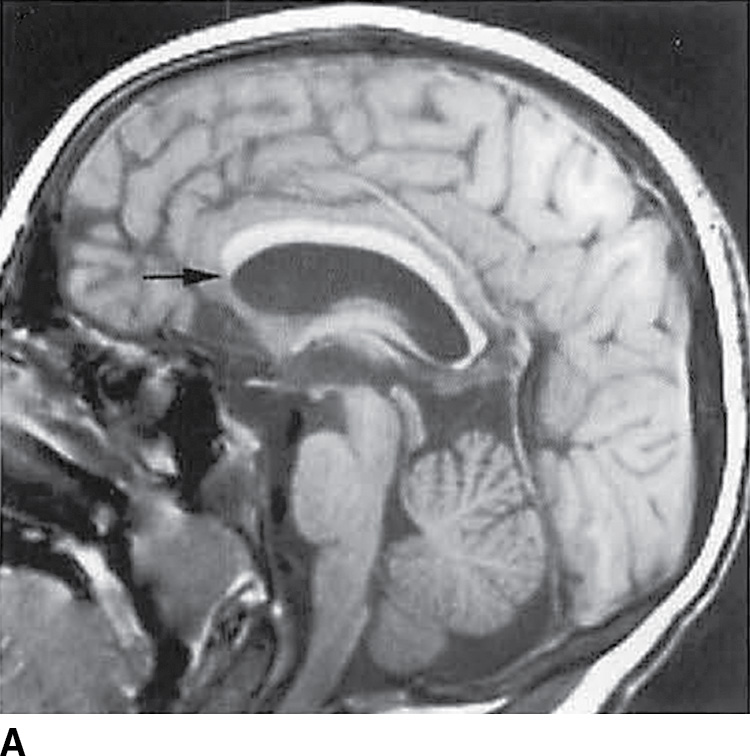
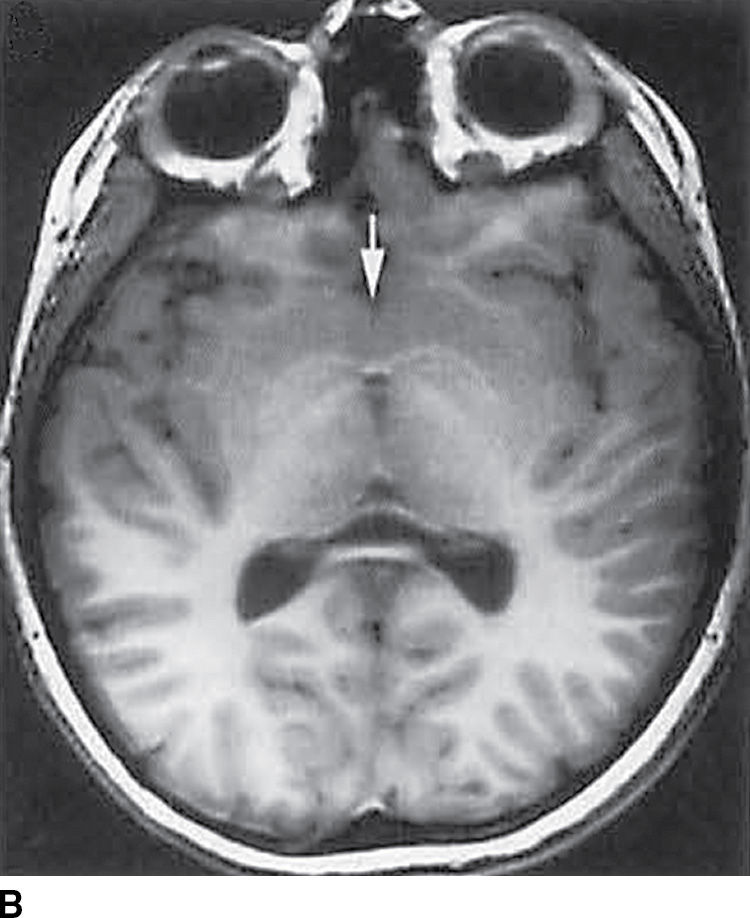
FIG. 8.13 Lobar holoprosencephaly. Sagittal (A) and axial T1-weighted (B) images demonstrate findings of lobar HPE with anterior corpus callosum terminating at the superior genu (black arrow) and continuity of the caudate nuclei across the midline (white arrow).
A variant of HPE known as the middle interhemispheric variant (MIH) or syntelencephaly was described in 1993 (25). MIH also demonstrates failure of complete cleavage of the cerebrum into two separate hemispheres (3,26). However, the underlying embryology differs with the lack of hemispheric separation arising secondary to abnormalities of the embryonic roof plate, as opposed to the floor plate in classic HPE (26). Imaging findings include normal basal ganglia and separation of the anterior frontal and occipital lobes by an interhemispheric fissure but absence of hemispheric separation in the posterior frontal and parietal lobes (14,26) (Fig. 8.14).
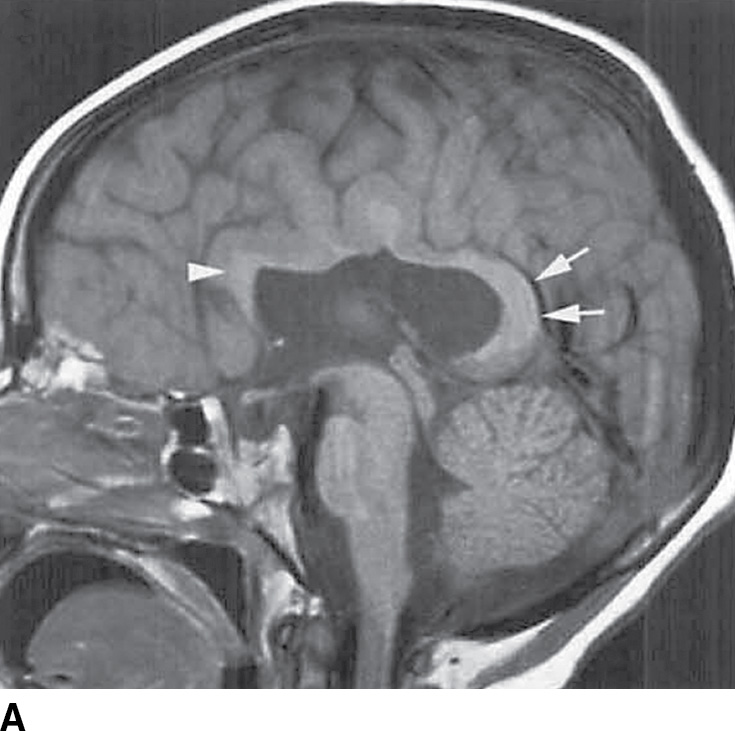
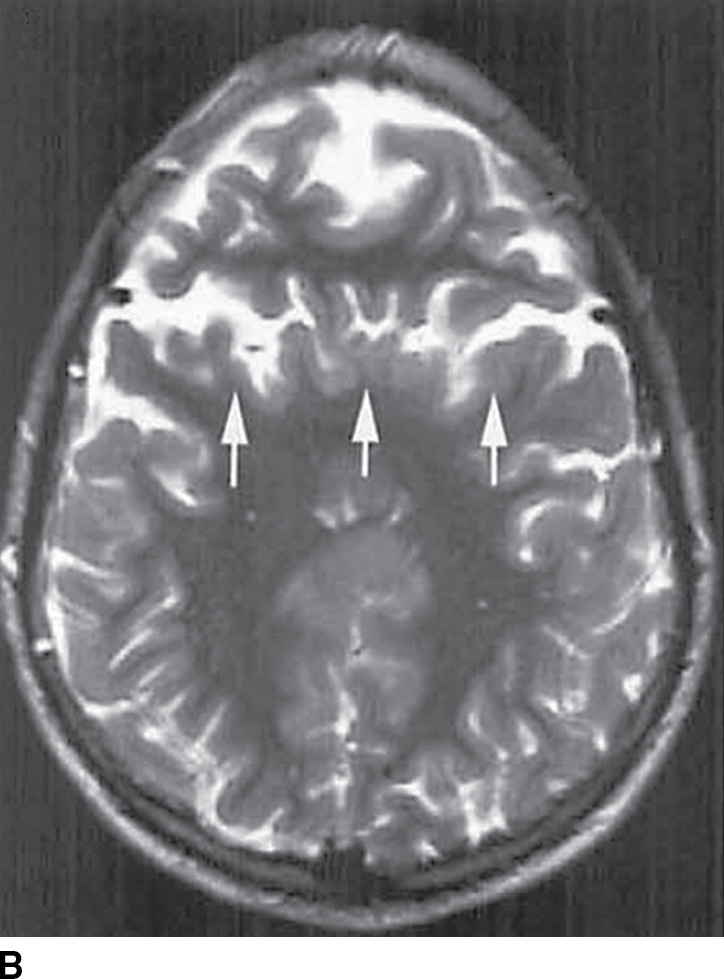
FIG. 8.14 Middle interhemispheric variant. A: Sagittal T1-weighted image shows a callosal splenium (arrows) and genu (arrowhead) without intervening callosal body. B: Axial T2-weighted image demonstrates sylvian fissures, which meet over the cerebral hemispheres (arrows).
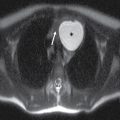
Septooptic dysplasia, first described by de Morsier in 1956, is defined by the presence of two major findings: hypoplasia of the optic nerves and hypoplasia or absence of the septum pellucidum (3). Additionally, up to two-thirds of patients also have hypothalamic–pituitary dysfunction secondary to pituitary gland hypoplasia (3). Clinically, patients can present with visual problems as well as endocrine dysfunction. Imaging findings include hypoplasia or absence of the septum pellucidum with a boxlike configuration of the frontal horns as well as hypoplasia of the optic nerves, best visualized on thin section coronal MR images (3) (Fig. 8.15).

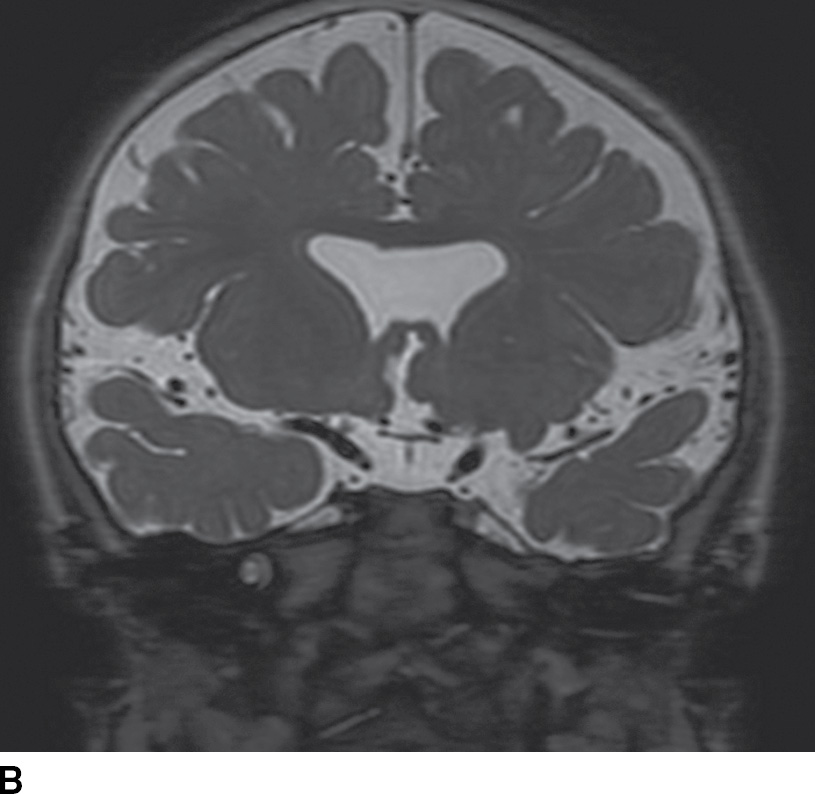
FIG. 8.15 Septooptic dysplasia. Axial (A) and coronal (B) T2-weighted images demonstrate absence of the septum pellucidum and small optic nerves and chiasm.
Related posts:
Stay updated, free articles. Join our Telegram channel

Full access? Get Clinical Tree


