Fig. 17.1
This timeline represents the milestones in the validation process of ultrasound contrast agents for lesion characterization and evaluation of antiangiogenic treatments including guidelines. Abbreviations: EFSUMB European Federation of Societies for Ultrasound in Medicine and Biology, WFUMB World Federation for Ultrasound in Medicine and Biology, PFS progression-free survival, OS overall survival
Table 17.1
This table summarises the different microbubbles according to the gas and the shell
Ultrasound contrast agents | |||
|---|---|---|---|
Agent | Shell | Gas | Company |
Echovist® | Galactose microparticles | Air | Schering |
Levovist® | Galactose 99 % + palmitic acid 0.1 % | Air | Schering |
Optison® | Human serum albumin | Perflutren (C3F8) | GE Healthcare |
SonoVue® | Phospholipids | Sulphur hexafluoride (SF6) | Bracco Imaging |
Definity® | Phospholipid bilayer | Perflutren (C3F8) | Bristol Meyer Squibb |
Sonazoid® | Phospholipids | Perfluorocarbon | GE Healthcare |
Imagent® | Surfactant | Perflexane (C6H14) + air | Imcor Pharmaceuticals |
AI-700 | Synthetic biodegradable polymers (PLGA) | Perfluorocarbon | Acusphere |
CardioSphere® | Polymer bilayer | Nitrogen (N2) | Point Biomedical |
17.2.2 How to Increase Signal to Noise Ratio
Their contrast behaviour under ultrasound is based on the fact that the gas they contain contracts and expands under the alternating higher and lower pressure phases of the sound beam. Importantly, this contraction and expansion is asymmetric: they resist compression more than expansion (i.e. their response is non-linear), and therefore the echoes they return are distorted compared to the sinusoidal waveform of the transmitted ultrasound beam. This means that the echoes contain harmonics, unlike tissue echoes, and these harmonic components can be detected using multipulse sonication approaches. A very successful choice, known as phase inversion imaging, is to transmit a pair of pulses along each ultrasound line, each with opposite phase [12]. Since tissue’s response is broadly linear, when the echoes from such a pulse pair are summed, they cancel out, while the sum of the inverted pair from microbubbles add. Thus, a microbubble-only image can be created, albeit at half the normal frame rate. In the DCE-US studies performed in our institution, a single intravenous bolus of 4.8 mL of the contrast agent consisting of sulphur hexafluoride-filled microbubbles (SonoVue; Bracco, Milan, Italy) is administered [13] Recording of the investigation together with timing is initiated as soon as the contrast agent is injected. A total of 720 images are acquired during each 3-min examination (Fig. 17.2).
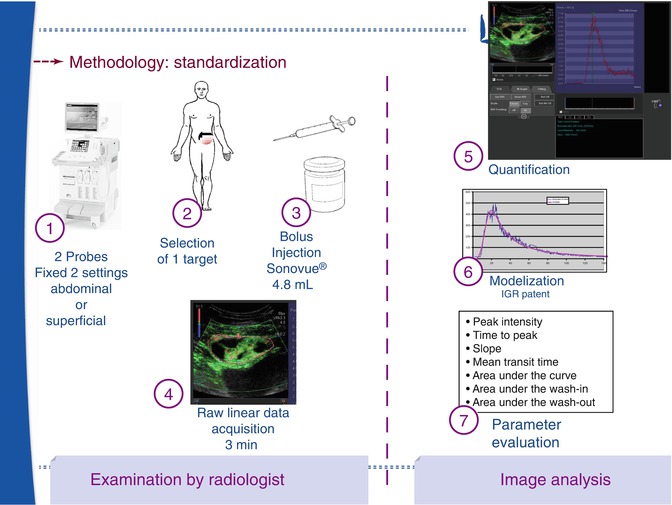

Fig. 17.2
This scheme represents the standardisation of the DCE-US acquisition: with fixed settings of the US machine, the radiologist selects an appropriate target with the best acoustical window. After a bolus injection of SonoVue, raw data are recorded over 3 min. In our institution, the radiologist selects a region of interest and after tracking, the automatic modelisation is applied to calculate 7 vascular parameters
In SonoVue®, the microbubbles are filled with sulphur hexafluoride (SF6) and stabilised by a shell of amphiphilic phospholipids [8]. The mean diameter of the microbubbles is 3 μm, which means that they are confined to the circulation and they are distributed through the whole blood volume, which is ideal for the evaluation of perfusion. Properties of the SF6 gas include that it is innocuous, stable and inert. In addition, it is resistant to pressure changes and gives a good nonlinear response when insonated at low acoustic power, providing continuous real-time ultrasonographic (US) imaging without bubble destruction.
17.2.3 Easy to Use
SonoVue® is presented as a vial of SF6, a powder combining phospholipids and pharmaceutical grade polyethylene glycol, and a syringe pre-filled with 5 mL of 0.9 % sodium chloride. Before each ultrasound examination, the contrast agent is reconstructed by introducing the contents of the syringe into the vial followed by manual shaking for at least 20 s. The microbubbles are naturally buoyant and tend to accumulate at the top of the vial after standing for a few minutes: in order to ensure that the preparation is homogeneous for bolus injection, the vial is shaken before each administration. SonoVue® is usable for up to 6 h.
17.3 Qualitative and Quantitative Analysis of DCE-US
The first studies used only qualitative analysis after bolus injection in patients with sarcomas, GIST or RCC [14–16]. The development of perfusion [17] and quantification software, beginning in 2006, enabled quantitative analysis for calculating features linked to blood flow and blood volume. This new methodology, using raw linear ultrasound data [18], has been developed to produce more robust and quantitative indices. A single intravenous bolus of 4.8 mL of the contrast agent is administered. The recording of the contrast-specific data together with timing is initiated, as soon as the contrast agent is injected.
For the time intensity curve (TIC) analysis, a single-plane imaging is usually performed following each bolus injection at 4 frames per second, which is a very high temporal resolution compared to other functional imaging techniques, over the duration of the ultrasound contrast enhancement. The average intensity within a region of interest (ROI) is displayed as a function of time which describes the wash-in and wash-out of the contrast agent in the ROI. One advantage of this method of quantification is the linear relation [13] between the microbubble concentration and the signal intensity [19]. Tracking software is now available, to correct for breathing movement, and is crucial to allow quantification of acquisitions [20].
Analyses based on the least-squares method can be performed with curve fitting software (Patent: WO/2008/053268 entitled “Method and system for quantification of tumoral vascularization”) to derive the coefficients of the fitted curve, including wash-in and wash-out times. This allows functional indices to be determined, of which the most important are the peak intensity (PI), area under the curve (AUC), area under the wash-in (AUWI) and the area under the wash-out (AUWO) (all corresponding to blood volume); time to peak intensity (TPI) and the slope of the wash-in (SWI) (both corresponding to blood flow); and the mean transit time (MTT). A difference between DCE-US and DCE-CT or DCE-MRI is that permeability information cannot be obtained, because microbubbles are confined to the vascular space, behaving as true blood pool agents [21].
17.4 Blood Volume Using DCE-US as Surrogate Marker of Vascularisation
Several studies using quantitative techniques of DCE-US with bolus injection in RCC, HCC and GIST in phase I clinical trials have been published [22–24]. These have shown that indices representing blood volume calculated after 2 weeks of treatment correlated with the RECIST response but were apparent much earlier. In two studies of treatment response of RCC and HCC, the authors demonstrated a good correlation with both progression-free survival (PFS) and overall survival (OS) [22, 23].
In order to strengthen the level of evidence, a French multicentre study was set up to enrol patients with various types of tumours, approximately half of which were located outside the liver, with a majority of metastatic RCC, but also including GIST (Fig. 17.3), colon cancer, melanoma (Fig. 17.4), breast cancer and primary HCC. All patients were treated with antiangiogenic drugs alone or with a combination of two drugs (antiangiogenic + conventional chemotherapy or two antiangiogenic drugs). The preliminary results in this study of 539 patients indicated that the AUC, which is related to the blood volume, is one of the indices that best correlates to response at 6 months in both good and poor responders [25]. It had previously been demonstrated that the variability of this index was less than 15 % in preclinical studies [26


Stay updated, free articles. Join our Telegram channel

Full access? Get Clinical Tree


