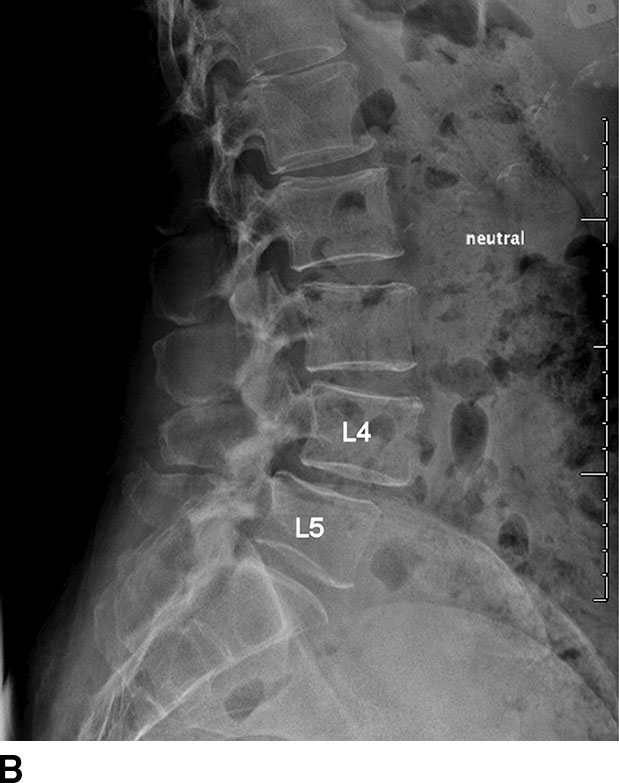
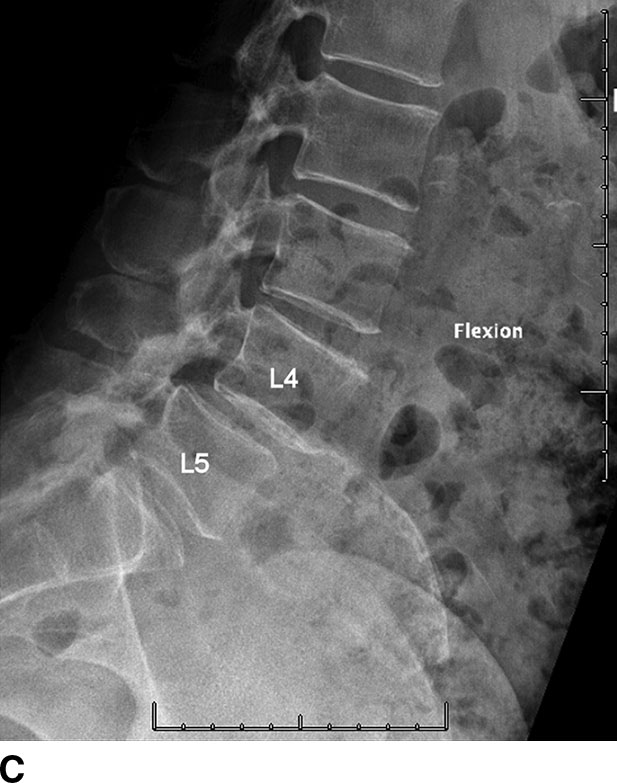
FIG. 12.1 Lateral radiograph of lumbar spine in extension (A), neutral, (B), and flexion (C) positions. Note the anterolisthesis of L4 over L5. The addition of radiographs with the spine in different positions provides assessment of dynamic stability of the spine. Change in alignment of the spine during different positions indicates instability. This additional diagnostic information may alter patient management.
Radiography is routinely used for postoperative follow-up because of its excellent depiction of spinal hardware placement and related complications. Unlike CT, radiography is not affected by metal image artifact that can hinder evaluation of the postoperative spine (Fig. 12.2).
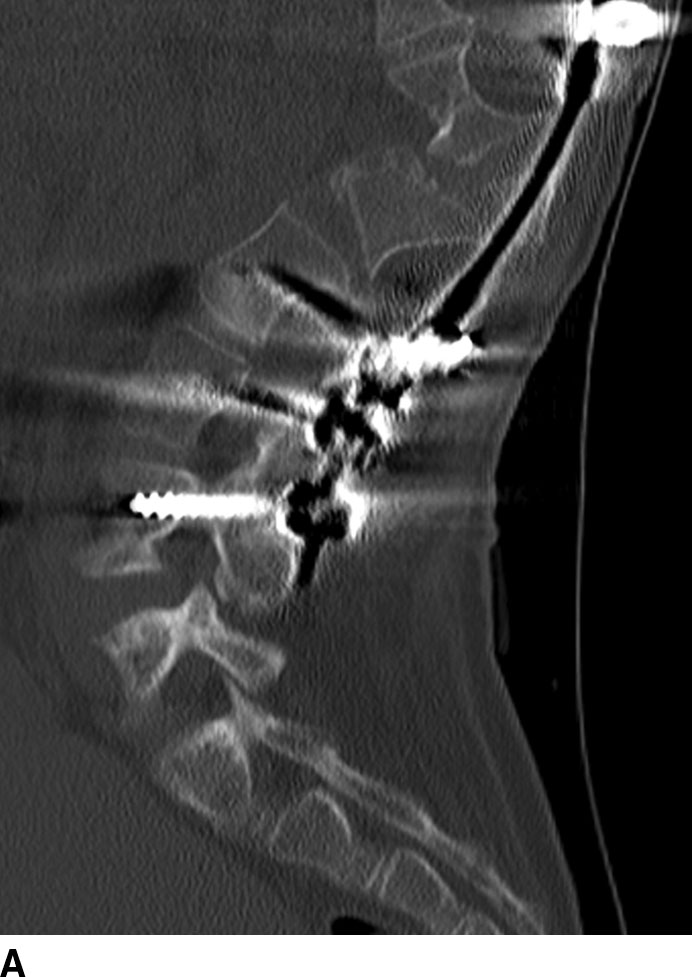
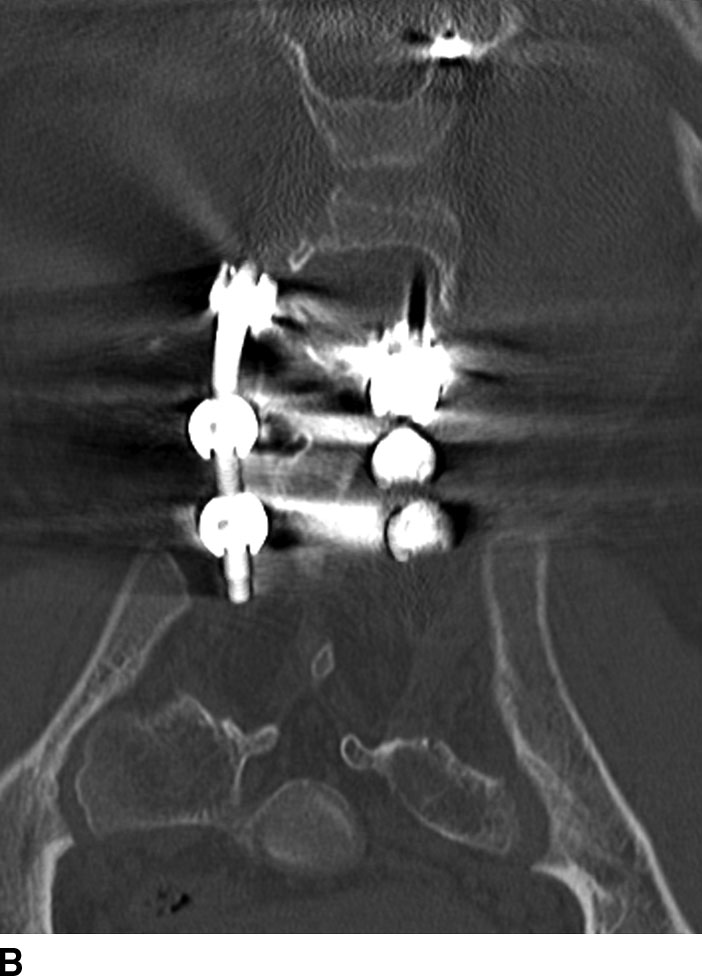
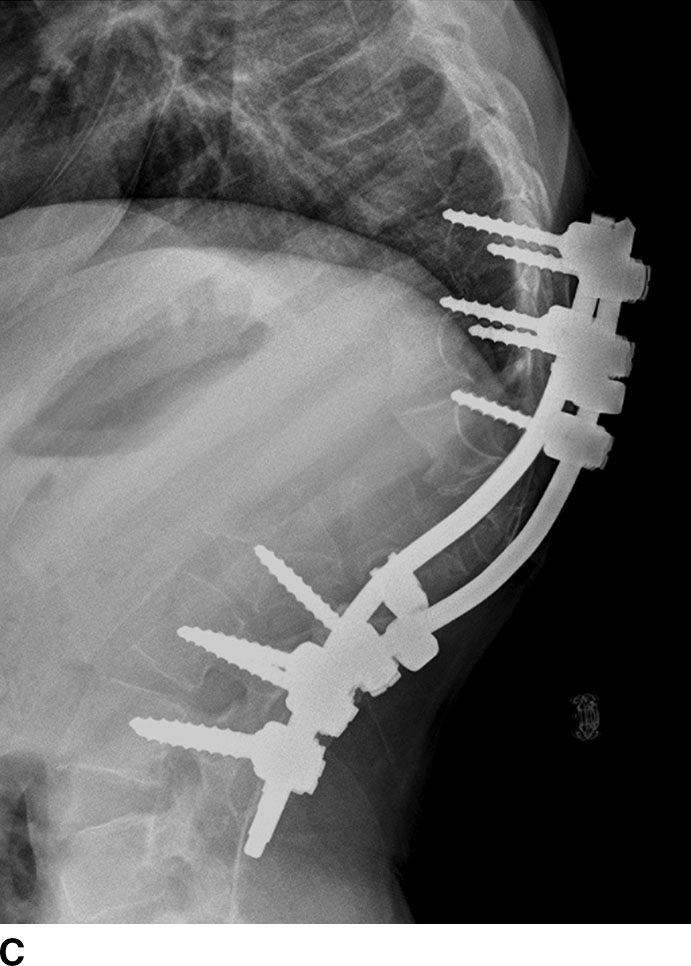
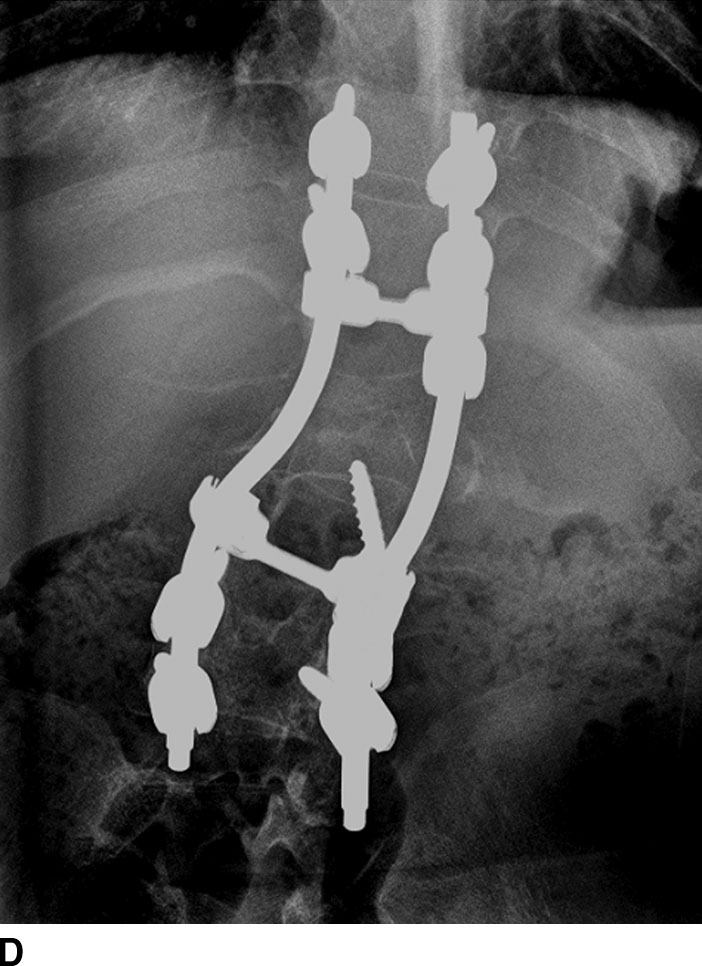
FIG. 12.2 CT with bone reconstruction in sagittal (A) and coronal (B) planes and radiographs in lateral (C) and anteroposterior (D) projections for a patient with spinal rods in the thoracolumbar spine. The spinal rods were placed for treatment of scoliosis. Note the significant metallic artifacts on the CT, causing obscuration of image details in the surrounding area. The placement of the hardware is well visualized on the radiographs. The absence of image artifacts and its low cost make radiography the preferred modality for routine follow-up of patients after orthopedic instrumentation.
Radiography has severe limitations in direct imaging of the soft tissues. Anatomy and pathologic changes involving the soft tissues are often indirectly imaged based on the associated changes in the adjacent bony structures. For example, in degenerative disk disease, rather than revealing the actual signal changes of the intervertebral disks, radiography may reveal narrowing of the disk spaces.
Computed tomography
CT provides superior details of the osseous structures and calcifications but has the disadvantage of higher cost and radiation exposure to patients. Multidetector CT (MDCT) technology provides isotropic resolution that facilitates reformation into any imaging planes, such as sagittal and coronal reconstructions commonly used to evaluate spinal alignment. The recent development of dual energy and multispectral CT allows the reduction of metal artifacts (3).
Magnetic resonance imaging
MRI provides excellent details of all the anatomical structures of the spine, including the bone, bone marrow, ligaments, and other soft tissues (Table 12.1). When patients present with radiculopathy, MRI is often the imaging modality of choice because it provides superior imaging details of the soft tissues in the spinal canal and neuroforamina, specifically the spinal cord and nerve roots.
Table 12.1 Summary of MR Imaging Techniques for Degenerative Spine Disease
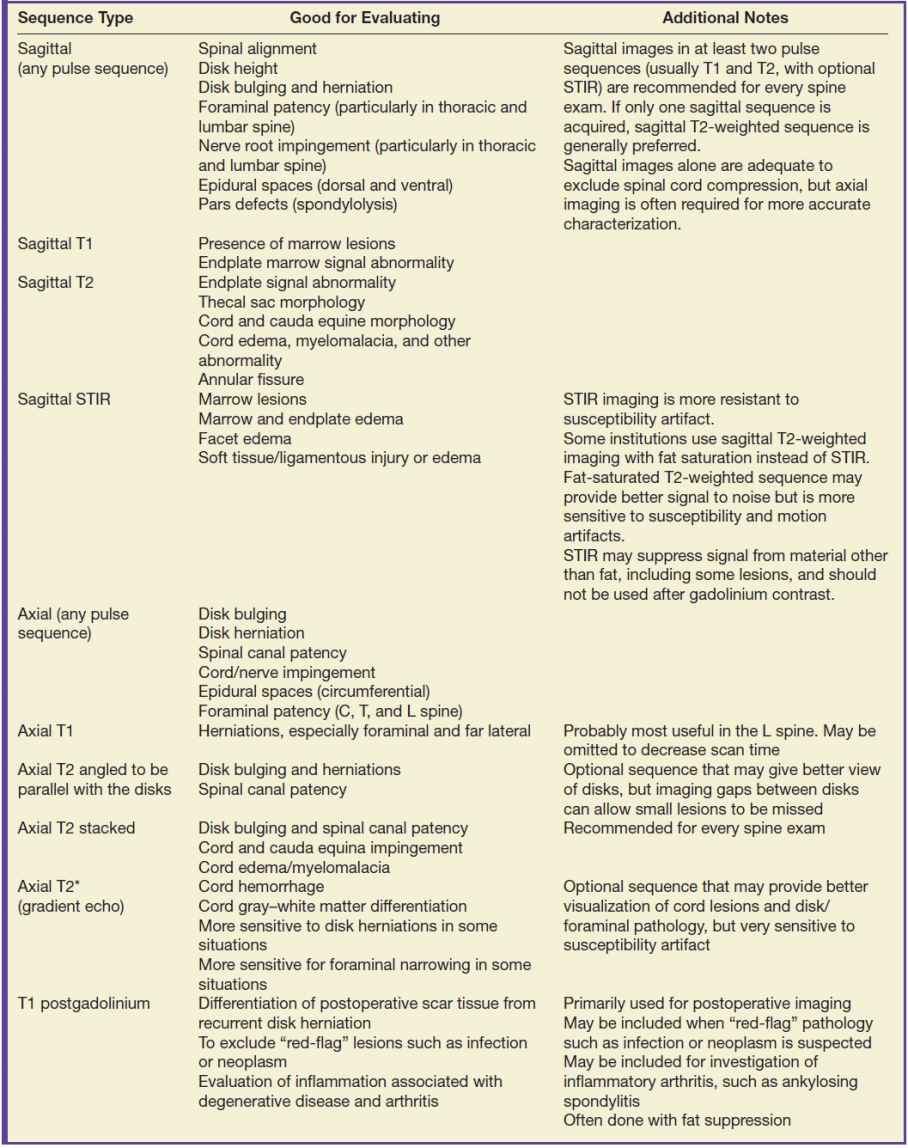
MRI has the advantage of generating images in different soft tissue contrast, by exploiting the different intrinsic MR properties of biologic tissues called T1 and T2 relaxation times. In a typical MR study, images are usually acquired in the sagittal and axial planes using T1- and T2-weighted fast spin-echo (FSE) imaging sequences. Axial images may be acquired sequentially in the same orientation (stack mode). Some radiologists prefer to image the lower lumbar spine and lumbosacral junction with the imaging plane angulated and parallel to the disk space (angled mode). The choice of stack mode versus angled mode has been controversial and a subject of individual preference (4). Axial sections angled parallel to individual disks may provide more accurate evaluation of disk bulging and herniation. However, with angled axial images, there are skipped areas of coverage between the disks, potentially increasing the risk of missing pathologies located within the skipped areas. This scenario may occur in migrated disk fragments and spondylolysis. These findings may be easier to demonstrate on nonangled contiguous axial image acquisition.
To avoid the bright fat signal that can sometimes obscure important imaging findings, a fat-suppressed inversion recovery sequence (STIR) or fat-suppressed FSE sequence may be added. These fat-suppressed sequences are very sensitive for the evaluation of diseases involving the marrow space of the vertebral bodies and the paraspinal soft tissues. They are very sensitive for inflammation related to degenerative spine disease.
A 3D image acquisition can provide higher spatial resolution and allows reformat into any other additional imaging planes (5–7). These imaging sequences may offer an advantage in the evaluation of degenerative spine disease in the cervical and thoracic spine due to the smaller structures in this part of the spine and the oblique orientation of the neuroforamina of the cervical spine.
Gradient-echo sequences, in 2D or 3D, can provide stronger contrast between intervertebral disk, cerebrospinal fluid, and osteophytes (5). However, gradient-echo techniques are sensitive to magnetic susceptibility, leading to artifactual signal loss around bony structures that can exaggerate the severity of disease. The presence of postsurgical hardware also precludes the use of gradient-echo sequences.
Intravenous contrast material is generally not necessary for routine imaging of the nonoperated degenerative spine but can improve the detection of inflammation such as facet joint synovitis and the presence of granulation tissues. In postoperative spine imaging, intravenous contrast can aid in the differentiation of granulation tissues from recurrent disk herniation.
The common MR imaging techniques for degenerative spine disease are summarized in Table 12.1. MR imaging protocol is often individualized based on preferences and clinical indications.
Myelography
The use of myelography is usually limited to patients with contraindications to MRI, such as patients with cardiac pacers, patients with orthopedic hardware resulting in severe MR image artifacts, or patients with extremely large body habitus. Myelography requires the intrathecal injection of iodinated contrast either through lumbar puncture or infrequently through cervical puncture at the C1 to C2 level. Plain film myelography is usually performed as a prelude to postmyelographic CT, which provides much better details than does conventional myelography.
Discography
Discography involves the injection of iodinated contrast agent directly into the intervertebral nucleus pulposus. It includes two parts: a pain provocation challenge and imaging. For the pain provocation challenge, a volume of contrast material is injected into the disk. If pain is reproduced similar to the patient’s complaint, then this portion of the discogram is considered positive. Imaging, initially with radiography and with the option of further evaluation with CT, may help to evaluate tears of the nucleus pulposus and annulus fibrosis. The true value of discography in the diagnosis and treatment of back pain has been controversial (8). However, it may be useful in evaluating discogenic causes of back pain, perhaps when morphologic abnormalities, such as disk herniation, are not obvious on other forms of imaging, such as MR or CT. The injection of discography may reproduce or provoke the patient’s pain and therefore help to localize the source of back pain that is not apparent on other less invasive studies (2).
Image Interpretation of Degenerative Spine Disease
Degenerative disease of the spine most commonly involves the lumbar spine, followed by the cervical spine. Manifestations of degenerative spine disease include intervertebral disk degeneration, disruption of the annulus fibrosis, herniation of the nucleus pulposus, vertebral endplate changes, osteophyte formations, facet arthropathy, formation of juxta-articular cysts, degenerative spondylolisthesis, and spinal stenosis.
Review of an imaging study for degenerative spine disease generally includes identification of the normal number of vertebral levels and any anomalies such as transitional vertebra (Fig. 12.3) (9). For patients with anomalous number of vertebral levels, it is important to label vertebral levels consistently and unambiguously in different examinations of a patient. Inconsistent labeling in patients with anomalous number of vertebral bodies can potentially lead to surgery at the wrong level. In challenging cases with anomalous vertebrae, counting starting with the top of the cervical spine to the sacrum may help to accurately label the vertebrae. Premature degenerative changes may be precipitated by vertebral anomalies and should be recognized. On cross-sectional imaging, the sagittal images provide a quick overview of the alignment and degenerative changes of the spine. The degenerative changes can then be further characterized by correlation with additional imaging planes, usually axial images.
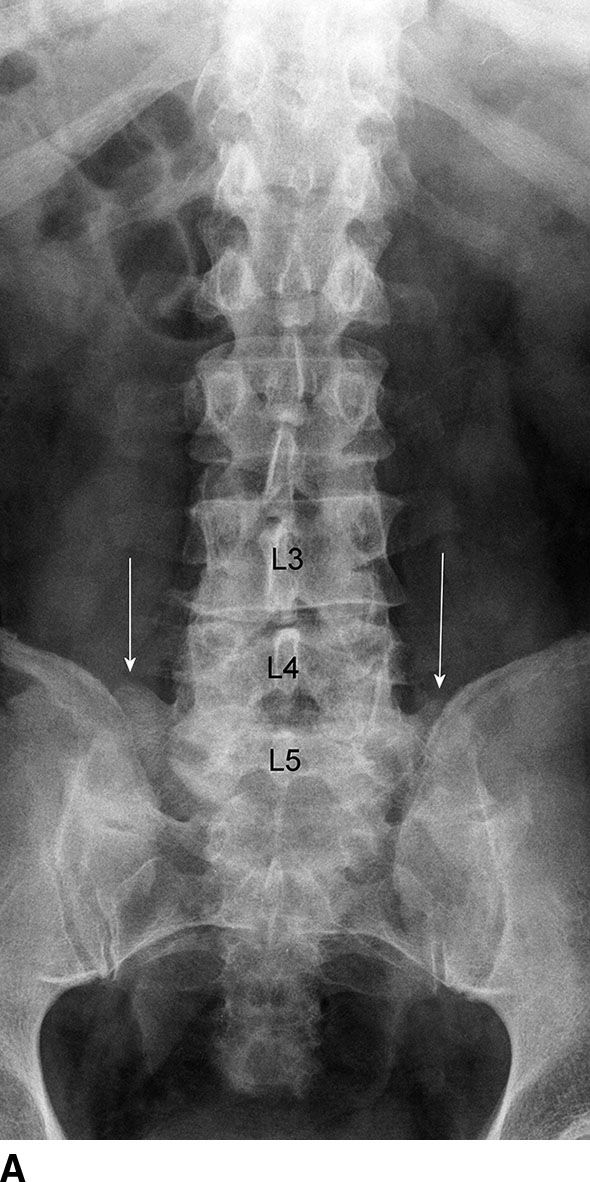
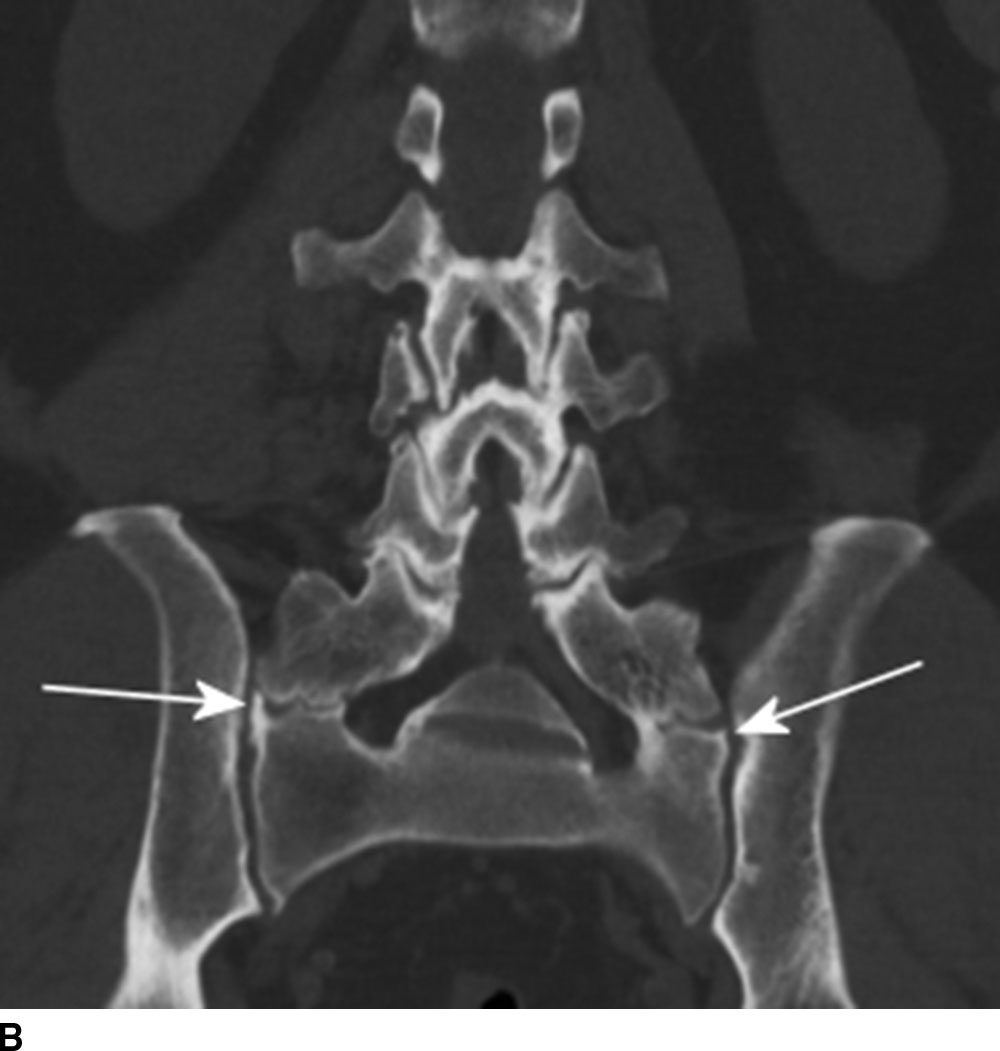
FIG. 12.3 Transitional L5 vertebra. A: Radiography, AP view. The T12 ribs are relatively small. L5 vertebra demonstrates enlarged transverse processes (arrows) that form pseudoarticulation with the sacrum. The pseudoarthrosis can result in accelerated development of degenerative disease and back pain. B: CT coronal reformation. The pseudoarticulation (arrows) formed by enlarged transverse processes of L5 and sacrum is well demonstrated. Variation of L5 sacralization may include complete osseous fusion of the L5 transverse process and sacrum.
Intervertebral disk degeneration and herniation
On radiography (Fig. 12.4), intervertebral disk degeneration is indirectly inferred from loss of the normal disk height. Gas may be seen in the disk space, due to a negative pressure within the degenerative disk causing extraction of nitrogen from the extracellular space. This is commonly termed vacuum phenomenon. The vacuum phenomenon can be accentuated during extension of the spine and reduced during flexion. Vertebral endplate irregularity is often seen, with or without associated sclerotic changes at the endplates.
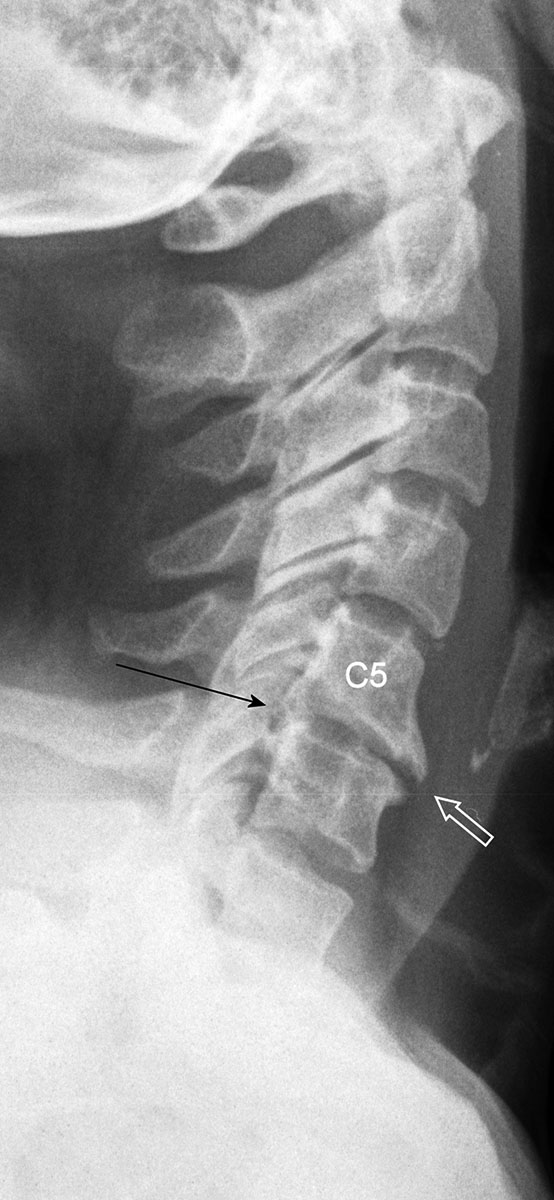
FIG. 12.4 A 46-year-old female with neck pain. Radiograph of the cervical spine in lateral projection demonstrates degenerative change at the C5-C6 level with disk space narrowing, anterior (white arrow) and posterior osteophytes (black arrow). Compare the findings at the C5-C6 level with the normal findings of other levels.
Similar to radiography, CT can demonstrate disk space loss, endplate irregularity or sclerotic changes, and vacuum phenomenon (Fig. 12.5). However, CT also allows direct visualization of disk bulging and disk herniation (Fig. 12.6), although with a lesser soft tissue contrast compared to MRI. CT has the capability of detecting calcification associated with disk herniation and differentiating osteophyte from disk herniation (Fig. 12.7). In difficult cases, more accurate depiction of disk bulging and disk herniation may be obtained from CT myelography. CT myelography is usually reserved for patients who have contraindications for MRI.
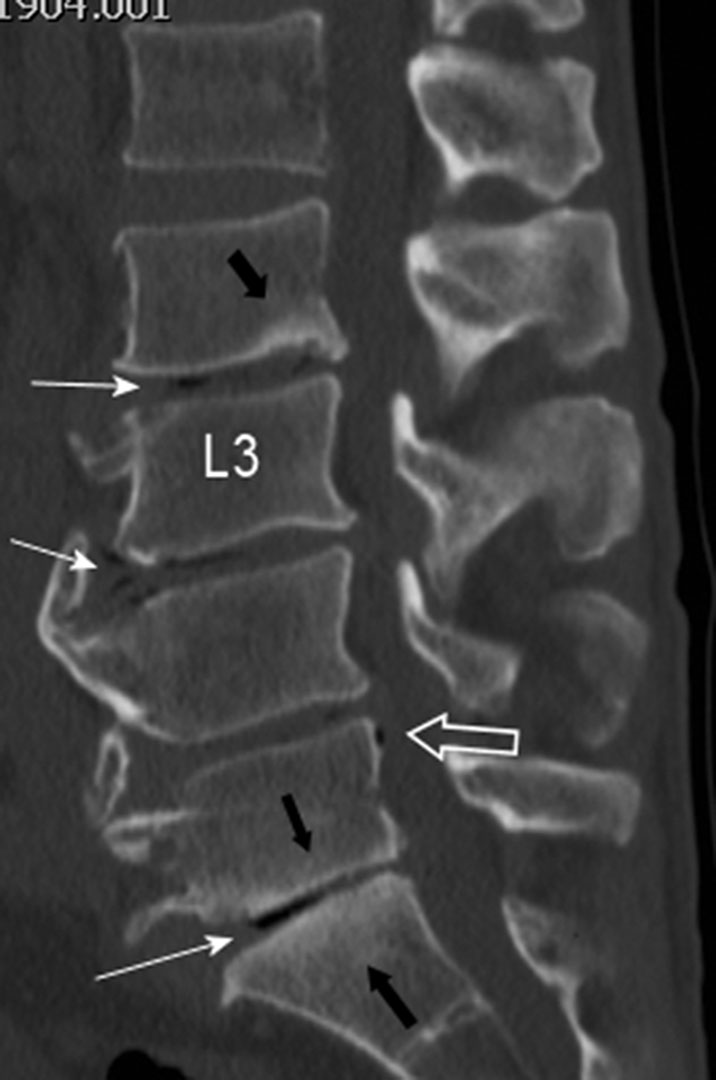
FIG. 12.5 A 49-year-old male with back pain. There is narrowing of the L2-L3 to L5-S1 disk spaces, which contain pockets of air related to vacuum phenomenon (solid white arrows). It is not uncommon to see air extending outside the disk space. In this case, there is subligamentous air posterior to the L5 vertebra (open white arrow). There is sclerosis of the inferior endplates of L2 and L5 and superior endplate of S1 (black arrows). Spinal canal stenosis of the L2-L3 to L4-L5 levels is present. These findings may be seen on radiographs but are better demonstrated on CT.
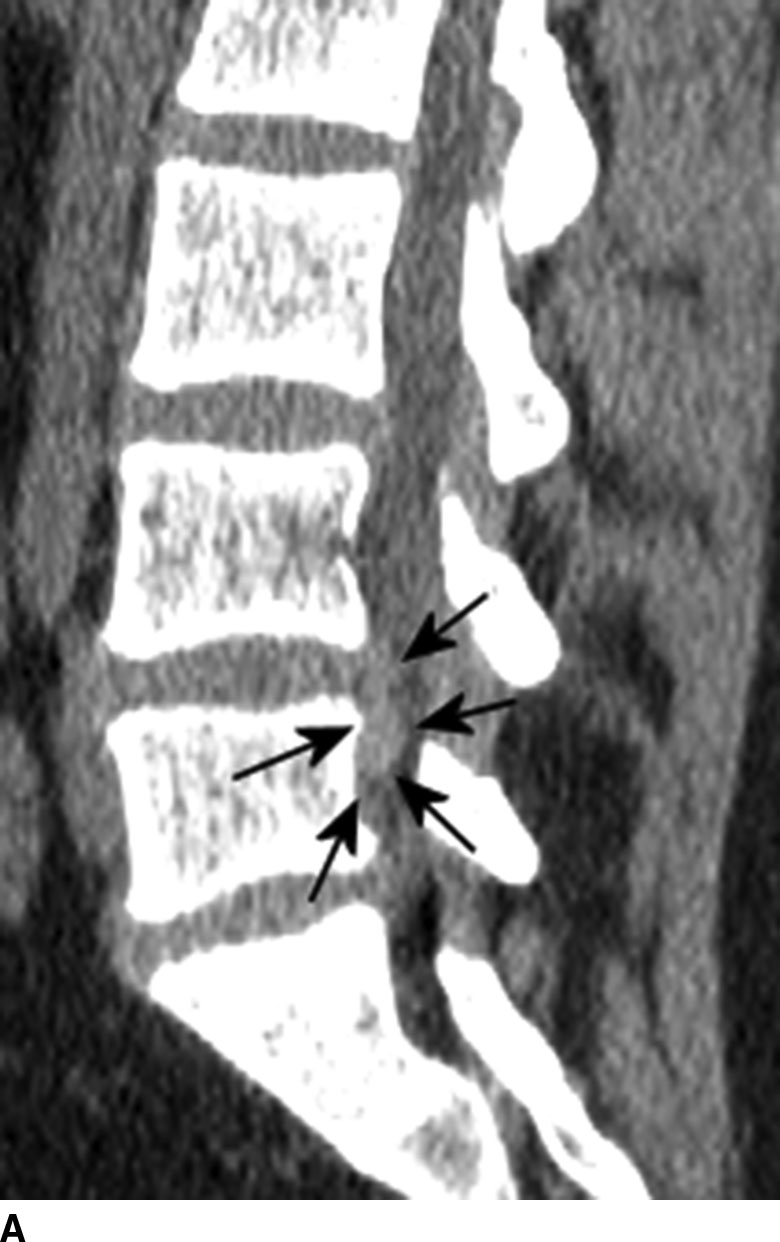
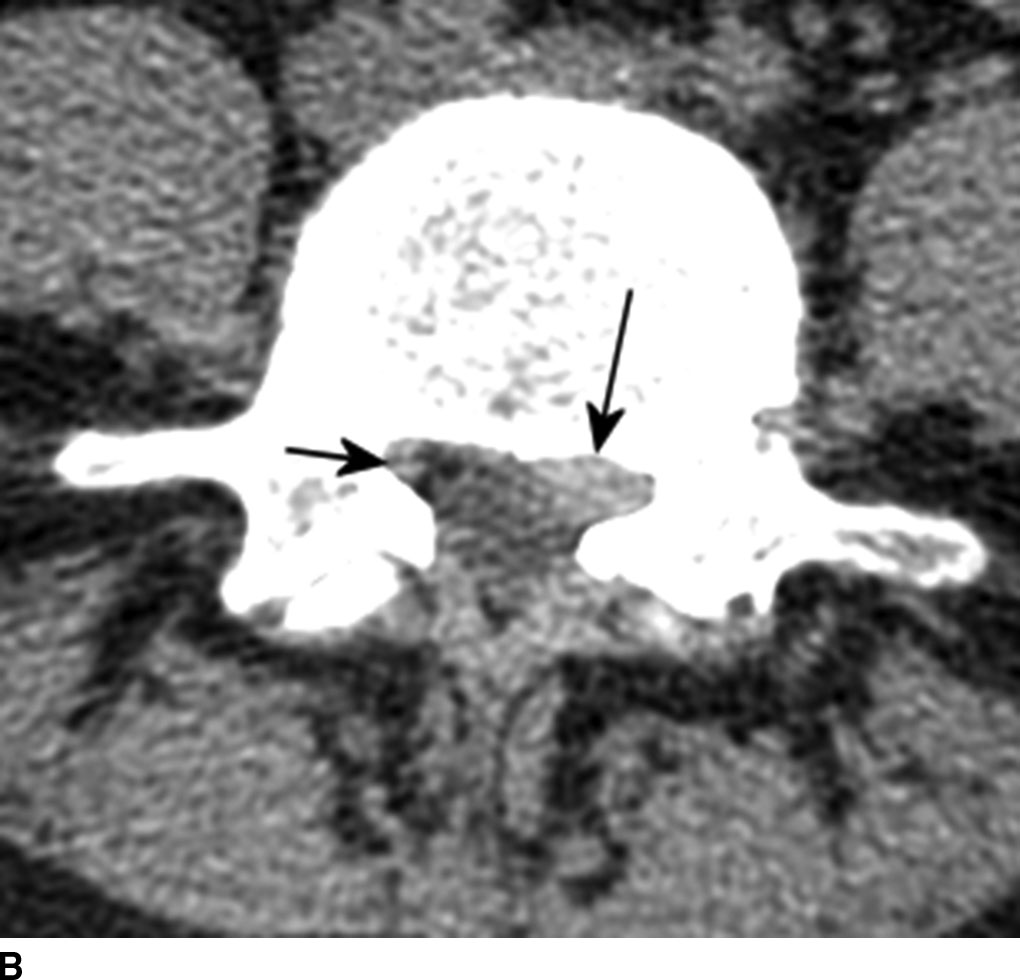
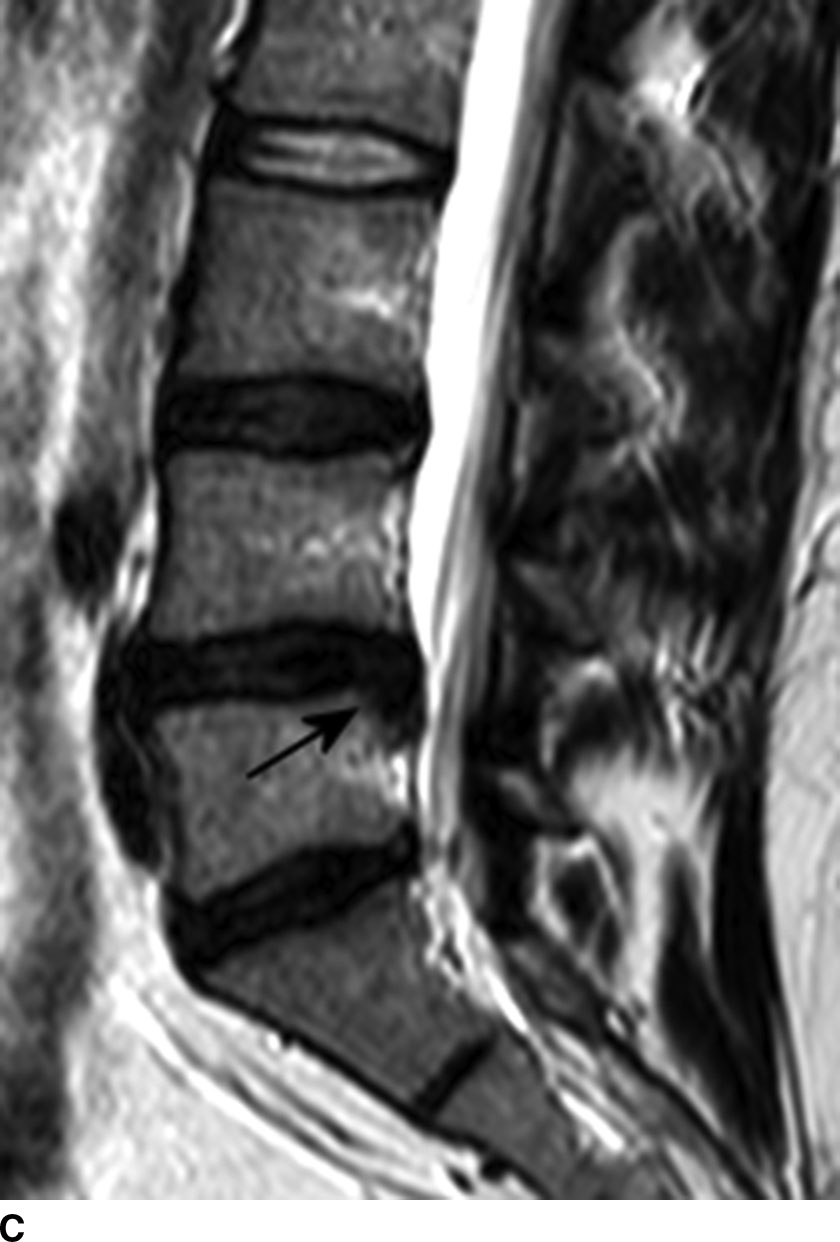
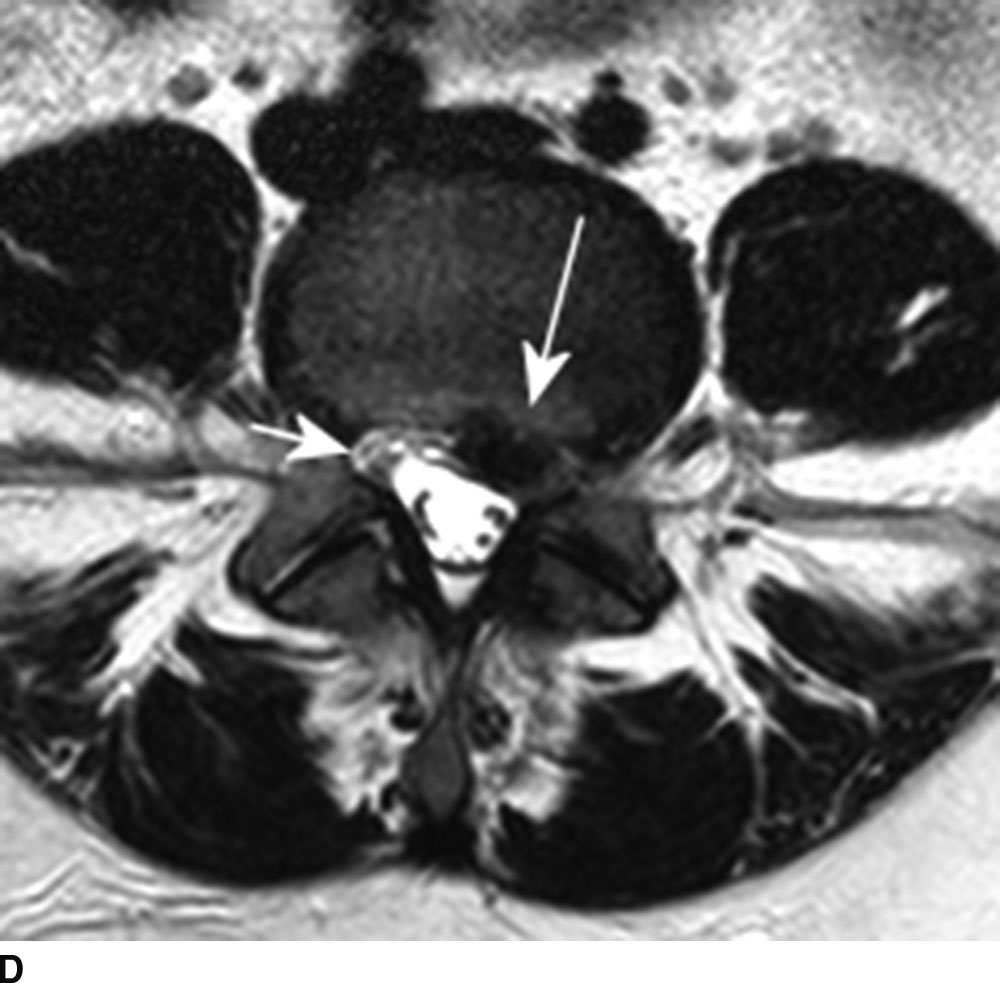
FIG. 12.6 A 30-year-old female with back pain and radiculopathy. Left central disk extrusion on CT with MRI correlation. The disk extrusion can be seen on CT. A: Sagittal reformatted CT image demonstrates the disk extrusion at the L4-L5 level, with inferior migration of the herniated disk (arrows). B: Axial CT. The extruded disk (long arrow) causes effacement of the left lateral recess. Displacement and impingement of the left L5 nerve can be inferred from the mass effect of the disk extrusion. Note the normal appearance of the right L5 nerve at right lateral recess (short arrow). Sagittal (C) and axial (D) T2-weighted images demonstrate similar findings. (Findings are similarly annotated as in images (A) and (B)). Although MR provides superior soft tissue details, the same key diagnostic information is demonstrated on CT. Compare the normal L2-L3 disk with the degenerative disks at L3-L4 to L5-S1 levels. The normal disk demonstrates T2 hyperintensity and confinement of disk material within the vertebral margin. In degenerative disks, there is loss of the T2 hyperintensity and extension of disk material beyond the vertebral margin.
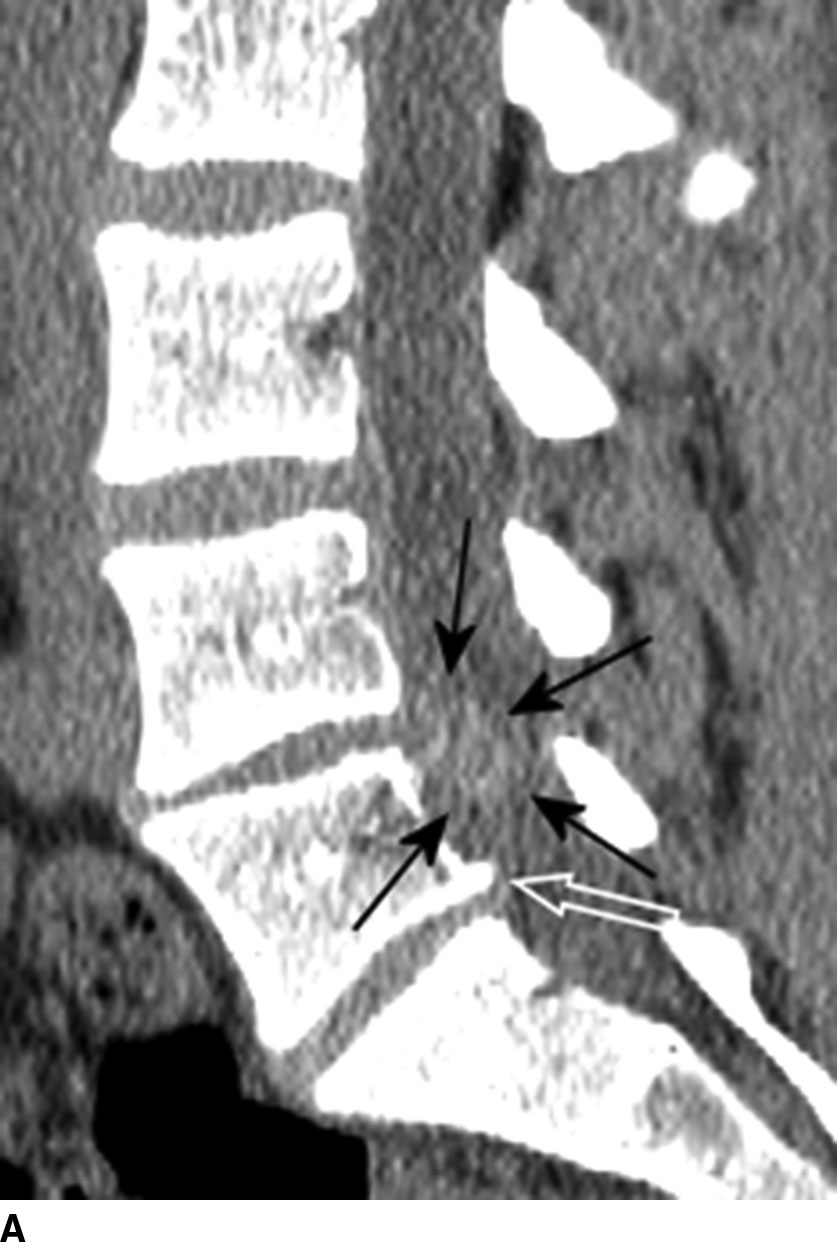
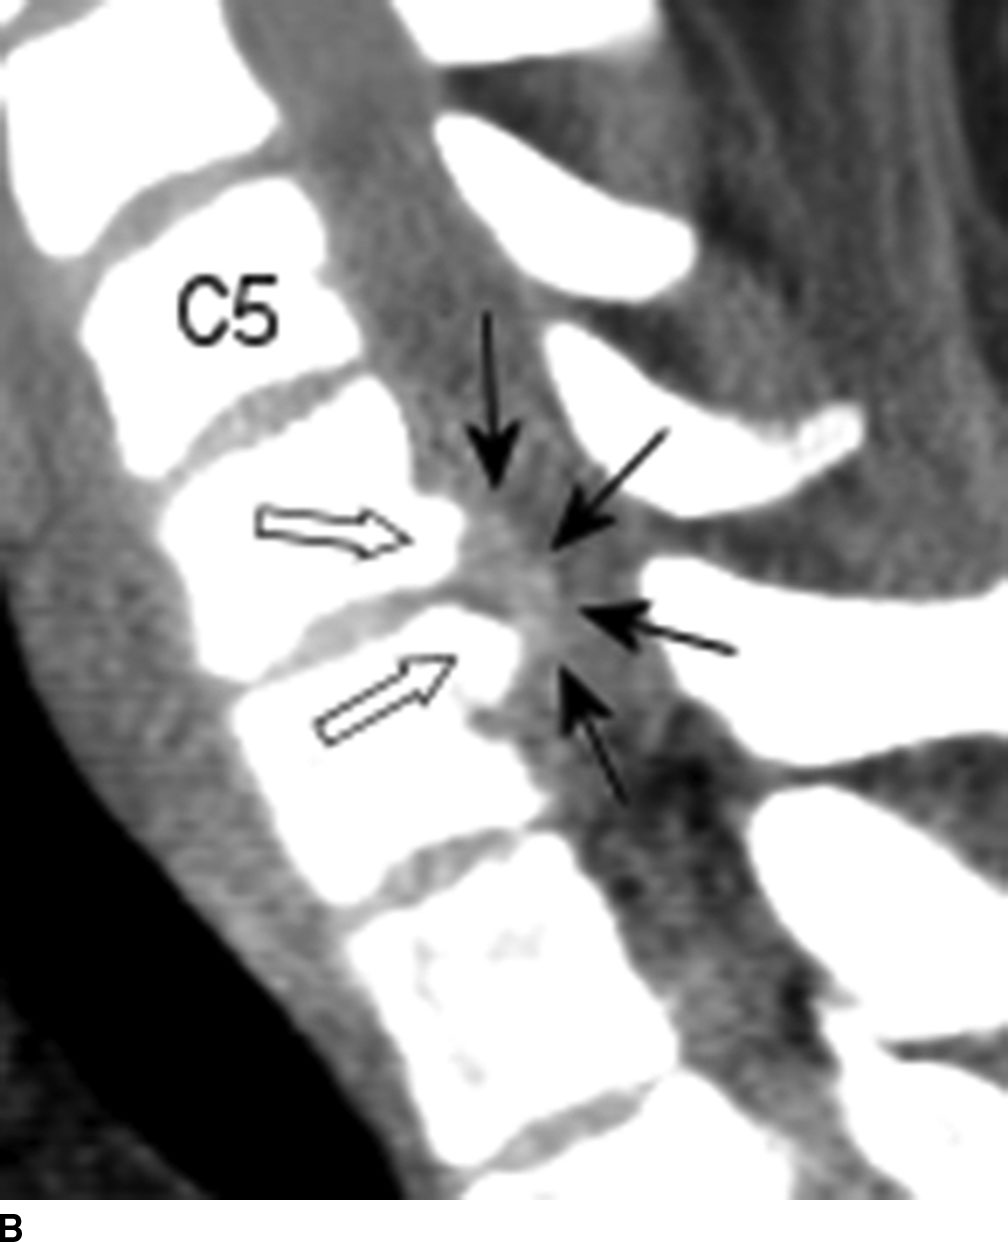
FIG. 12.7 CT sagittal reformation in two different patients. A: Disk space narrowing at the L4 to L5 level of lumbar spine and a large disk extrusion (black arrows). Subtle calcification with associated hyperdensity of the extruded disk is well seen on CT and will not be appreciated on MRI. Note also disk bulging at the L3-L4 and L5-S1 levels and mild posterior osteophyte at the L5-S1 level. B: Disk osteophyte complex at the C6-C7 level. In both (A) and (B), the osteophytes (white arrows) are well differentiated from the disk herniation (black arrows), which can be difficult on MRI.
MRI provides the best soft tissue details in the evaluation of degenerative disk disease. In young healthy patients, the intervertebral disks demonstrate hyperintensity on T2-weighted images (Fig. 12.6C). With degenerative change, there is loss of the hyperintensity due to a decrease of water content and changes in proteoglycan composition. There is decreased disk height, and the endplates may become irregular. Gas from vacuum phenomenon may fill the space of a degenerative disk, which may demonstrate hypointensity on both T1- and T2-weighted images. Alternatively, the space may be filled with fluid, which is seen as hyperintensity on T2-weighted images. Calcification of the degenerative disk may lead to hypointensity or hyperintensity on T1-weighted images depending on the type and concentration of calcification. A degenerative disk may also enhance secondary to the presence of granulation tissues. In some clinical situations, it may be difficult to differentiate T2 hyperintensity and enhancement of degenerative disk from early discitis.
Fissures of the annular fibrosis may be seen in the intervertebral disks. Annular fissures (also referred as annular disruption) are separations between annular fibers, avulsion of fibers from their vertebral attachments, or breakthrough fibers. In older literature, the term “annular tear” is often used synonymously. Because an annular fissure is not necessarily posttraumatic, the use of this term is discouraged in the new literature. On MRI, an annular fissure may be seen as a small high-intensity zone within the outer annulus (Fig. 12.8).
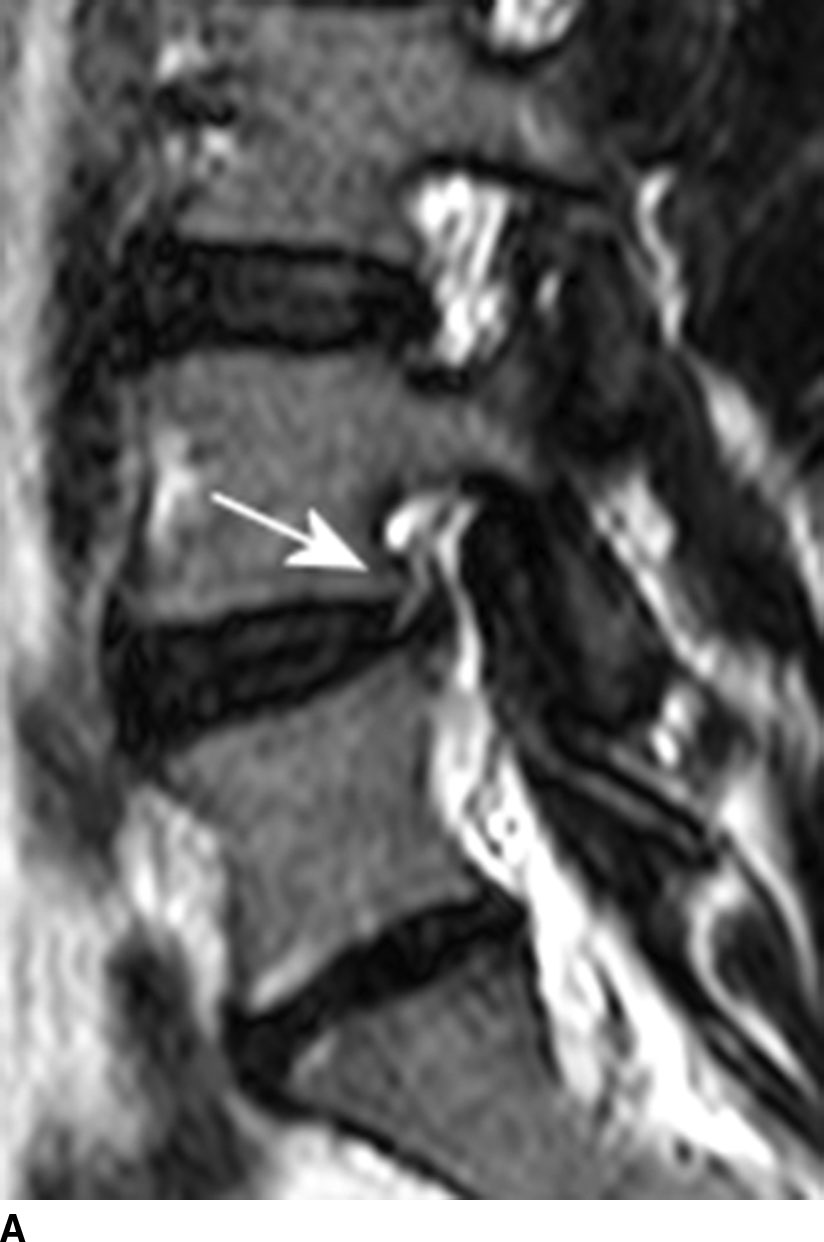
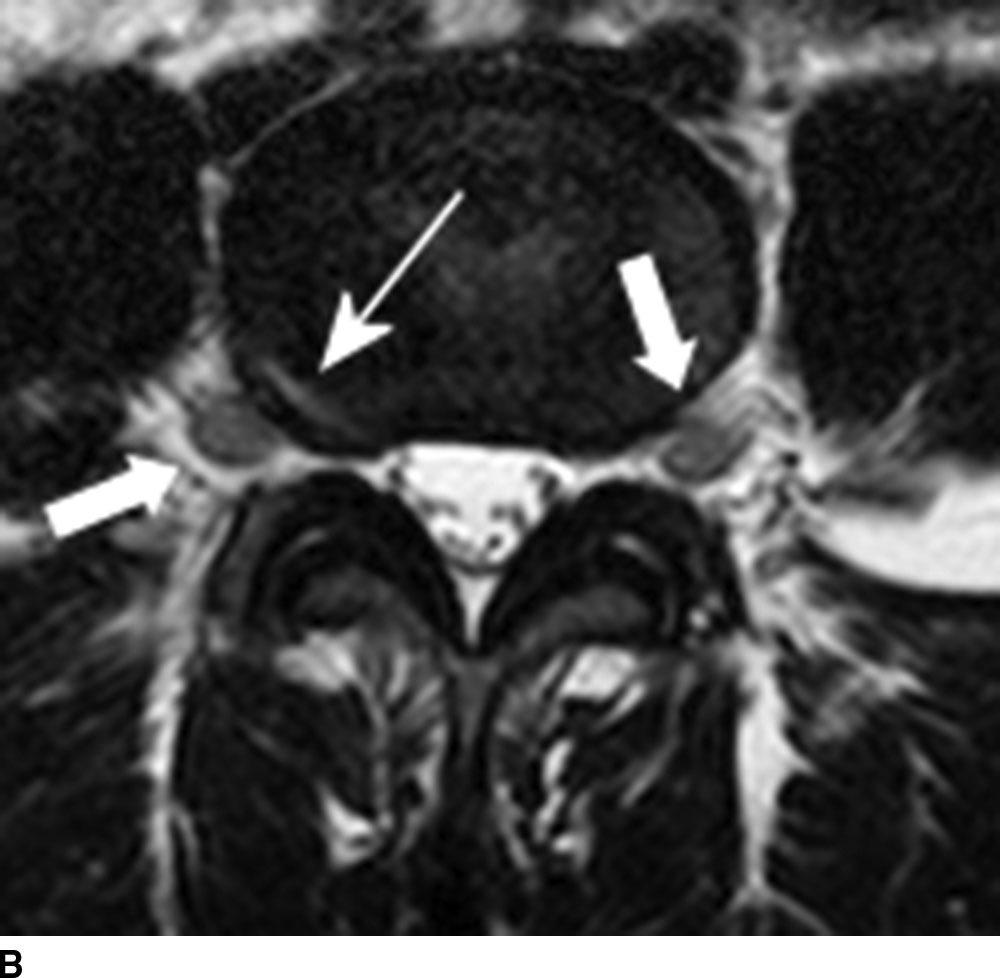
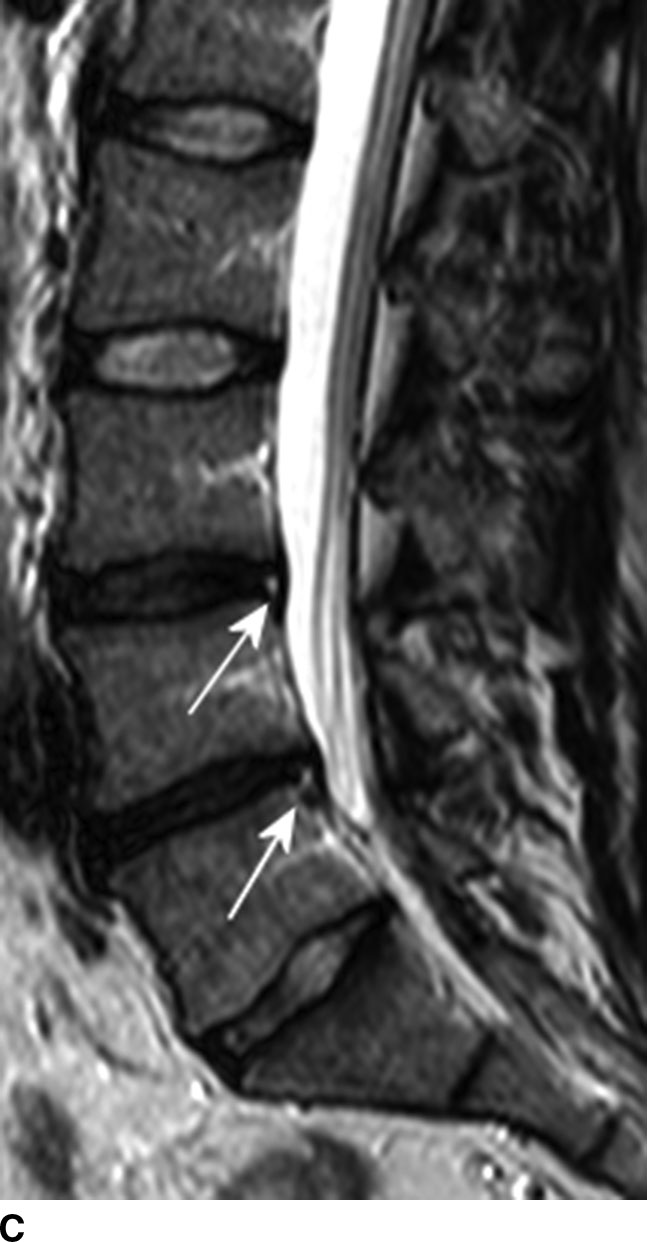
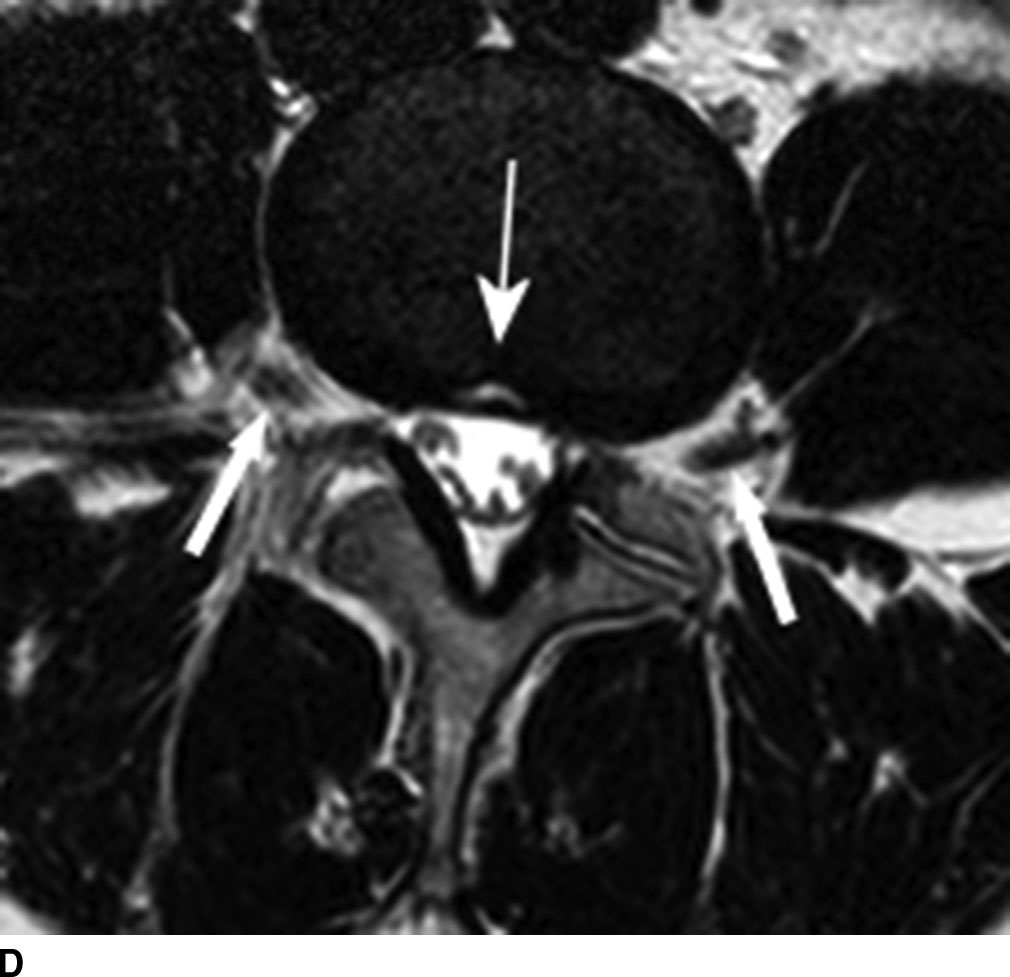
FIG. 12.8 Annular fissure (thin arrows in all parts) at L4-L5 disk seen as a high-intensity zone on T2-weighted image. A: Sagittal. Note the loss of normal T2 hyperintensity due to disk degeneration. B: Axial. Thick arrows = L4 nerves as they exit the L4-L5 neuroforamina. C: Sagittal T2-weighted image of a different patient demonstrates annular fissures at L3-L4 and L4-L5 levels. There is narrowing and T2 hypointensity of the disks, indicating disk degeneration. D: Axial T2-weighted image of same patient at L3-L4 level. Block arrows = L3 nerves as they exit the L3-L4 neuroforamina.
One of the primary advantages of MRI is the direct visualization of disk bulging or herniation and its associated mass effect on the nervous structures. At a particular disk level, a disk can have bulging and one or more areas of herniation seen at the same time. In 2001, the Combined Task Forces of the North American Spine Society, American Society of Spine Radiology, and American Society of Neuroradiology reached a consensus regarding the standardization of the nomenclature and classification of disk pathology (10). This publication was subsequently endorsed by the American Academy of Orthopedic Surgery, the American Academy of Physical Medicine and Rehabilitation, the American College of Radiology, the American Association of Neurological Surgeons, the Congress of Neurological Surgeons, the European Society of Neuroradiology, and the Physiatric Association of Spine, Sports, and Occupational Rehabilitation. The nomenclature and classification have been recently updated (11). The consensus was initially developed for lumbar spine disk disease, but much can be generalized to disk disease in the rest of the spine. A normal disk space is defined craniocaudally by the vertebral body endplates and circumferentially by the ring apophysis of the vertebral bodies. In the newly revised consensus, a disk bulge refers to diffuse displacement of disk material beyond the normal disk space and covers greater than 25% of the normal disk space circumference (i.e., greater than 90 degrees of the circumference) (Fig. 12.9A). Disk displacement covering 25% or less of the circumference is called herniation. When the width of the base of the disk herniation is greater than any other measurements in the same plane of the herniation, it is called a protrusion (Fig. 12.9B). When any of the measurements of the herniation is greater than the width at its base, the herniation is described as an extrusion (Fig. 12.9C,D). Migration refers to herniated disk material that is displaced above or below the level of the disk. When the disk extrusion is separated from the parent disk, it is referred to as a sequestration. An acute sequestered disk may demonstrate T2 hyperintensity compared to its disk of origin. This may be secondary to the presence of granulation tissue, immune response, and/or inflammation (12). Most disk sequestrations are seen in the epidural space, but rarely, they may migrate into the intradural space, posterior to the thecal sac, or extend into a neuroforamen (Fig. 12.10). Herniated disk may be contained by the annulus fibrosis (subannular) or the posterior longitudinal ligament (subligamentous), although the distinction sometimes can be difficult.
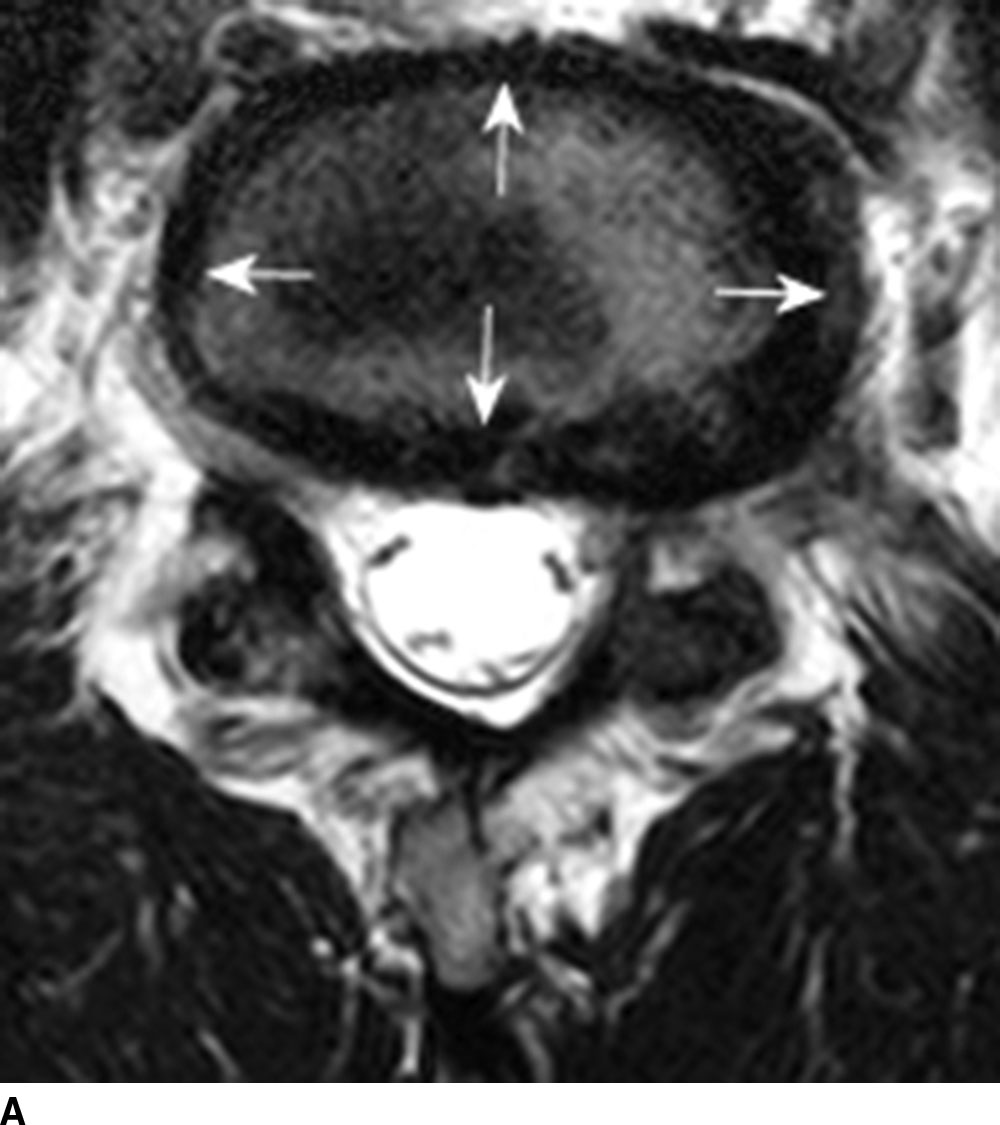
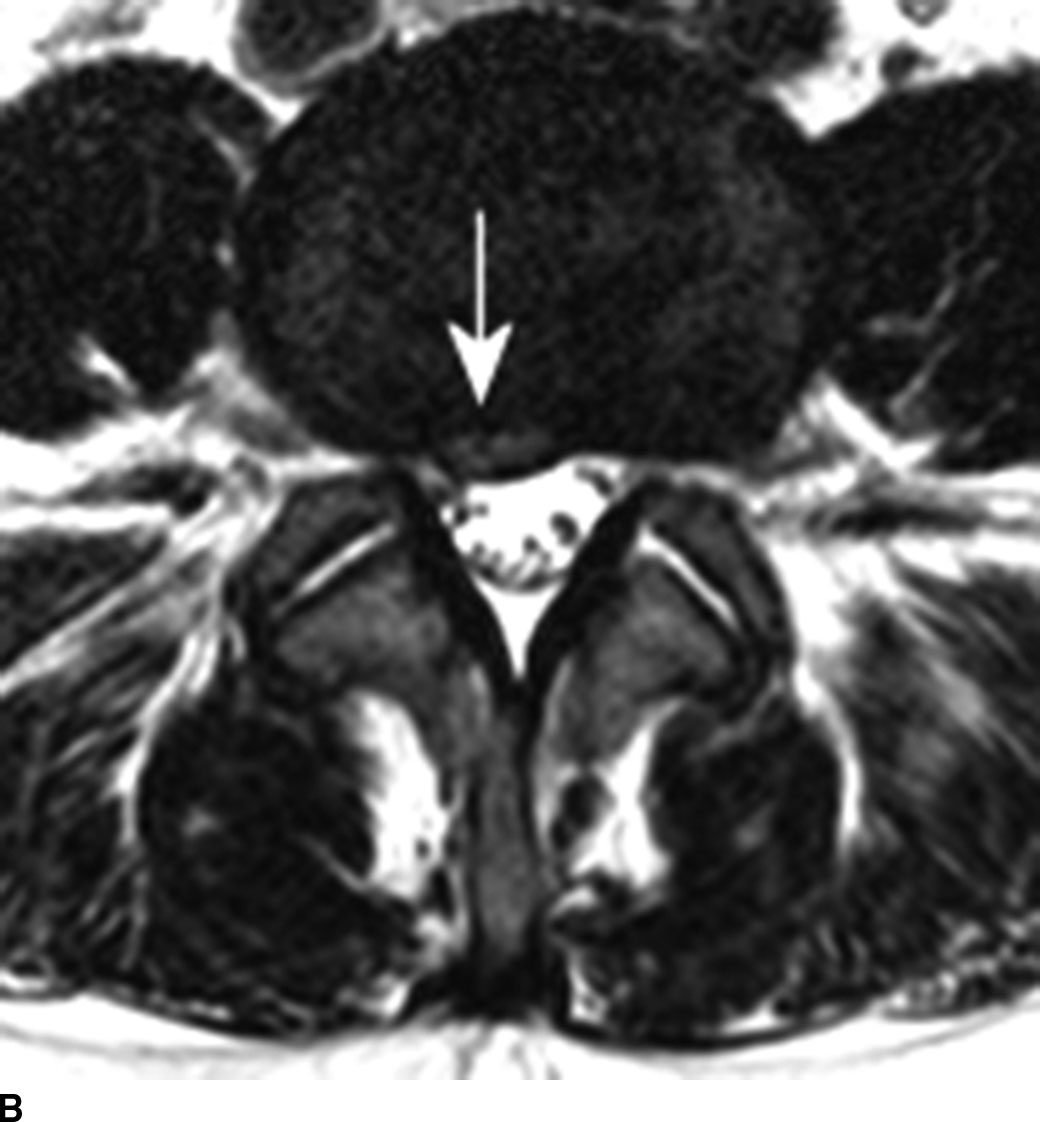
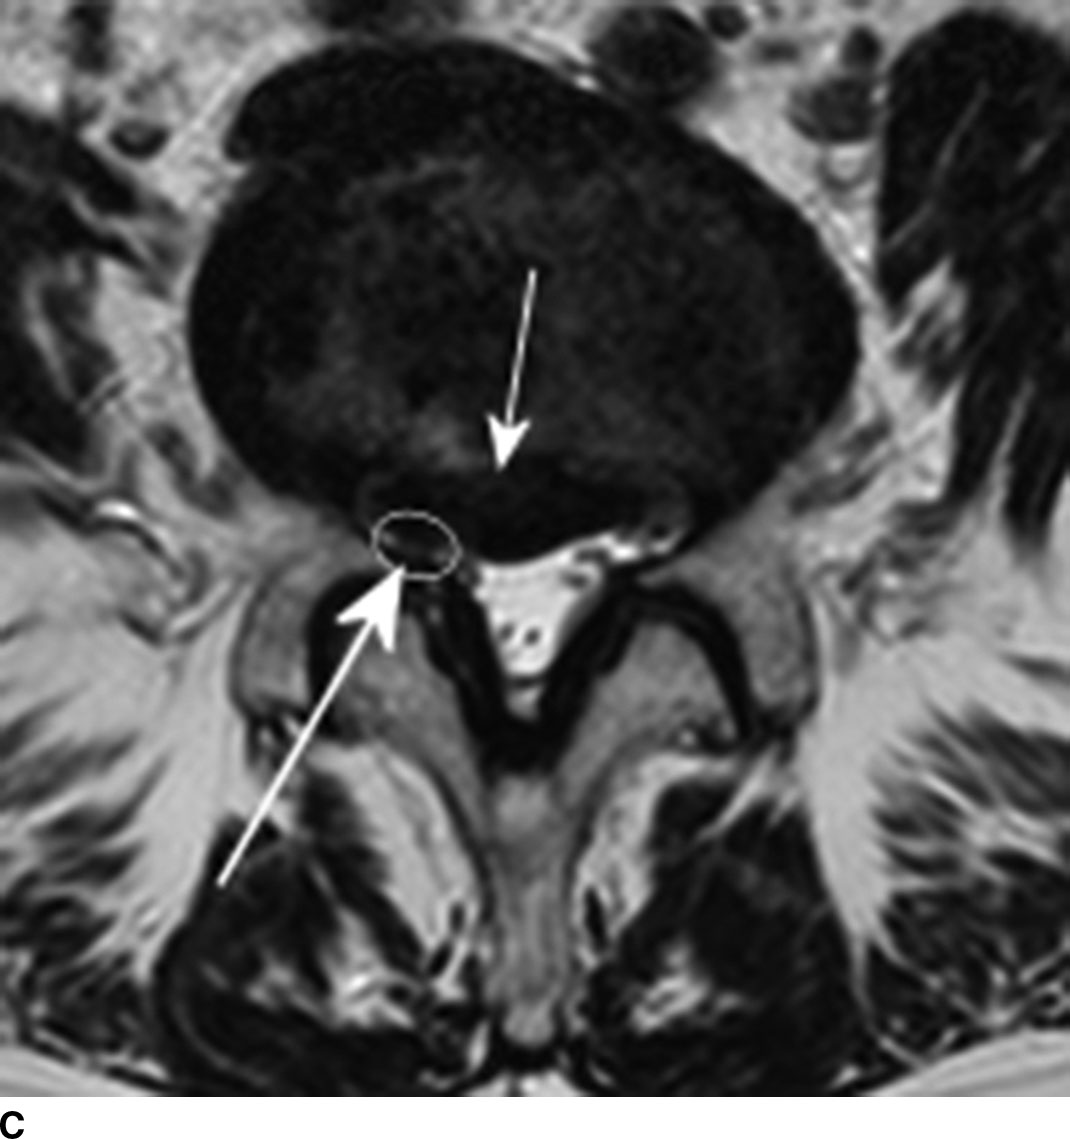
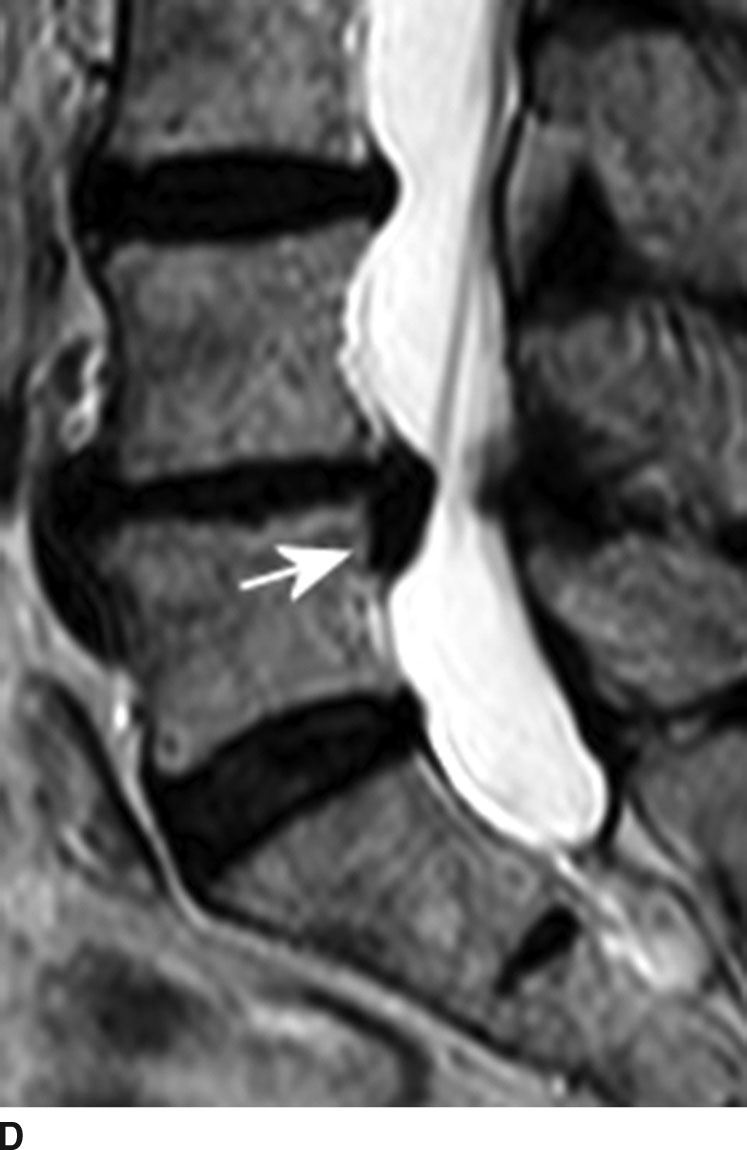
FIG. 12.9 Disk bulging and herniation. A: Axial T2-weighted image demonstrates a diffuse disk bulging. The disk extends beyond the margin of the ring apophysis circumferentially (arrows). B: Axial T2-weighted images demonstrate a disk protrusion. The width of the base (arrow) is larger than any other dimensions of the disk herniation. Degenerative facet hypertrophy is also noted. C,D: Axial and sagittal T2-weighted images reveal a disk extrusion (same patient). One may initially consider this as disk protrusion based solely on the axial image (short arrow in C). However, the sagittal image demonstrates herniated disk material that extends inferiorly below the disk level (arrow in D). The base of the disk herniation is narrow compared to the largest dimension of the disk herniation. This is therefore a disk extrusion at L4-L5 level with inferior migration. When classifying disk herniation, it is important to review all available imaging planes. Note that the disk herniation results in narrowing of the right lateral recess (long arrow in C) and impingement of the right L5 nerve (circle).
Related posts:
Stay updated, free articles. Join our Telegram channel

Full access? Get Clinical Tree


