Fig. 3.1
(a) A short echo time (TE 31 ms) PRESS spectrum recorded from the anterior cingulate gyrus of a normal adult human brain at 3 T. Peak assignments are as follows: NAA—N-acetylaspartate, Cho—choline-containing compounds, Cr—creatine, mI—myo-inositol, Glu—glutamate, Glx—glutamate and glutamine, Lip—Lipid. (b) LCModel analysis of the spectrum shown in (a)—the red line is the result of the fitting algorithm, the lower black line the fitted baseline, and the upper black line is the difference between the fit and experimental data
Other prominent peaks in the spectrum of Fig. 3.1 include “choline” (Cho—actually a composite peak consisting of several different Cho-containing compounds, in particular glycerophosphocholine (GPC) and phosphocholine (PC)) at 3.2 ppm, and “creatine” (actually the combination of both creatine and phosphocreatine (PCr)) at 3.0 ppm on the chemical shift scale. The Cho signal is often found to be increased in brain tumors, particularly those which are non-necrotic and of high grade. The increase in Cho is believed to be related to a number of factors, including increased tumor cell density, increased membrane turnover, and altered Cho metabolism, in particular increased synthesis of PC in tumor cells [4, 5]. The combined increase in Cho and decrease in NAA thus leads to a decreased ratio of NAA/Cho in nearly all brain tumors, although this pattern is not particularly specific, since many other neuropathologies may also have reduced NAA/Cho [3]. Other metabolic alterations in brain tumors that may be detected by in vivo MRS include increases in myo-inositol (mI) which resonates at about 3.5 ppm, a cyclic sugar alcohol that has been proposed as a glial cell marker [6], particularly in low-grade gliomas [7]; increases in alanine (~1.5 ppm) in meningiomas [8]; and increases or decreases in creatine. Since abnormal glycolysis and/or hypoxia and necrosis are also commonly associated with brain tumors, it is also not uncommon to observe increases in lactate (1.3 ppm) in some cases [9]. Tumor necrosis is also associated with increases in mobile lipid signals that can be detected by MRS [10] at various frequencies in the spectrum, but most notably at 1.3 and 0.9 ppm. Examples of the different spectral patterns from human brain tumors are shown in Fig. 3.2.
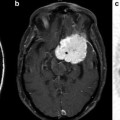
Fig. 3.2
Representative brain tumor spectra and spectroscopic images (1.5 T, TE 280 ms) from three different human brain tumors: (a) a glioblastoma multiforme (GBM) involving the splenium of the corpus callosum, showing high Cho and low NAA compared to the contralateral hemisphere, (b) a left frontal grade II oligodendroglioma, which has decreased NAA and near-normal Cho, and (c) a left parietal primary central nervous system (CNS) lymphoma which has an elevated Cho signal and decreased NAA
Other compounds that may be detected by in vivo MRS include glutamate (Glu) and glutamine (Gln), often expressed as their sum “Glx” (i.e., Glu + Gln) since they are hard to separate, particularly at 1.5 T, although at higher field strengths (3 or 7 T) it is possible to measure the individual components with reasonable accuracy [11]. There is interest in the roles of Glu as a promotor of tumor cell growth and invasion of surrounding brain tissue [12], a cause of seizures related to tumors [13], and also as a possible therapeutic target [14]. Gln is believed to be an important source of nitrogen for tumor growth, and is involved in tumor cell signaling pathways [15, 16]. However, to date there have been relatively few studies of these compounds in vivo in human brain tumors using MRS.
Although they are relatively rare observations, peaks from the TCA-cycle intermediates are occasionally observed in human brain tumors by MRS. Succinate, a singlet resonance at about 2.4 ppm, has been reported both in treatment-naive gliomas as well as post-radiation therapy [17], although the significance of this finding is currently unclear (Fig. 3.3). It has also been observed in some brain abscesses [18]. Also, citrate has been observed in certain pediatric brain tumors (a complex multiplet around 2.6 ppm), in particular low-grade astrocytomas that exhibit malignant progression [19].
Fig. 3.3
An untreated, left insular presumed low-grade glioma seen on T2-weighted MRI, which has an elevated signal at 2.4 ppm which is assigned to succinate (Succ), a tricarboxylic acid (TCA) cycle. The lesion also has a large reduction in NAA, and moderate increases in Cho and Lac (inverted doublet at ~1.3 ppm) compared to the contralateral hemisphere (which has slightly larger linewidths due to field inhomogeneity). There is also an incidental left parietal hemorrhage. Spectra recorded at 3.0 T using TR 2000 and TE 135 ms
Finally, recent work has also shown that it is possible to detect the compound 2-hydroxyglutarate (2HG) in grade 2 and grade 3 gliomas which exhibit mutations of isocitrate dehydrogenase (IDH) [20, 21]; this may be of importance since these tumors have been reported to be associated with longer survival times compared to the phenotype without such mutations.
Methodological Considerations
While many of the early MRS studies of brain tumors used single-voxel (SV) MRS (i.e., spectra typically recorded from a single, typically ~8 cm3 cube of tissue within the brain) [2, 22], it soon became apparent that spectral patterns in many cases varied from one part of the lesion to another, and for this reason tumors are best studied using methods (“multi-voxel” MRS, also known as “chemical shift imaging” (CSI) or MRSI) that map out the spatial distribution of these compounds throughout the lesion and surrounding areas. MRSI, primarily based on the Cho signal, is particularly essential for mapping out the distribution of the density of tumor cells within the lesion [3, 23–27], and distinguishing regions of active tumor, necrosis, and edema, all of which have different spectral patterns. MRSI therefore should be considered the preferred modality (vs. SV-MRS) for brain tumor imaging in most cases, although in some instances SV-MRS may be more practical, for instance, lesions in difficult locations for MRSI, such as pontine gliomas, skull base, or inferior frontal lobe lesions, or in non-compliant patients and/or when time is short.
SV-MRS is traditionally performed with pulse sequences known as “PRESS” or “STEAM,” which are robust [3], single-shot localization techniques that generally give excellent quality spectra (Fig. 3.4). PRESS usually has higher signal-to-noise ratios (SNR), while STEAM can be used to record spectra with very short echo times (TE), which improves the precision of measuring compounds with coupled spin systems such as Glu or mI. More recently, other sequences have been introduced for SV-MRS, including the “semi-LASER” (sLASER) sequence [28, 29] which is similar to PRESS, but uses high-bandwidth adiabatic refocusing pulses to achieve excellent slice profiles, even if transmit power is not optimally set, and the “SPECIAL” pulse sequence [30] which offers the SNR of PRESS while also allowing very short TEs to be used (like STEAM). A summary of the relative advantages and disadvantages of each sequence is given in Table 3.1. All of these sequences are used in combination with optimized, frequency-selective pre-pulses to saturate the brain water signal [31] [32], which, since brain water is approximately 50 M, is approximately three orders of magnitude larger than the metabolites to be observed, which are in the mM concentration range.
Fig. 3.4
Pulse sequences used for spatial localization in MRS: (a) STEAM, (b) PRESS, (c) SPECIAL, and (d) semi-LASER. All sequences utilize slice-selective pulses with gradients applied in three orthogonal directions; for clarity, only slice selection gradients are shown, without refocusing lobes or crusher gradients. In (c) two scans are subtracted with the adiabatic inversion pre-pulse “on” and “off,” respectively. In (d), each of the four 180° are frequency-swept, adiabatic pulses. Each has its own advantages and disadvantages which are listed in Table 3.1
Table 3.1
Comparison of single-voxel MRS localization sequences
Sequence | Advantages | Disadvantages |
|---|---|---|
STEAM | Short TE, low SAR, good slice profiles of 90° pulses | Lower SNR |
PRESS | Better SNR than STEAM | Longer minimum TE, higher SAR |
SPECIAL | Good SNR, short TE | Possible artifacts since localization depends on subtraction of two scans |
Semi-LASER | Good SNR, good slice profiles, adiabatic pulses are B1 insensitive | High SAR, longer minimum TE |
The concept of chemical shift imaging can be traced back to the original paper by Brown et al. [33] in 1982 which demonstrated that an array of spatially localized spectra could be reconstructed by the application of a pulse sequence with phase-encoding gradients applied in that direction prior to turning on the receiver (Fig. 3.5). Since that original paper, there has been a continuous development and refinement of MRSI methods for localization in multiple dimensions within the human brain, with increasing spatial coverage and resolution and decreasing scan times [3]. A commonly used technique in the clinic is 2D-PRESS-MRSI [34], which combines excitation of a fairly large region of the brain using the PRESS sequence (but avoiding regions of the scalp with large lipid signals) with phase-encoding in two dimensions to map out the distribution of metabolites within the PRESS voxel. An example of PRESS-MRSI is shown in Fig. 3.6. 3D-PRESS-MRSI [35] has also been used in the study of brain tumors, which importantly allows localization to be extended to three dimensions; however this technique becomes very time-consuming if high spatial resolution and coverage are required. Other problems with PRESS-based MRSI include difficulties in covering to the edges of the brain, as well as left–right and anterior–posterior differences in spectra towards the edges of the PRESS voxel, due to the finite bandwidth of the slice-selective radio-frequency (RF) pulses.
Fig. 3.5
MRSI pulse sequence based on the PRESS pulse sequence. In this case the PRESS sequence excites a relatively large volume of brain tissue, which is then sub-divided into smaller regions by the application of phase-encoding gradients in one, two, or three dimensions
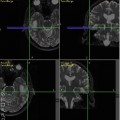
Fig. 3.6
Example of 2D-PRESS-MRSI (1.5 T, TR 2000, TE 280 ms) in the coronal plane in a patient with a lesion of the left hippocampus seen on T2-weighted MRI. The lesion is characterized by increased choline, creatine, and lactate and decreased NAA compared to the normal contralateral left hippocampus, as seen in both the selected hippocampal spectra and reconstructed Cho and NAA images, consistent with either a glioma or viral encephalitis
For these reasons, there continues to be development of other approaches to MRSI, including the use of slice- or slab-selective excitation (to reach the edges of the brain) as well as multi-slice [36] or 3D encoding to increase coverage, even up to whole brain [37]. Since extended coverage also implies long scan times, methods have been developed to reduce MRSI scan times, for instance using multi-echo approaches [38], parallel imaging (SENSE, GRAPPA) [39–42], or echo-planar spectroscopic imaging (EPSI) [37, 43]. EPSI is a particularly promising methodology since it offers an order of magnitude speedup (reduction) in scan time, without sacrificing spectral quality, and appears to be the most practical way of achieving whole-brain coverage. An example of a short TE whole-brain EPSI scan recorded on a 3 T system with a 32-channel head coil is shown in Fig. 3.7. However, there have been few applications of this methodology to brain tumors to date, most likely because of its current lack of commercial availability.
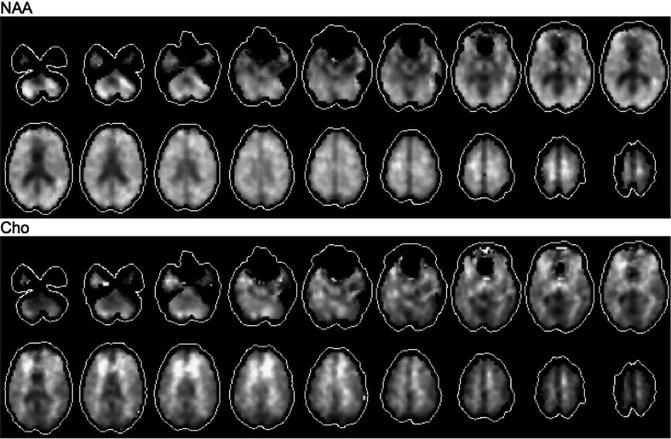
Fig. 3.7
An example of NAA and choline images reconstructed from a 3 T EPSI acquisition with whole-brain coverage in a normal adult volunteer. Scan parameters include 0.5 cm3 voxel size, TE 26 ms, GRAPPA acceleration factor of 2, scan time 16 min, 32-channel head coil
Finally, there are certain compounds that are present in the brain at low mM concentrations which are potentially detectable by MRS, but which are difficult to quantify by conventional techniques because their signals overlap with those of the compounds present at higher concentrations—examples of these include the inhibitory transmitter γ-aminobutyric acid (GABA) [44], and the antioxidant glutathione (GSH). In these cases, a methodology known as “spectral-editing” makes use of the specific properties of the coupled spin system to be detected to selectively observe the desired compound, suppressing the signals from the higher concentration, overlapping compounds. One editing sequence increasingly being used for this purpose is the SV MEGA-PRESS sequence [45]; examples of this sequence for GABA and GSH in normal brain are shown in Fig. 3.8. Again, to date, there have been few studies of these compounds yet in human brain tumors, most likely because of lack of commercial availability of MEGA-PRESS sequence. However, MEGA-PRESS has been successfully used to observe 2HG in tumors with IDH1 and IDH2 mutations (Fig. 3.9) [21].
Fig. 3.8
(a) MEGA-PRESS pulse sequence for spectral editing—the standard PRESS sequence (Fig. 3.4) is modified to include a pair of frequency-selective editing pulses during the TE time period which can be used to select specific spin systems such as (b) GABA or (c) glutathione (GSH). Edited spectra are shown at 3 T in a normal adult volunteer. In (b), in addition to the GABA peak at 3.0 ppm, other peaks co-edit from glutamate and macromolecules. In (c), in addition to the GSH peak at 2.9 ppm, other peaks co-edit from NAAG and lipids/lactate
Fig. 3.9
Detection of 2-hydroxyglutarate (2-HG) in vivo in a secondary glioblastoma with an IDH1R132H mutation using the MEGA-PRESS pulse sequence. Edited spectra from both the lesion and normal brain show co-edited signals from glutamate, glutamine, and GABA; however only the spectrum from the lesion shows a peak from 2-HG at about 3.9 ppm. Adapted from Andronesi et al., Science Translational Medicine, 116(4), 1–10, 2012
Equally as important as the pulse sequence used to record the data is the software used for data analysis. Ideally, fully automated spectral curve-fitting algorithms should be used to provide a quantitative estimate of each metabolite concentration [46]. An example of one such analysis package (“LCModel”) is shown in Fig. 3.1 [46]. However, although such software exists and is often used in clinical research studies, it is little utilized in routine clinical practice, where visual interpretation (as in most radiological readings) is most common. Other commonly used metrics include ratios of metabolites such as NAA/Cho, NAA/Cr, Cho/Cr, and mI/Cr. While these can be helpful, they can also be ambiguous or difficult to interpret when both metabolites change at the same time. For this reason, a better approach is often to compare the metabolite level in the tumor with that of the same metabolite in a normal brain region, for instance the mirror image location in the contralateral hemisphere, if available [47]. These measurements are often referred to as “normalized.” Sometimes, unfortunately, a contralateral reference normal region is not available for comparison (e.g., midline lesions such as pontine gliomas), in which case a knowledge of normal age- and regional-related spectral variations in normal control subjects is essential for proper interpretation.
Tumor Grading and Diagnosis
While conventional MRI is exquisitely sensitive for the detection of lesions within the brain, its actual specificity is quite low, in that lesions of similar MRI appearance may have quite different underlying pathophysiology. Since the pathophysiology determines the appropriate course of treatment, it is very important to establish an accurate diagnosis as early as possible, preferably before a biopsy is performed. MRS may help narrow the range of differential diagnoses, but also suffers itself from a relative lack of specificity.
Since high-grade brain tumors are usually treated more aggressively than low-grade, the planning of a surgical biopsy may be assisted by knowledge of tumor grade, and location of the most aggressive region of tumor growth. Several studies in astrocytomas have found a positive correlation between Cho levels and tumor grade [9, 23, 48
 Imaging Metabolic and Molecular Functions in Brain Tumors with Positron Emission Tomography (PET)
 BOLD fMRI for Presurgical Planning: Part I
 Role of Amide Proton Transfer (APT)-MRI of Endogenous Proteins and Peptides in Brain Tumor Imaging
 Diffusion Tensor Imaging: Introduction and Applications to Brain Tumor Characterization
 Proton Magnetic Resonance Spectroscopy and Spectroscopic Imaging of Primary Brain Tumors
 Ultra-High Field MRSI (7T and Beyond)


Related posts:
Imaging Metabolic and Molecular Functions in Brain Tumors with Positron Emission Tomography (PET)
BOLD fMRI for Presurgical Planning: Part I
Role of Amide Proton Transfer (APT)-MRI of Endogenous Proteins and Peptides in Brain Tumor Imaging
Diffusion Tensor Imaging: Introduction and Applications to Brain Tumor Characterization
Proton Magnetic Resonance Spectroscopy and Spectroscopic Imaging of Primary Brain Tumors
Ultra-High Field MRSI (7T and Beyond)
Stay updated, free articles. Join our Telegram channel
Full access? Get Clinical Tree
