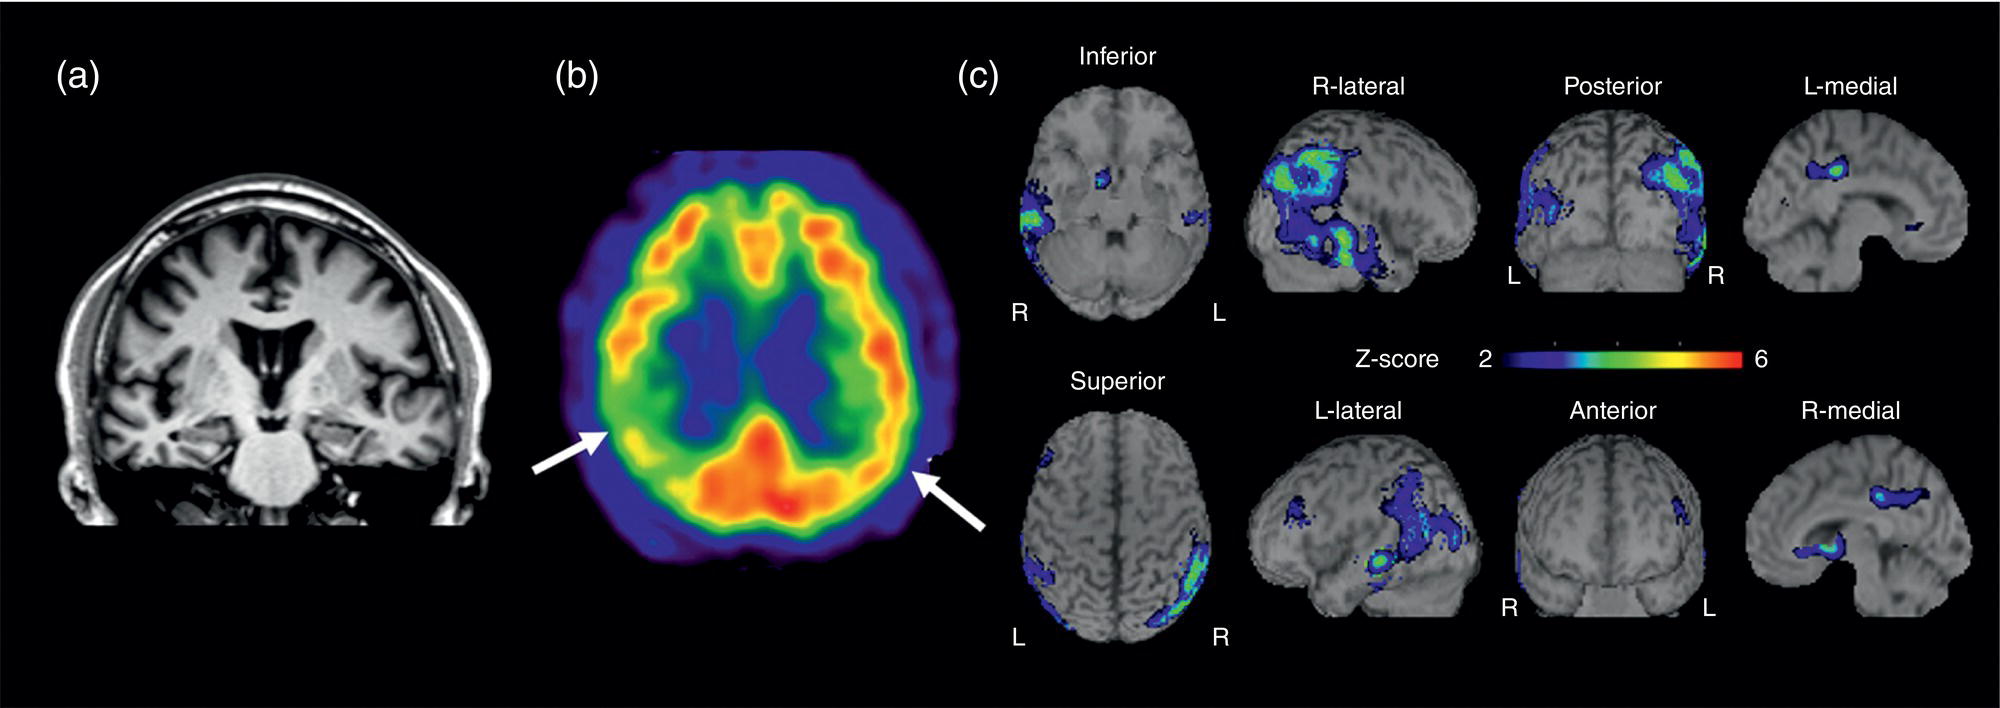
Hiroshi Matsuda1, Eku Shimosegawa2, Yoko Shigemoto3, Noriko Sato3, Hiroyuki Fujii3, Fumio Suzuki3, Yukio Kimura3, and Atsuhiko Sugiyama4 1 Integrative Brain Imaging Center, National Center of Neurology and Psychiatry, Kodaira, Japan 2 Department of Molecular Imaging in Medicine, Osaka University Graduate School of Medicine, Suita, Japan 3 Department of Radiology, National Center of Neurology and Psychiatry, Kodaira, Japan 4 Department of Neurology, Graduate School of Medicine, Chiba University, Chiba, Japan The correct interpretation of neuronuclear images such as those of brain perfusion or metabolism requires not only identification of the neuroanatomical location of the abnormal perfusion or metabolism, but also comprehension of the brain networks involved. This is due to an often‐observed phenomenon called the remote effect, in which perfusion or metabolism is altered at a site far from the lesion via a neural circuit. Such sites do not normally show morphological changes. In addition, large‐scale brain networks should also be considered from the point of view that various types of neuropsychiatric disorders are increasingly regarded as being caused by abnormalities in specific brain networks. Large‐scale brain networks [1] have been inferred from the identification of extensive brain regions with functional connectivity by statistical analysis of blood oxygen level‐dependent (BOLD) signals on functional magnetic resonance imaging (MRI) or by other recording methods such as electroencephalography (EEG), positron emission tomography (PET), single‐photon emission computed tomography (SPECT), and magnetoencephalography. Cognitive tasks are performed not only by individual brain regions that operate in isolation, but also by a network of several distinct brain regions that are said to be “functionally connected” by tightly coupled activities. The set of brain regions identified to be linked in large networks depends on cognitive function. If the cognitive state is not explicit, the large brain network is a resting‐state network. Neuronuclear imaging of brain perfusion or metabolism is usually obtained when the brain is at wakeful rest. Accordingly, normal brain perfusion or metabolism patterns need to be recorded at the resting state. The main resting‐state networks include the default mode network (DMN) [2], dorsal attention network, salience network, and frontal–parietal network. Here, we focus on the DMN, which has been reported to particularly affect brain perfusion and metabolic imaging. The DMN is active during passive rest and mind wandering [3], namely, when people are thinking about others, thinking about themselves, remembering the past, and planning the future (Figure 5.1). Although the DMN was originally noticed to be deactivated for certain goal‐oriented tasks and is sometimes referred to as a task‐negative network, it can be active during other goal‐oriented tasks, such as autobiographical tasks or those related to social working memory [4]. The DMN is negatively correlated with other networks in the brain, such as the attention network [5]. Task‐induced deactivation in the DMN (Figure 5.2) is thought to be caused by dynamic allocation of processing resources throughout the brain [6]. In other words, if a task is simple or familiar, it can be processed with fewer processing resources, but if it is difficult or complicated, more resources are required. Additionally, brain areas require more processing resources if their activity increases. However, because the resource amount of the whole brain is limited, the activity of the area unrelated to the task is considered to be reduced due to the state of the processing resource supply at that time. Therefore, when the processing resources in the brain are allocated to an essential area to appropriately perform a task, the amount of resources allocated to the DMN area decreases, thereby reducing its activity. The DMN activity is more significantly reduced when the task is more difficult or requires more processing resources due to its complexity [7]. In addition, when the cognitive load is high, for example due to a complicated task, the DMN region needs to be suppressed for the task to be performed accurately [8]. Figure 5.1 Activation of the DMN at wakeful rest in normal controls. (a) Brain glucose metabolism using 18F‐FDG, (b) brain perfusion SPECT using 99mTc‐ECD, and (c) brain perfusion using arterial spin labeling (ASL) MRI indicate high activity in the PCC, precuneus, and mPFC (arrows). The DMN is a series of interconnected, anatomically defined, brain regions. Networks can be separated into hubs and subsystems. There are three functional hubs related to information regarding the self. The first is the posterior cingulate cortex (PCC) and precuneus, which combine bottom‐up attention with information from memory and perception. The ventral part of the PCC is activated in all tasks, including those related to the self and others, recall of the past, imagination of the future, and concept processing and spatial navigation. The dorsal part of the PCC is involved in involuntary awareness and arousal. The precuneus is involved in visual, sensorimotor, and attentional information. The second functional hub is the medial prefrontal cortex (mPFC), which is involved in decisions regarding self‐processing, such as personal information, autobiographical memories, future goals and events, and decision‐making concerning individuals who are very close, such as family members. The ventral part of the mPFC is involved in positive emotional information and internally valued rewards. The third hub is the angular gyrus, which links perception, attention, spatial cognition, and behavior and supports episodic memory recall. Four dorsal medial subsystems are related to thinking about others. The first is the dorsal mPFC, which is involved in socially oriented thinking, such as determination or inference of the purpose of another’s behavior. The second is the temporoparietal junction, which reflects beliefs about others, also known as the theory of mind. The third is the lateral temporal cortex, which is related to the retrieval of social semantic and conceptual knowledge. The fourth is the anterior temporal pole, which abstracts conceptual information, particularly that social in nature. There are four medial temporal subsystems related to autobiographical memories and future simulations. The first is the hippocampus, which forms new memories and is involved in remembering the past and imagining the future. The second is the parahippocampal gyrus, which is involved in space and scene recognition and simulation. The third is the retrosplenial cortex, which is involved in spatial navigation. The fourth is the posterior inferior parietal lobe, which forms a junction of auditory, visual, and somatosensory information and attention. These DMN regions do not always show the same activity pattern. The PCC and mPFC are often relatively collaborative, but the activities of the other areas, such as the inferior parietal cortex, lateral temporal cortex, and hippocampus, vary according to the requirements of the task [9]. The most noticeable DMN‐related disease is Alzheimer disease (AD). The amyloid β (Aβ) accumulation, brain atrophy, and decreased brain perfusion and metabolism specifically observed in AD patients are particularly prominent in functional hubs of the DMN [10] (Figure 5.2): the PCC and precuneus, medial prefrontal area, and inferior parietal lobules. The functional connectivity among these regions is also significantly reduced compared with that of healthy individuals [11]. Furthermore, the functional binding of the DMN differs according to the presence of the apolipoprotein E4 (ApoE4) gene, the strongest genetic risk factor for AD, even in the absence of Aβ accumulation or cognitive decline [12]. Therefore, examination of the DMN using functional brain imaging may enable determination of the risk of AD development and an objective evaluation of the degree of AD‐related cognitive decline. Figure 5.2 Aβ accumulation and DMN deactivation and activation. (a) Aβ accumulation on 11C‐PiB PET in the PCC, precuneus, and mPFC (arrows) in a patient with mild cognitive impairment. (b) A Z‐score image showing significant Aβ accumulation in the PCC, precuneus, and mPFC (arrows) of the patient shown in (a) vs. the normal database of 11C‐PiB PET. (c) Significantly lowered brain perfusion on ASL‐MRI in the PCC, precuneus, and mPFC (arrows) during a word‐generation task in normal controls. (d) Significant activation of the precuneus (arrow) during a memory retrieval task revealed by task‐related functional MRI. It has been also reported that DMN connectivity is weaker in patients with autism than in healthy individuals [13]. In addition, analysis of healthy individuals revealed that the DMN is gradually formed throughout childhood [14]. It has been suggested that the formation of the DMN may be related to social gain, such as communication with others. From these findings, it may be possible to understand the cause of the communication disorders in autism in terms of an abnormal brain network due to a poorly formed DMN. Brain perfusion SPECT of autistic children in the resting state has revealed associations of impaired communication and social interaction skills thought to be related to deficits in the theory of mind with altered perfusion in the mPFC and anterior cingulate gyrus [15]. Functional connectivity between DMN nodes in the resting state is usually strong, but sleep deprivation or sedatives decrease the connectivity within the DMN [16]. During light nonrapid eye movement sleep, a perfusion decrease is observed in the DMN of the left mPFC and left inferior parietal cortex. During deep nonrapid eye movement sleep, deactivation of the DMN becomes more prominent in the PCC and precuneus, mPFC, and parietotemporal cortex. Propofol sedation induces deactivation of the DMN in the precuneus and inferior parietal lobe [17]. Certain goal‐oriented tasks reduce the activity of the PCC, precuneus, and inferior parietal lobes and can lead to false positives that are misdiagnosed as early AD. In addition, memory retrieval tasks in early AD patients activate the PCC and precuneus (Figure 5.2), which leads to false negatives that hinder AD diagnosis. A sleeping state or sedative administration also lowers DMN activity, leading to false positives in AD diagnosis. It has recently become possible for a slight change in brain perfusion and metabolism, hardly discernible on visual inspection, to be detected using statistical image analysis versus a normal database. Accordingly, it is important to understand the dynamic activity change of the resting‐state network, mainly the DMN, for improved understanding of neuronuclear medicine imaging. Brain ischemia is caused by decreased cerebral perfusion pressure (CPP) and is characterized by the sudden onset of neurological deficits and consciousness disturbance. Because CPP is simply defined as the difference between the mean arterial pressure and intracranial pressure, both a mean arterial pressure decrease and an intracranial pressure increase can cause brain ischemia. Ischemic stroke with occlusion of the carotid or intracranial arteries is a representative example of a mean arterial pressure decrease, whereas intracerebral hemorrhage or subarachnoid hemorrhage would increase intracranial pressure. One of the compensatory mechanisms for a lowered CPP is cerebral autoregulation under the pressure‐flow relationship [18]. By this mechanism, nutrient cerebral blood flow (CBF) is preserved by an active change in the diameter of small arteries and arterioles. Failure of cerebral autoregulation can be visualized and measured using SPECT and PET. SPECT studies can provide the magnitude and extent of the reduction in the clinical setting and are widely available. PET studies can evaluate misery perfusion, which is a state of lowered CBF with preserved metabolism. The penumbra, a lesion at risk of irreversible brain ischemia, can be defined by 15O‐PET measurement of CBF, cerebral blood volume (CBV), cerebral oxygen extraction fraction (OEF), and the cerebral metabolic rate of oxygen (CMRO2). These SPECT and PET indices can reliably predict ischemic stroke onset in the acute or chronic stage of brain ischemia and are regarded as the gold standard quantitative evaluations. Computed tomography (CT) and MRI can also provide brain perfusion‐related information. Using contrast medium, CT and MR perfusion imaging can obtain a CBF map, the CBV, and the mean transit time. Arterial spin labeling MRI (ASL‐MRI) is a noninvasive method for measuring CBF that uses magnetically labeled blood as an endogenous tracer. In addition, MRI measurements of blood oxygenation can provide information on oxygenation levels based on BOLD contrast in MR‐visible vessels and can replace CMRO2 measurement. Although these techniques have been implemented in the clinical setting and are widely used, concerns still surround the reliability of CBF quantification and oxygen metabolism measurement. Research efforts are still ongoing to directly compare radionuclide imaging and CT and MRI. In the acute stage of cerebral infarction, noncontrast CT is used as the first diagnostic imaging modality due to its cost‐effectiveness and ability to determine the indication for intravenous alteplase therapy. The Alberta Stroke Program Early CT Score (ASPECTS) can be used to reliably and rapidly assess acute stroke [19]. A study of the determination of ischemic severity by noncontrast ASPECTS and the contrast CT perfusion index in acute stroke patients [20] revealed that a noncontrast CT ASPECTS threshold of seven and a CT‐CBV threshold of eight could distinguish patients with poor follow‐up scans. MRI can obtain both perfusion and diffusion images and provide information on critical cell edema in brain tissue [21]. Regions with an abnormal perfusion‐weighted image (PWI) larger than the high signal of a diffusion‐weighted image (DWI) have sometimes been observed within the first few hours after stroke onset and have been suggested to indicate tissue at risk [21]. The disease process of acute ischemic stroke has also long been studied by means of CBF measurement in acute patients. Astrup et al. defined the ischemic penumbra as brain tissue with CBF thresholds between electric failure (20 mL/100 g/min) and membrane failure (6–10 mL/100 g/min) [22]. Clinically, the ischemic penumbra is defined as ischemic tissue at risk of infarction that is functionally impaired but salvageable through reperfusion and/or other neuroprotective strategies. 99mTc‐hexamethylpropyleneamine oxime (99mTc‐HMPAO) SPECT has been used to evaluate CBF measurement in acute stroke patients because of the feasibility of emergency 99Mo‐99mTc generation and the rapid fixation of 99mTc‐HMPAO in the brain tissue via metabolic trapping. Shimosegawa et al. reported that 99mTc‐HMPAO SPECT within 6 hours of onset could distinguish infarcted areas from morphologically viable brain with a lesion‐to‐contralateral radioactivity ratio of 0.6 (Figure 5.3) [23]. A SPECT study that measured residual CBF before intra‐arterial thrombolysis revealed that an ipsilateral CBF less than 30–50% of that of the contralateral brain regions induced cerebral infarction and that an ipsilateral CBF less than 20% of that of the contralateral hemisphere is associated with a probability of hemorrhagic infarction even after complete recanalization [24]. Another characteristic finding of acute brain ischemia is the phenomenon of postischemic hyperemia [23]. Local severe hyperemic lesions can be observed from 1.5 hours after the ictus, which correspond to the areas of early recanalization of occluded arteries on cerebral angiography and which become complete infarction within a few days of onset (Figure 5.4). Marked early focal hyperemia may indicate irreversible brain damage with vasoparalysis due to a decreased tissue pH and elevated lactic acid [25]. Figure 5.3 Acute left MCA occlusion. (a) CT obtained 1.3 hours after stroke onset indicates no obvious lesions. (b) DWI 1.8 hours after onset shows a small region of high intensity signal in the left putamen. (c) 99mTc‐HMPAO SPECT performed 2.3 hours after onset indicates severely decreased CBF in the anterior trunk territory of the left MCA (white arrow, lesion‐to‐contralateral ratio = 0.6). (d) A CT image obtained 4 days after onset demonstrates complete infarction in the areas with initially decreased CBF. Figure 5.4 Mixed state of severe hypoperfusion and postischemic hyperemia in acute cerebral infarction. (a) 99mTc‐HMPAO SPECT obtained 2.0 hours after onset indicates a CBF increase in the left temporal lobe (left, arrowhead) and a severe CBF decrease in the territory of the left anterior cerebral artery (ACA) and MCA (right, white arrows). (b) The capillary phase of left internal carotid angiography (CAG) performed 6 hours after onset shows capillary blush and early venous filling due to recanalization of the left MCA branch (black arrowhead) corresponding to the area of initial hyperemia. Left CAG also demonstrates branch occlusions of the left ACA and MCA (black arrows) corresponding to the area of decreased CBF. (c) Vertebral angiography indicates that collateral vessels developed from the territory of the left posterior cerebral artery to that of the left MCA. Infarct expansion occurs within the first few days after brain ischemia. This expansion of the brain infarct volume is preferentially observed in the PWI–DWI mismatch area on MRI. However, the lesions that progress to infarction (evolving infarcts) cannot be precisely predicted by the extent of the PWI–DWI mismatch area alone because the water diffusion of the corresponding lesion is normal in the hyperacute stage. A prospective 15O‐PET study demonstrated that the volume expansion in patients with acute cerebral infarction during the first 3 days was preceded by a lowered CMRO2 as early as 6 hours after onset but was not associated with a decrease in the apparent diffusion coefficient of water on MRI [26]. Within the PWI–DWI mismatch, a relative CMRO2 ranging from 0.45 to 0.62 in the surrounding area of the ischemic core on DWI is defined as the metabolic penumbra within 6 hours of stroke onset (Figure 5.5). This metabolic penumbra – defined by normal water diffusion on MRI with depressed CMRO2 on 15O2‐PET imaging – is a critical target for lowering the expansion of brain infarct volume by early therapeutic intervention. An MR‐derived oxygen metabolic index map also shows lower thresholds in the determination of the core/penumbra (0.28) or penumbra/not‐at‐risk area (0.42) [27]. Direct comparisons between PET‐CMRO2 and MR‐derived oxygen metabolic imaging are few in acute stroke patients, and further studies of the accuracy of quantitative measures of MR‐based oxygen metabolism are needed. Normal brain perfusion is protected by the cerebral autoregulation system, and CBF is stably maintained within the mean arterial pressure range of 60–160 mmHg. In patients with occlusion or stenosis of the internal carotid artery (ICA) or middle cerebral artery (MCA), collateral networks of the vascular system prevent a fall in CBF. When the CPP falls below the cerebral autoregulation threshold, stepwise hemodynamic risks are increased downstream of the occluded artery. According to the degree of the CPP decrease, CBF gradually decreases when the vasodilating capacity of small arteries and arterioles in the collateral circulation approaches the threshold. Therefore, the initial disturbance to cerebral autoregulation can be roughly estimated by the stimulation test of cerebral vasoreactivity (CVR). The arterial partial pressure of carbon dioxide (PaCO2) is a powerful chemical factor controlling whole‐brain CBF. Acetazolamide is another vasodilating agent for testing CVR [28] and can be used in both PET and SPECT examinations. Kuroda et al. have used an acetazolamide‐induced CVR test to classify the hemodynamic risk of patients with steno‐occlusive carotid artery disease [29]. Using the 133Xe inhalation method, they divided patients into four types according to their SPECT findings in the ipsilateral MCA territory, reporting that patients with type 3 ischemia (reduced baseline CBF and CVR) had a higher risk of subsequent ischemic stroke when treated medically. A further local decrease in CPP leads to an increased OEF from the blood to the brain, which is suggested to be a critical state of the compensatory response that aims to maintain brain oxygen metabolism under inadequate blood supply conditions. This phenomenon can be observed by 15O‐PET measurement as misery perfusion, a state of reduced CBF with preserved CMRO2 [30]. By combining the OEF with the CBV‐to‐CBF ratio, Powers et al. proposed stages of local hemodynamic risk in patients with carotid stenosis [31]. They demonstrated that CBV, the CBV‐to‐CBF ratio, and the OEF were increased when the capacity for compensatory vasodilatation was supposed to be overwhelmed, classifying this condition as stage 2 ischemia. Yamauchi et al. [32] revealed that an increased OEF is an independent predictor of the 5‐year risk of subsequent stroke in patients with symptomatic ICA and MCA occlusive disease. Therefore, 15O‐PET measurement can identify patients at high risk of subsequent stroke (Figure 5.6). A further decrease in CPP disturbs cellular metabolism and produces clinical symptoms of brain dysfunction, culminating in cell death and irreversible brain damage. Some studies show that extracranial–intracranial (EC–IC) bypass surgery could ameliorate an elevated OEF in patients with ICA and MCA occlusion (Figure 5.7) [30, 33]. Figure 5.5 Metabolic penumbra in a patient with acute right ICA embolic occlusion. (a) DWI, (b) apparent diffusion coefficient (ADC) map, (c) PWI, and (d) T2WI of MRI obtained 4 hours after onset. (e) CBF, (f) CMRO2, and (g) OEF on 15O‐PET obtained 3 hours after onset. MRI reveals a PWI–DWI mismatch in the territory of the right ICA. (h) T2WI on day 3 shows evolution of the infarction within the PWI–DWI mismatch. The initial PET image indicates that the PWI–DWI mismatch lesion indicates a CMRO2 decrease in the area of the evolving infarction associated with an elevated OEF (white arrow). Figure 5.6 Stage 2 cerebral ischemia in a cerebral infarction patient with left ICA occlusion. (a) CBF at rest, (b) CMRO2, (c) CBV, (d) OEF, and (e) T2‐FLAIR MRI. Decreased resting CBF and severely increased OEF are observed in the left ICA territory, indicating a misery perfusion state. (f) CBF at rest, (g) CMRO2, (h) CBV, (i) OEF, and (j) T2‐FLAIR MRI obtained 2 months after initial onset. The patient was medically treated during the 2‐month follow‐up period and experienced stroke recurrence in the area with misery perfusion. CBF measurement by ASL‐MRI is clinically feasible, particularly for screening patients with ischemic cerebrovascular disease. A comparative study of PET, SPECT, and ASL‐MRI reported that regional CBF and acetazolamide‐induced CVR values measured by ASL‐MRI are significantly correlated with those obtained by SPECT in patients with chronic carotid stenosis [34]. However, ASL‐MRI is generally limited in quantifying CBF. One of the most critical issues is the variation in the arterial spin transit time in patients with ischemic cerebrovascular disease [35]. A delayed arterial transit time can lead to underestimation of CBF because not all labeled spins have arrived at their destination voxel. It could also result in overestimation of CBF because the label decays faster in tissue than in blood. The multiple post‐labeling delay technique has recently become available to optimize the appropriate spin arrival time. However, a longer post‐labeling delay results in a lower signal‐to‐noise ratio due to a limit on the number of averages that can be obtained. An increase in the vascular bed via collateral blood vessels or dilated recanalized arteries leads to overestimation of ASL‐MRI CBF due to stagnation of labeled spins within the blood vessels. These remaining quantification issues of ASL‐MRI have not yet to be resolved, and diagnostic interpretations of ASL images and optimization of CBF measurement methods are still under discussion. The Carotid Occlusion Surgery Study was conducted to determine whether EC–IC bypass can lower the risk of subsequent ipsilateral ischemic stroke at 2 years in patients with recent symptoms from ICA occlusion [36]. The candidates in this trial underwent count‐based 15O2/H2 [15]O PET before surgery, and an ipsilateral‐to‐contralateral ratio of OEF greater than 1.130 was required for participation. Although the mean OEF ratio in the surgical group improved from 1.258 at baseline to 1.109 at the postoperative PET scan, the 2‐year ipsilateral stroke rate was not significantly different between the surgical and nonsurgical groups (21.0% vs. 22.7%). Therefore, the study failed to prove the clinical efficacy of EC–IC bypass for 2‐year stroke prevention. Accordingly, hemodynamic risk measurement by PET or SPECT in symptomatic patients with ICA or MCA steno‐occlusive disease has not yet been shown to accurately identify patients who would benefit from surgical intervention. Postoperative cerebral hyperperfusion syndrome (CHS) is a primary complication that occurs in the immediate period after carotid endarterectomy (CEA) or carotid arterial stenting [37]. The representative symptoms of CHS are severe headache, eye pain, seizure, and intracerebral hemorrhage. Although the overall incidence of CHS in CEA patients ranges from just 0.2% to 3.9%, the prognosis of patients with intracerebral hemorrhage after CEA is poor, with mortality rates from 33% to as high as 83% [38]. Impaired cerebral autoregulation caused by high‐grade carotid stenosis (greater than 90%) is considered to be one of the significant risk factors for CHS development [39]. Figure 5.7 Surgical intervention for hemodynamic risk in a patient with severe left ACA and MCA stenosis. (a) Preoperative MRI, (b) CBF at rest, (c) acetazolamide‐induced CBF, (d) CMRO2, and (e) OEF. The ipsilateral hemisphere shows a greater than 20% decrease in resting CBF, accompanied by a more than 10% decrease in CVR. The elevated OEF indicates high risk for subsequent stroke. (f) Postoperative MRI, (g) CBF at rest, (h) acetazolamide‐induced CBF, (i) CMRO2, and (j) OEF. After EC–IC bypass surgery, the fall in the resting CBF and CVR in the left cerebral hemisphere ameliorated and the OEF normalized. Transient ischemic attack disappeared after surgery without subsequent infarction. Several SPECT studies reported indices for predicting the hemodynamic risk of CHS before CEA in patients with carotid stenosis. A SPECT study with N‐isopropyl‐4‐[123I]iodoamphetamine (123I‐IMP) and acetazolamide challenge reported that ipsilateral CBF on the first postoperative day was significantly increased, both relatively and absolutely, in the lowered CVR group (CVR < 12%) but not in the normal CVR group (CVR ≥ 12%) [40]. Another 123I‐IMP SPECT study demonstrated that variables determined to be significant predictors of the hyperperfusion phenomenon included a pretreatment CVR of the ipsilateral hemisphere <20% and a pretreatment asymmetry index of resting CBF < 75% [41] (Figure 5.8). These studies indicated that the identification of at‐risk patients by preoperative evaluation of cerebral autoregulation would help in identifying patients at risk in whom blood pressure control should be initiated to prevent CHS. SPECT/PET measurement of hemodynamic risk in acute and chronic cerebral infarction patients has been established based on the pathophysiology of a CPP reduction in brain ischemia. However, the surgical prevention of stroke in patients with hemodynamic risk is controversial. The reliability of MR quantification of CBF and oxygen metabolism is still under investigation. Dementia, one of the major causes of disability in the elderly, is characterized by a decline in memory, impairment of other cognitive functions, and behavior that affects a person’s ability to perform their daily activities. Dementia diagnosis is largely based on the clinical course and on neuropsychological examinations. However, its accurate diagnosis is hindered by overlapping clinical presentations and etiologies. Neuroimaging has the potential to provide useful information for differential diagnosis and for monitoring disease progression. Two types of neuroimaging modalities – structural imaging with CT and MRI and radionucleotide imaging with SPECT and 18F‐fluorodeoxyglucose‐PET (FDG‐PET) – are the most widely used techniques for the diagnosis of dementia. CT may be performed to exclude treatable forms of dementia, such as chronic subdural hematoma or brain tumor. The most common cause of dementia is neurodegenerative disease, largely AD. MRI plays an important role in the investigation of atrophic brain changes in AD, but visual inspection alone can hardly evaluate slight changes in atrophy. Statistical analyses such as voxel‐based morphometry (VBM) can contribute to the diagnosis of AD in its early stage and objectively evaluate its progression. Stand‐alone VBM software running on Windows – the Voxel‐based Specific Regional analysis system for AD (VSRAD®) – has been widely used in the clinical diagnosis of AD in Japan [42]. SPECT and FDG‐PET are used to measure regional cerebral perfusion and metabolism in neurodegenerative dementia. In Japan, statistical analysis is usually performed using easy Z‐score imaging (eZIS) [43] and three‐dimensional stereotactic surface projection (3D‐SSP) [44]. Recent advances in voxel‐based statistical analysis have enormously improved the usefulness of neuroimaging for dementia analysis. Figure 5.8 Postoperative hyperperfusion in a patient with severe left ICA stenosis. (a) 123I‐IMP SPECT before CAS shows severely decreased CBF in the left cerebral hemisphere. (b) T2‐FLAIR MRI and (c) magnetic resonance angiography (MRA) before CAS. A decreased signal is observed in the left ICA and MCA. (d) 123I‐IMP SPECT obtained 2 days after CAS demonstrates an inversely and severely increased CBF in the left cerebral hemisphere. (e) Postoperative T2‐FLAIR MRI shows intracerebral hemorrhage in the left thalamus. (f) Postoperative MRA indicates complete recanalization of the left ICA. AD is the most common form of dementia, accounting for approximately two‐thirds of all cases of dementia. Clinically, it is characterized by cognitive deterioration and behavioral impairment. The histopathological characteristics are extracellular amyloid plaques and intracellular neurofibrillary tangles. Its diagnosis is based on clinical aspects of cognition and impaired daily activities. MRI, SPECT, and FDG‐PET have been widely used and provide objective information for the diagnosis of AD. Moreover, the recent advent of amyloid‐ and tau‐PET has enabled in vivo; assessment of these pathologies. In 2011, the National Institute on Aging and the Alzheimer’s Association proposed new diagnostic criteria reflecting recent research [45]. These guidelines propose three phases of AD: AD dementia, mild cognitive impairment (MCI) due to AD, and preclinical AD. Because the pathological process of AD is considered to begin many years before its diagnosis, research into the preclinical phase is important for the development of therapeutic interventions. Preclinical AD is divided into three stages: stage 1 involves asymptomatic amyloidosis with high amyloid PET retention and low cerebrospinal fluid (CSF) levels of the 42‐amino acid‐long Aβ peptide (Aβ42); stage 2 has both amyloidosis and neurodegeneration with neuronal dysfunction on FDG‐PET or functional MRI, high CSF tau/phosphorylated tau, and cortical thinning/hippocampal structure atrophy on MRI; and stage 3 adds subtle cognitive decline to the amyloidosis and neurodegeneration with evidence of a subtle change from baseline cognition and poor performance on more challenging cognitive tests, without meeting the criteria for MCI. Due to recent progress in biomarkers, Jack et al. [46] propose a new biomarker definition called the ATN biomarker, which is classified based on the presence or absence of A, namely Aβ biomarker (amyloid PET or CSF Aβ42), T, namely tau biomarker (CSF phosphorylated tau or tau‐PET), and N, namely neurodegeneration biomarker or neuronal injury biomarker (FDG‐PET, structural MRI, or CSF total tau). These approaches will lead to the early diagnosis of AD and improved diagnostic accuracy. MRI and SPECT have been widely used as imaging biomarkers of AD in Japan. These modalities show characteristic patterns of cerebral atrophy and decreased regional cerebral perfusion in patients with AD, which can be clarified by statistical approaches [47]. It is important to bear in mind that there is a dissociation between brain perfusion and atrophy in the involved areas, as well as marked differences in the areas involved between early‐ and late‐onset AD. Decreased perfusion in the PCC and precuneus are the earliest changes observed in AD, and such changes may precede MRI‐detectable atrophy [48]. However, due to the low spatial resolution of SPECT images, it is difficult to visually detect decreased perfusion in these areas. Statistical image analysis is useful for detecting subtle changes. Because these areas are the main parts of the DMN involved in episodic memory and executive function, even amnestic MCI patients show decreased perfusion in this region. Among the hippocampal structures, the entorhinal cortex is the first area where neurofibrillary tangles accumulate, which precedes neuronal cell loss and atrophy. The earliest decreased perfusion in the PCC is considered a remote effect caused by the neuronal cell loss in the entorhinal cortex via the hippocampal cingulum bundle [49]. The PCC and precuneus are the first areas with amyloid accumulation. Early‐onset AD patients show more prominently decreased atrophy and perfusion in the PCC/precuneus than late‐onset AD patients (Figure 5.9), and the perfusion decrease is usually severe compared with the atrophy. The first parietotemporal cortex to be affected in AD is the inferior parietal lobule, consisting of the supramarginal gyrus and angular gyrus; its involvement may also precede the atrophy detectable on MRI. The parietotemporal involvement is bilateral, although slight asymmetry to the perfusion decrease is usually observed. The perfusion decrease extends to the frontal lobes as the disease progresses, sparing the primary sensorimotor and visual cortices, with persistent asymmetry. Early‐onset AD patients show more prominent atrophy and perfusion decreases in the parietotemporal cortex than late‐onset patients [50]. Figure 5.9 A man in his 60s with early‐onset AD. (a) Coronal 3D‐T1WI shows mild hippocampal atrophy. (b) 99mTc‐ECD SPECT shows right dominant decreased perfusion in the bilateral parietal association cortices (arrows). Decreased perfusion in the posterior cingulate gyrus is difficult to detect via visual inspection of SPECT images. (c) Statistical analysis using easy Z‐score imaging software (eZIS) clearly demonstrates decreased perfusion in the bilateral posterior cingulate cortices in addition to the parietotemporal association cortices. The decreased perfusion in the medial temporal lobe is not evident in early‐onset AD. Neuropathological studies have shown that selective medial temporal atrophy is induced by neurofibrillary tangle deposition in the earliest stage of AD. Several MRI studies have consistently demonstrated medial temporal atrophy in AD. VSRAD has made it possible to detect structural changes in individual AD patients compared with the normal database [42]. The Z‐score in the target volume of interest in medial temporal structures is useful for evaluating medial temporal lobe atrophy relative to whole‐brain atrophy. In AD patients with medial temporal atrophy, the perfusion or metabolism measured in atrophied areas is underestimated by partial‐volume effects. Due to their low spatial resolution, these effects mostly affect SPECT images rather than PET. However, the perfusion in medial temporal lobes is maintained in the early stage of AD. This may result from a compensatory mechanism of the neurosynaptic response in the hippocampus. The decreased perfusion in the medial temporal lobes becomes more prominent in the advanced stage. Late‐onset AD patients show more prominent atrophy and perfusion decreases in the medial temporal lobes than early‐onset patients (Figure 5.10). 11C‐Pittsburgh Compound‐B (PiB) is a derivative of the amyloid‐binding dye thioflavin T and is currently the most studied and used tracer for amyloid PET imaging [51]. It binds to aggregated fibrillar Aβ, the form found in the cerebral cortex and striatum, but does not bind to amorphous Aβ, which is found in the cerebellum. Several studies have reported that its distribution pattern is consistent with the postmortem Braak stages of amyloid plaque. However, the short 20‐minute half‐life of 11C limits its clinical use to PET centers with on‐site cyclotron and radiopharmacy facilities. Therefore, for widespread clinical use, 18F‐labeled tracers with 110‐minute half‐lives, such as flutemetamol, florbetapir, and florbetaben, have been developed and commercialized [52]. Negative amyloid PET results show no binding in the cerebral cortex, whereas positive results show high binding in the posterior cingulate gyrus/precuneus, medial orbitofrontal, striatum, lateral temporal, and parietal gray matter. Because there is no binding in the cerebellar cortex, this area is used as the reference region (Figure 5.11). Although visual interpretation of amyloid PET is well‐established, it requires experienced readers. As a semiquantitative analytical method, the standardized uptake value ratio (SUVR) has been proposed [53]
5
Diseases of the Central Nervous System
Relevant Anatomy
Introduction
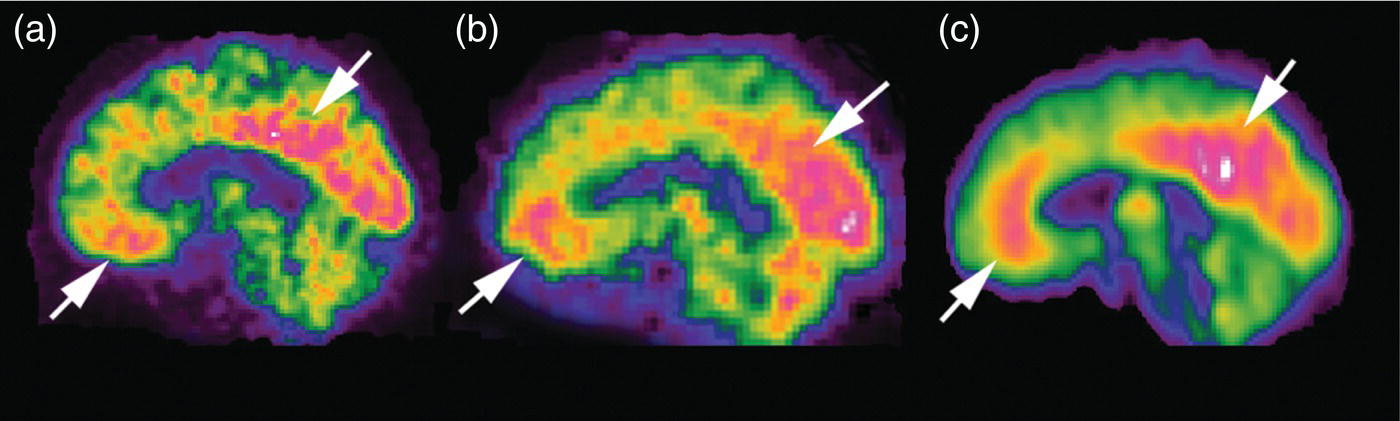
Default Mode Network
General Concept
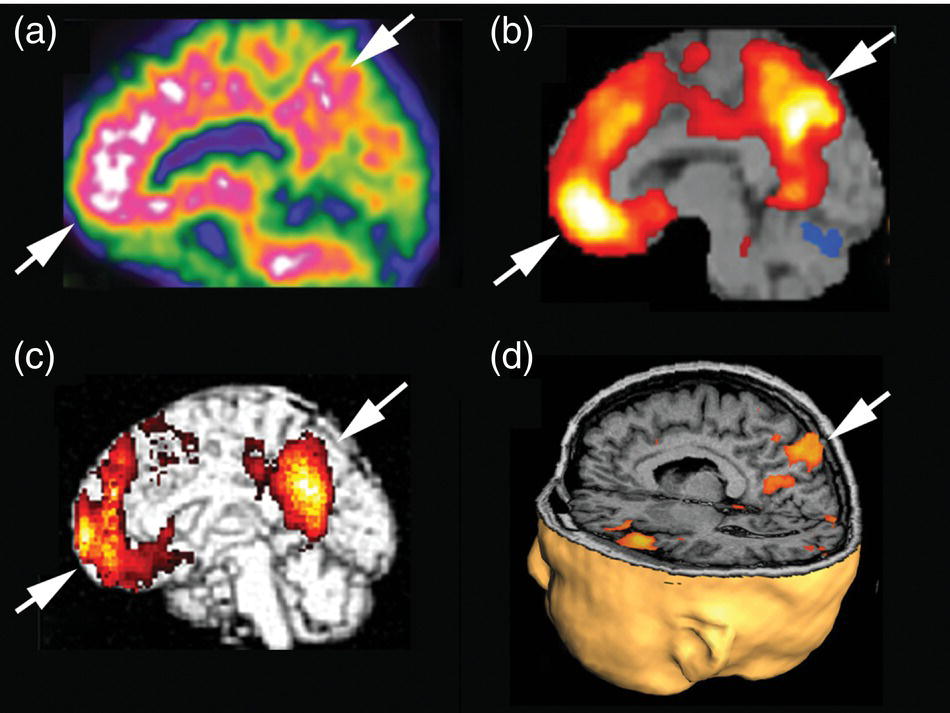
Anatomy and Function
Pathophysiology
Modulation
Summary
Disease‐based Imaging Findings
Cerebrovascular Disease
Introduction
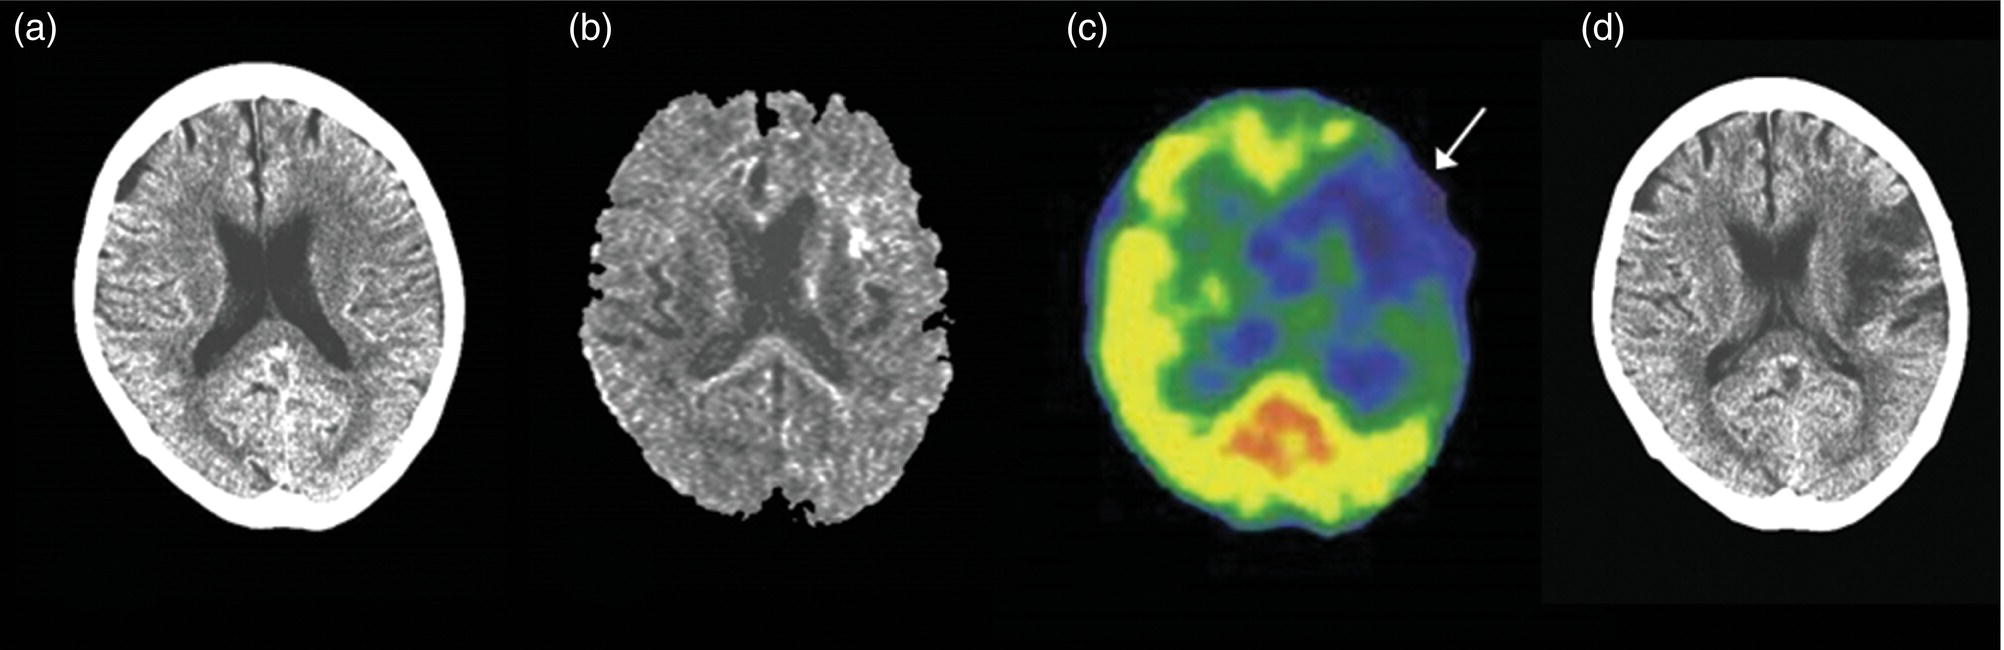
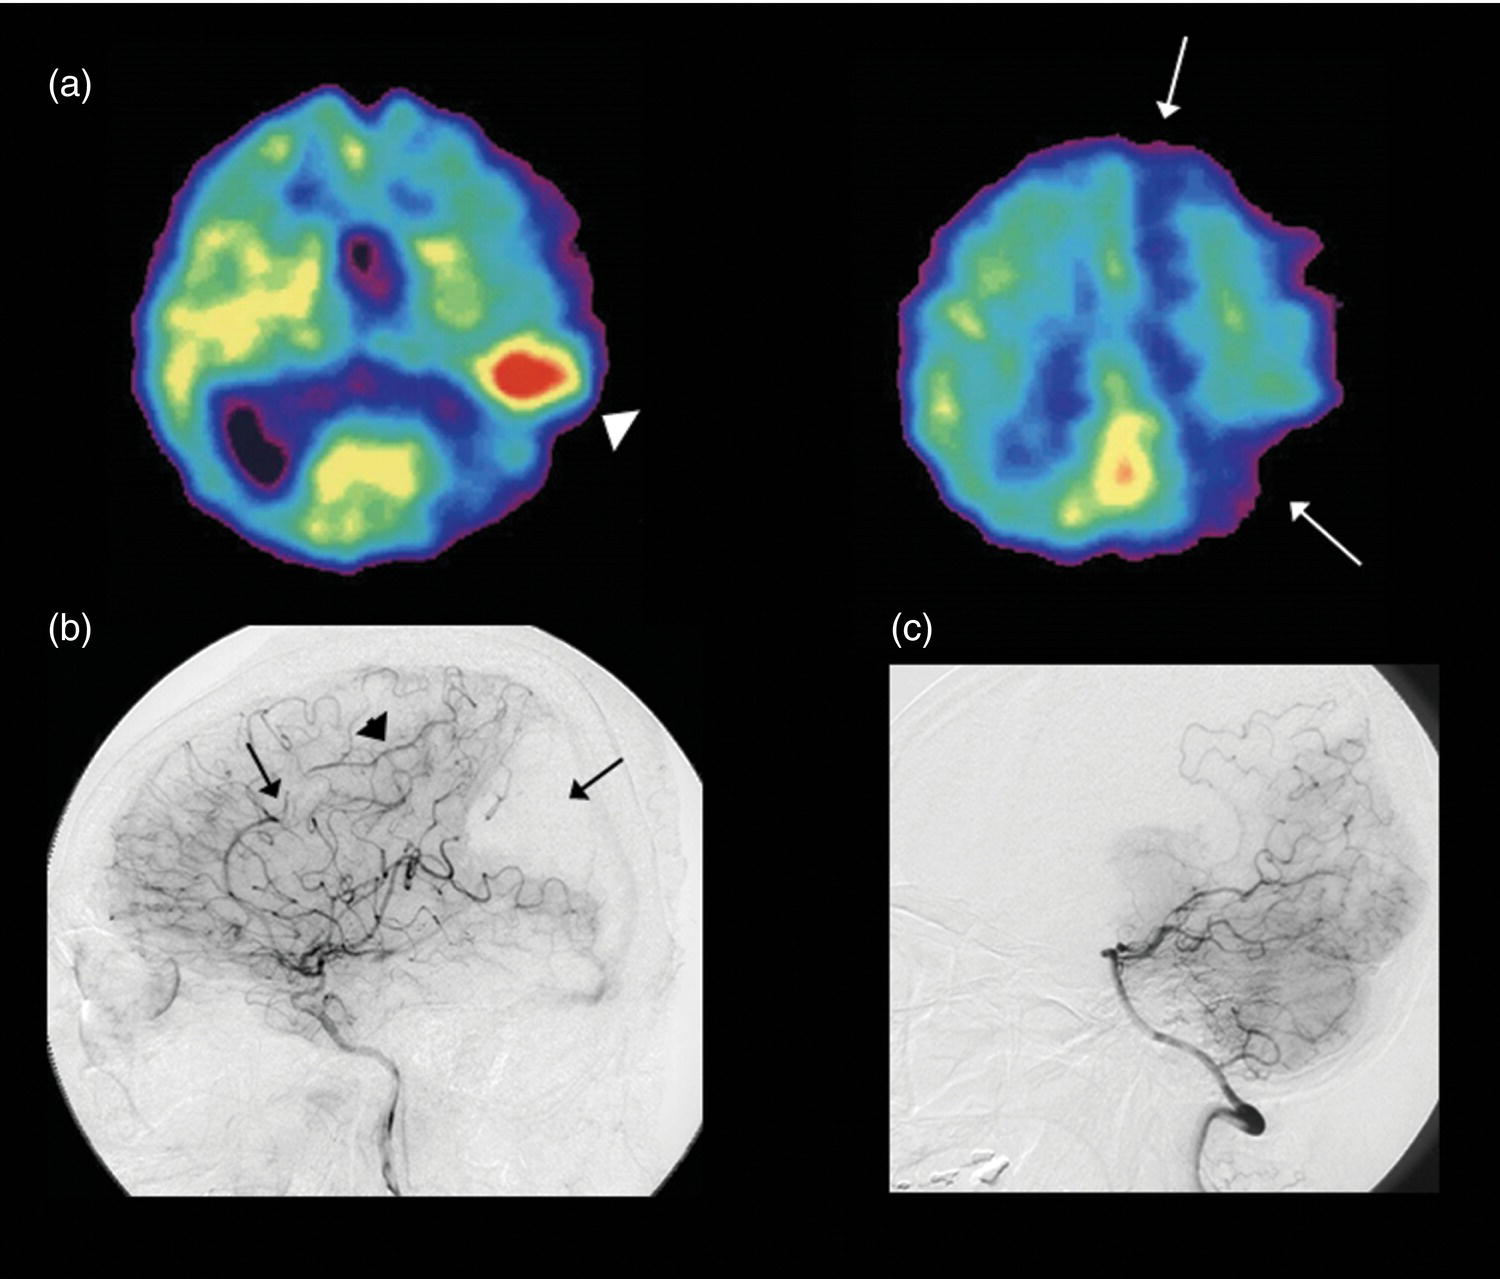
Evaluation of Ischemic Severity in Acute Cerebral Infarction
Evaluation of Hemodynamic Risk in Chronic Cerebrovascular Disease
Prediction of Postoperative Cerebral Hyperperfusion Syndrome
Summary
Dementia
Introduction
Alzheimer Disease
MRI, SPECT, and PET Findings in AD
Posterior Cingulate Gyrus and Precuneus
Parietotemporal Cortex
Medial Temporal Areas
Amyloid PET Imaging
Related posts:
 Nephro‐urinary Tract Pathologies: A Correlative Imaging Approach
 Imaging in Gliomas: Clinical Principles and Synergies with MRI
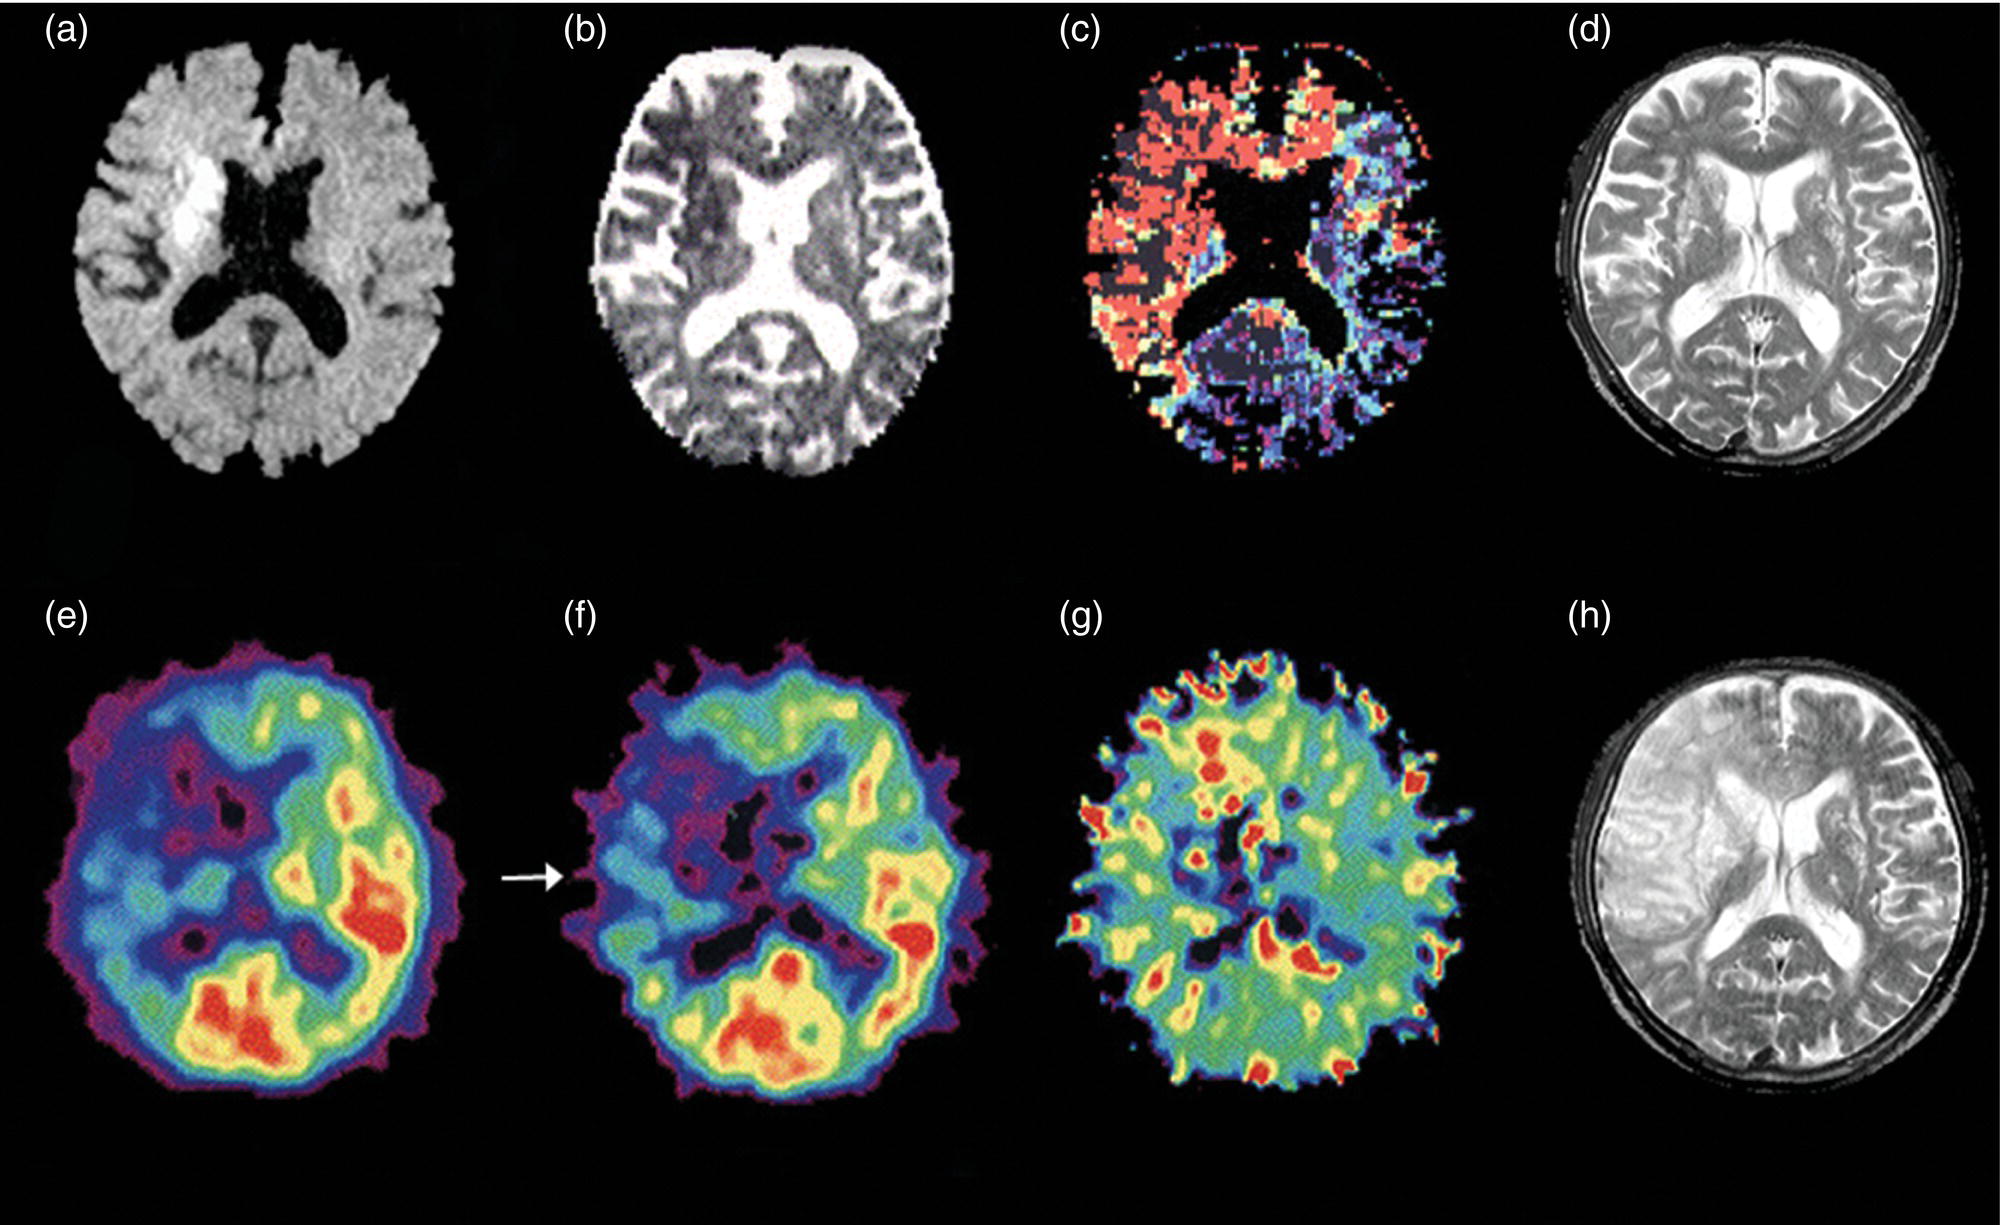
 Osteoporosis: Diagnostic Imaging and Value of Multimodality Approach in Differentiating Benign Versus Pathologic Compression Fractures
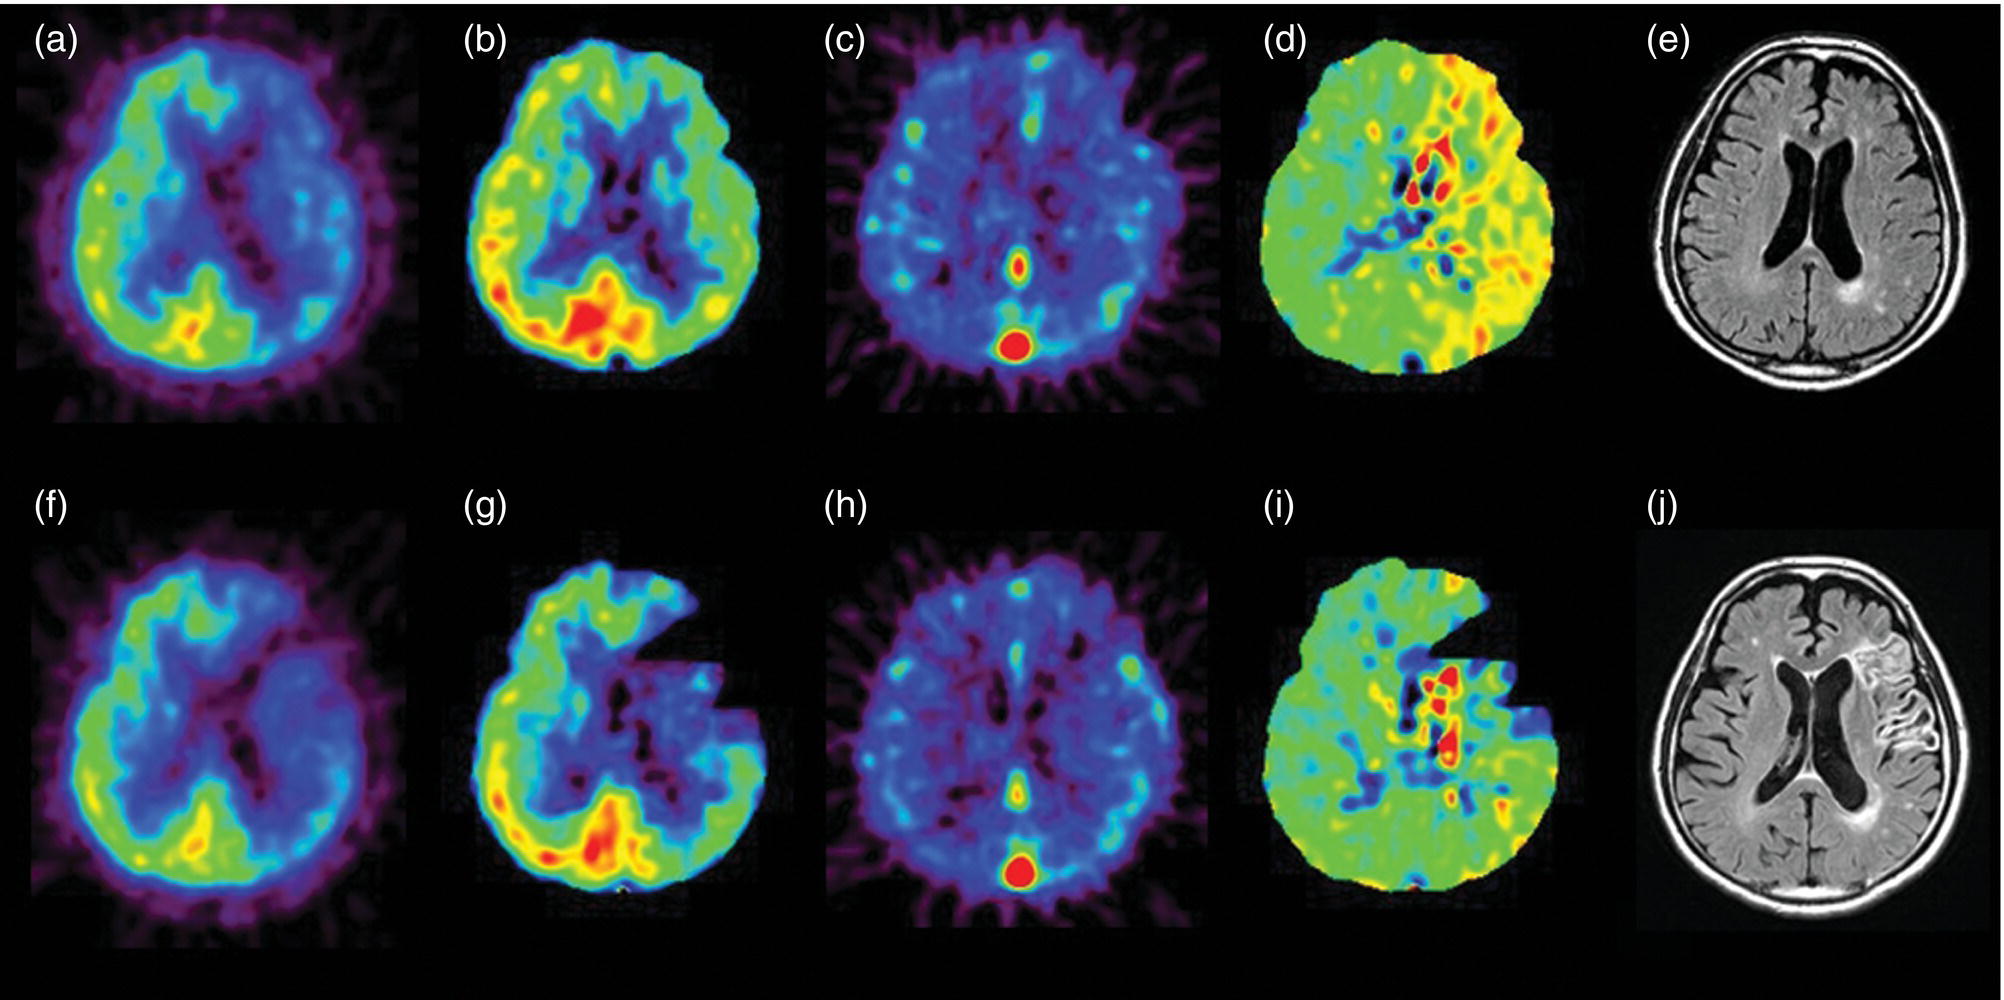
 Emergency Radiology
 Vascular System
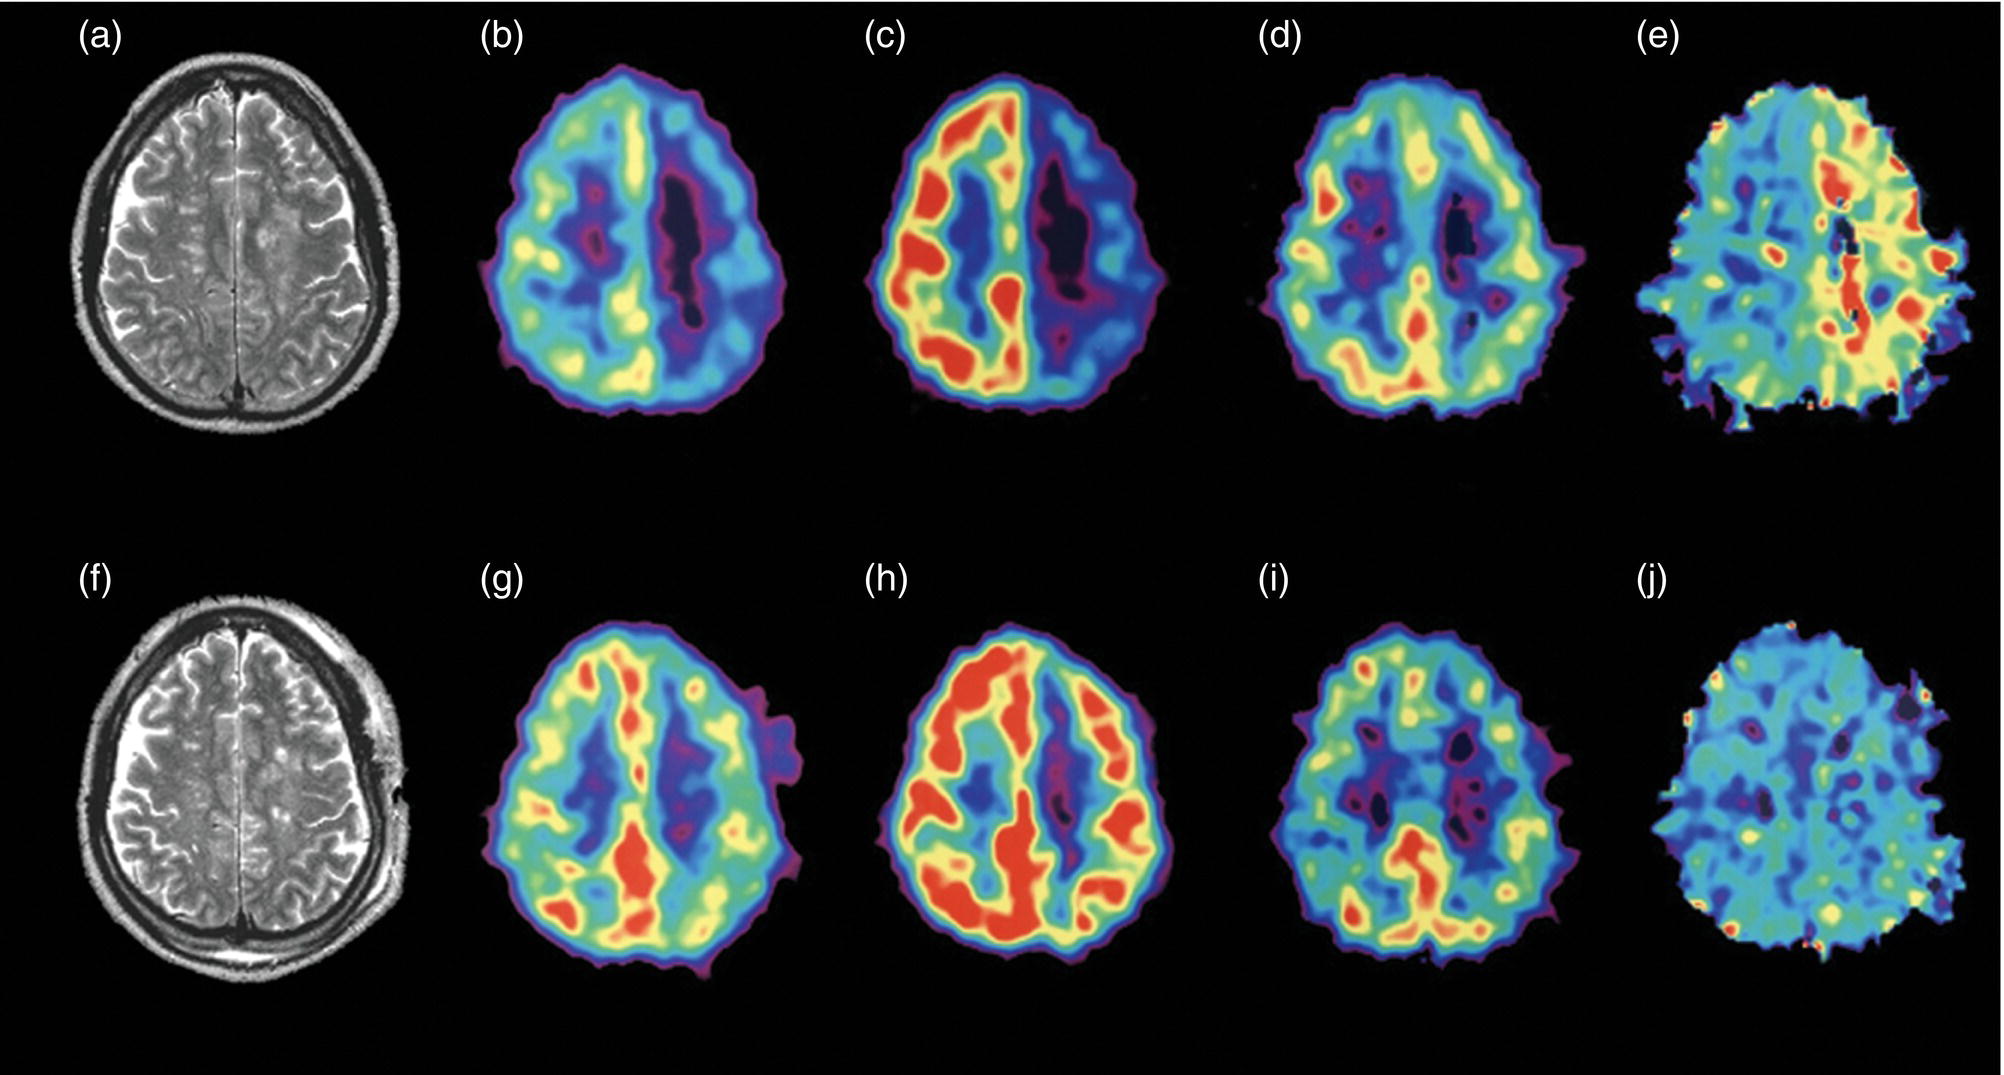
 Infection/Inflammation Imaging
![]()
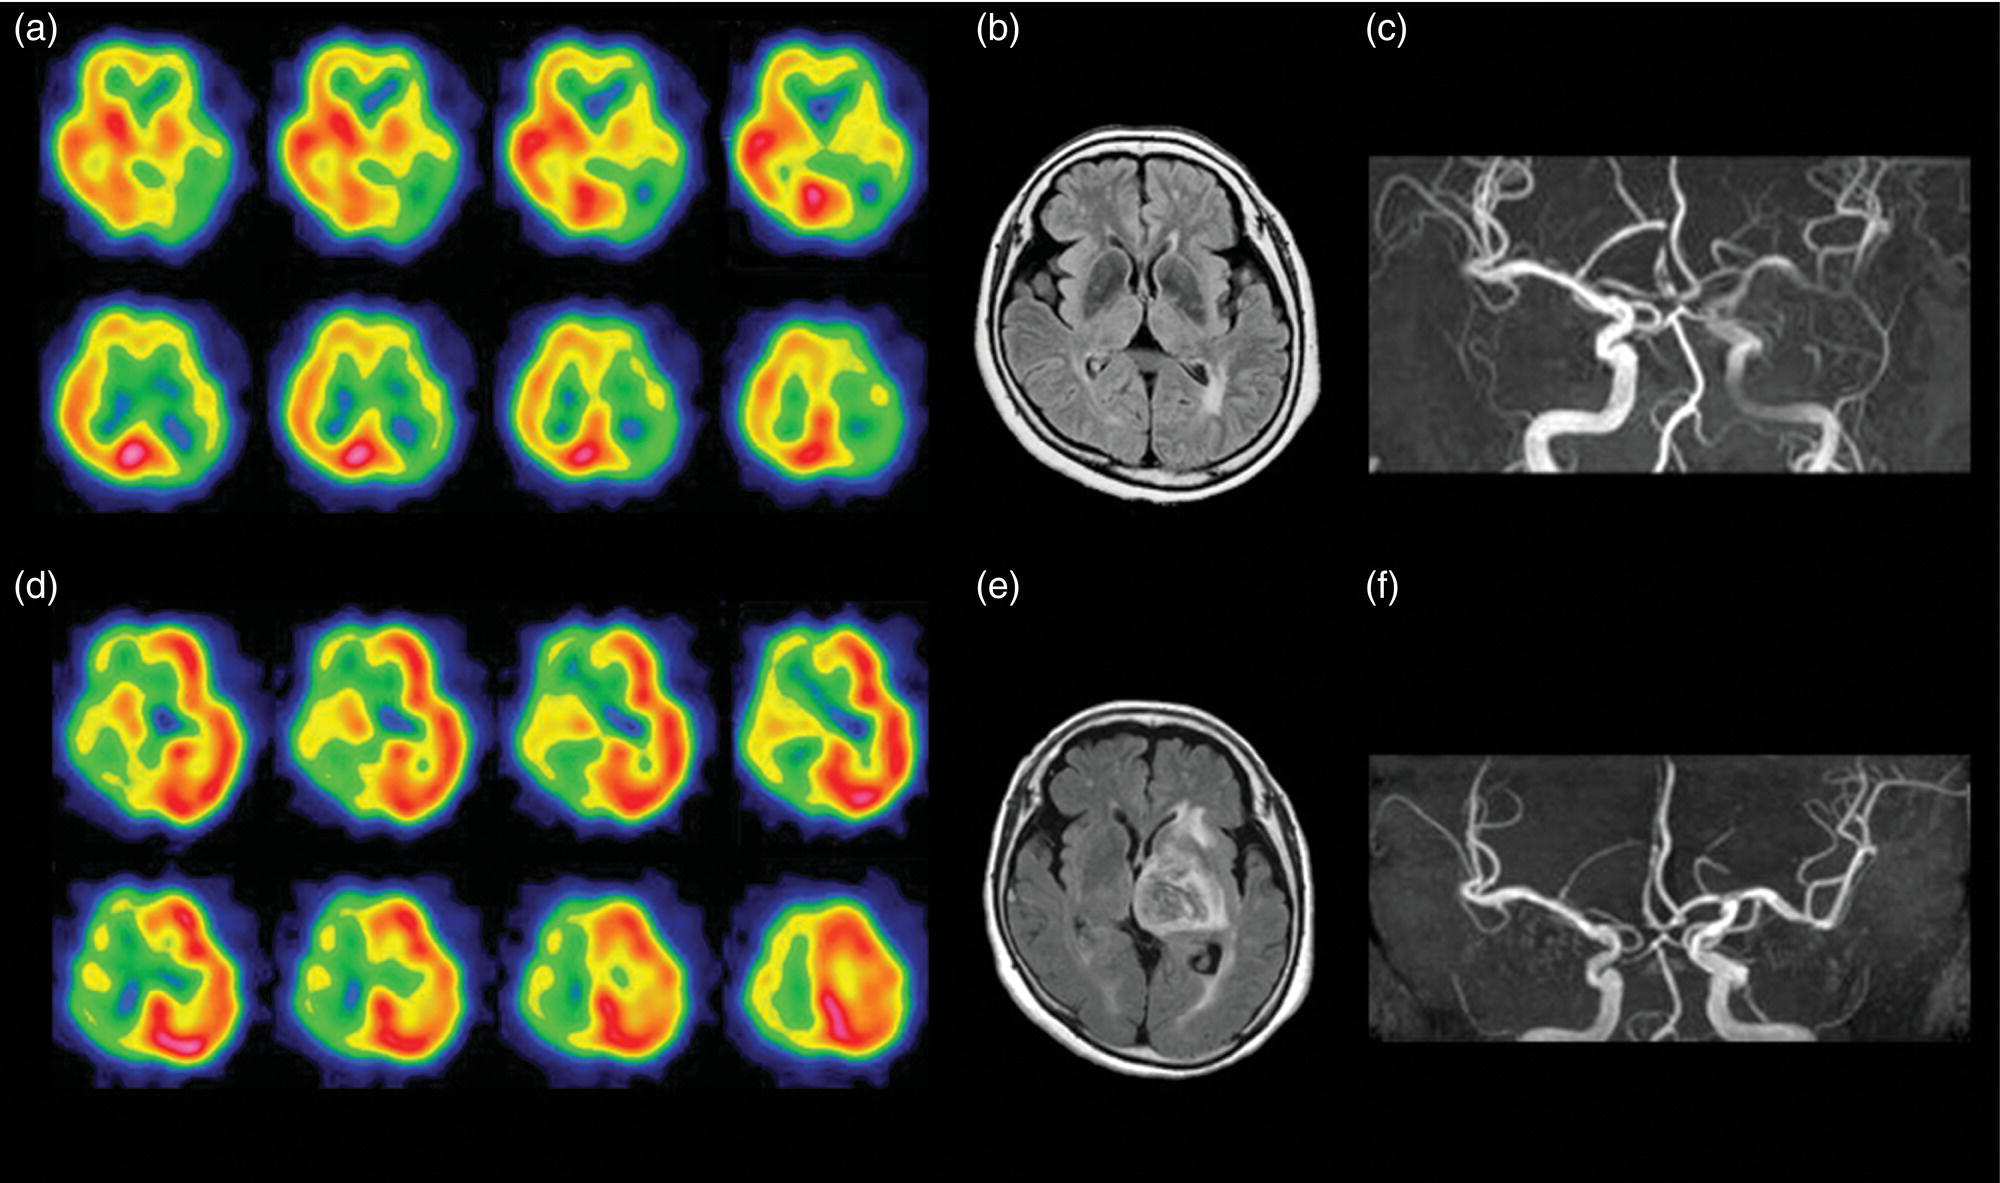
Stay updated, free articles. Join our Telegram channel

Full access? Get Clinical Tree


