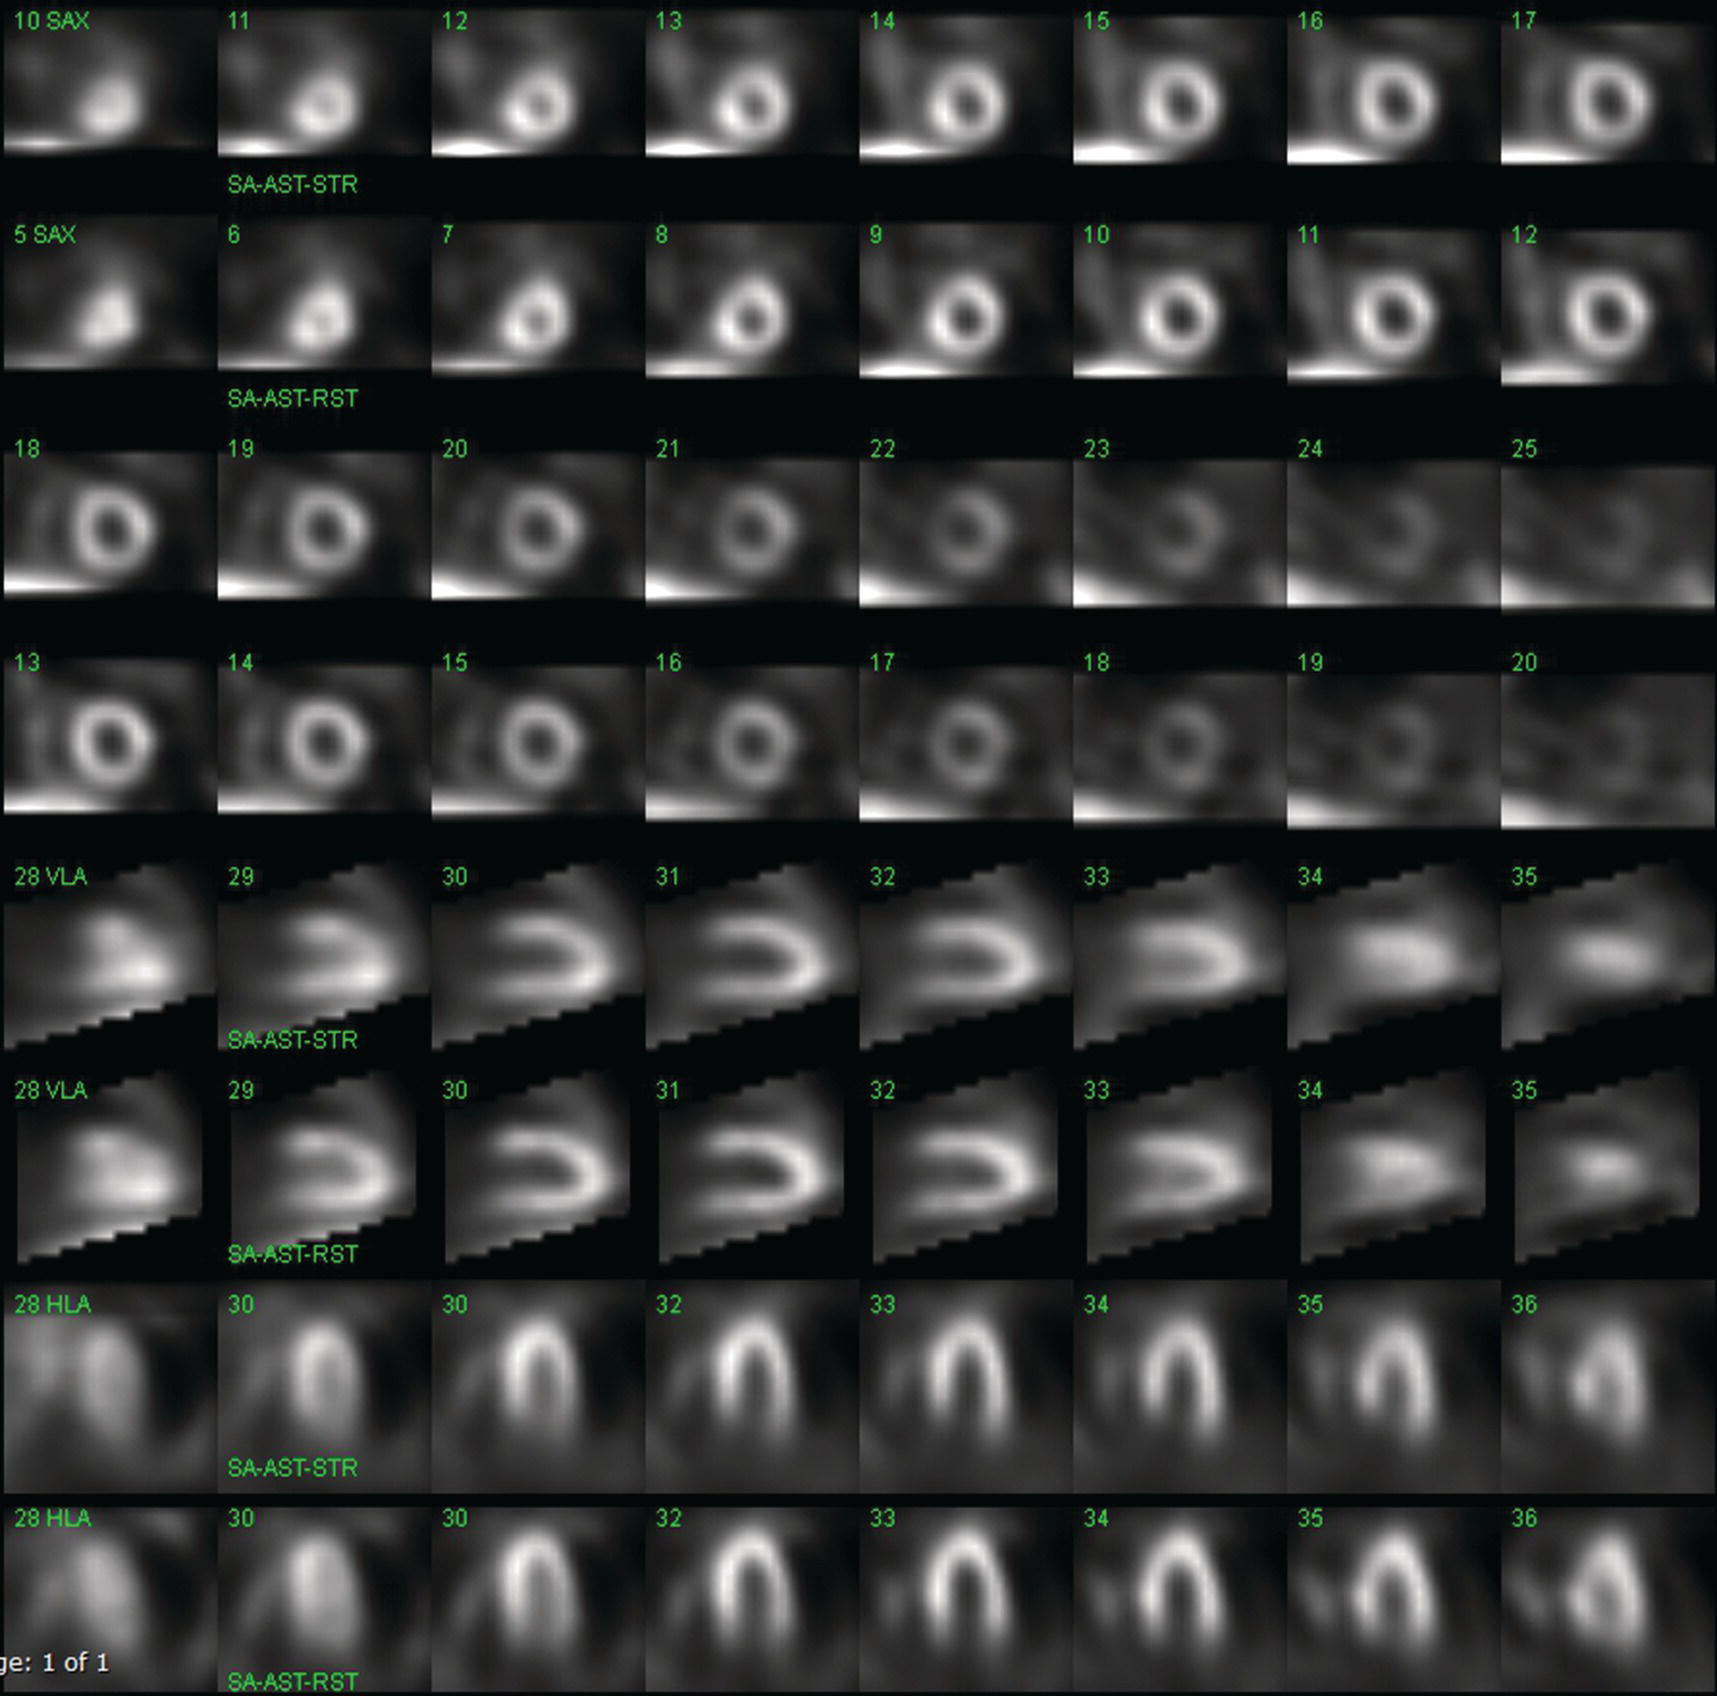
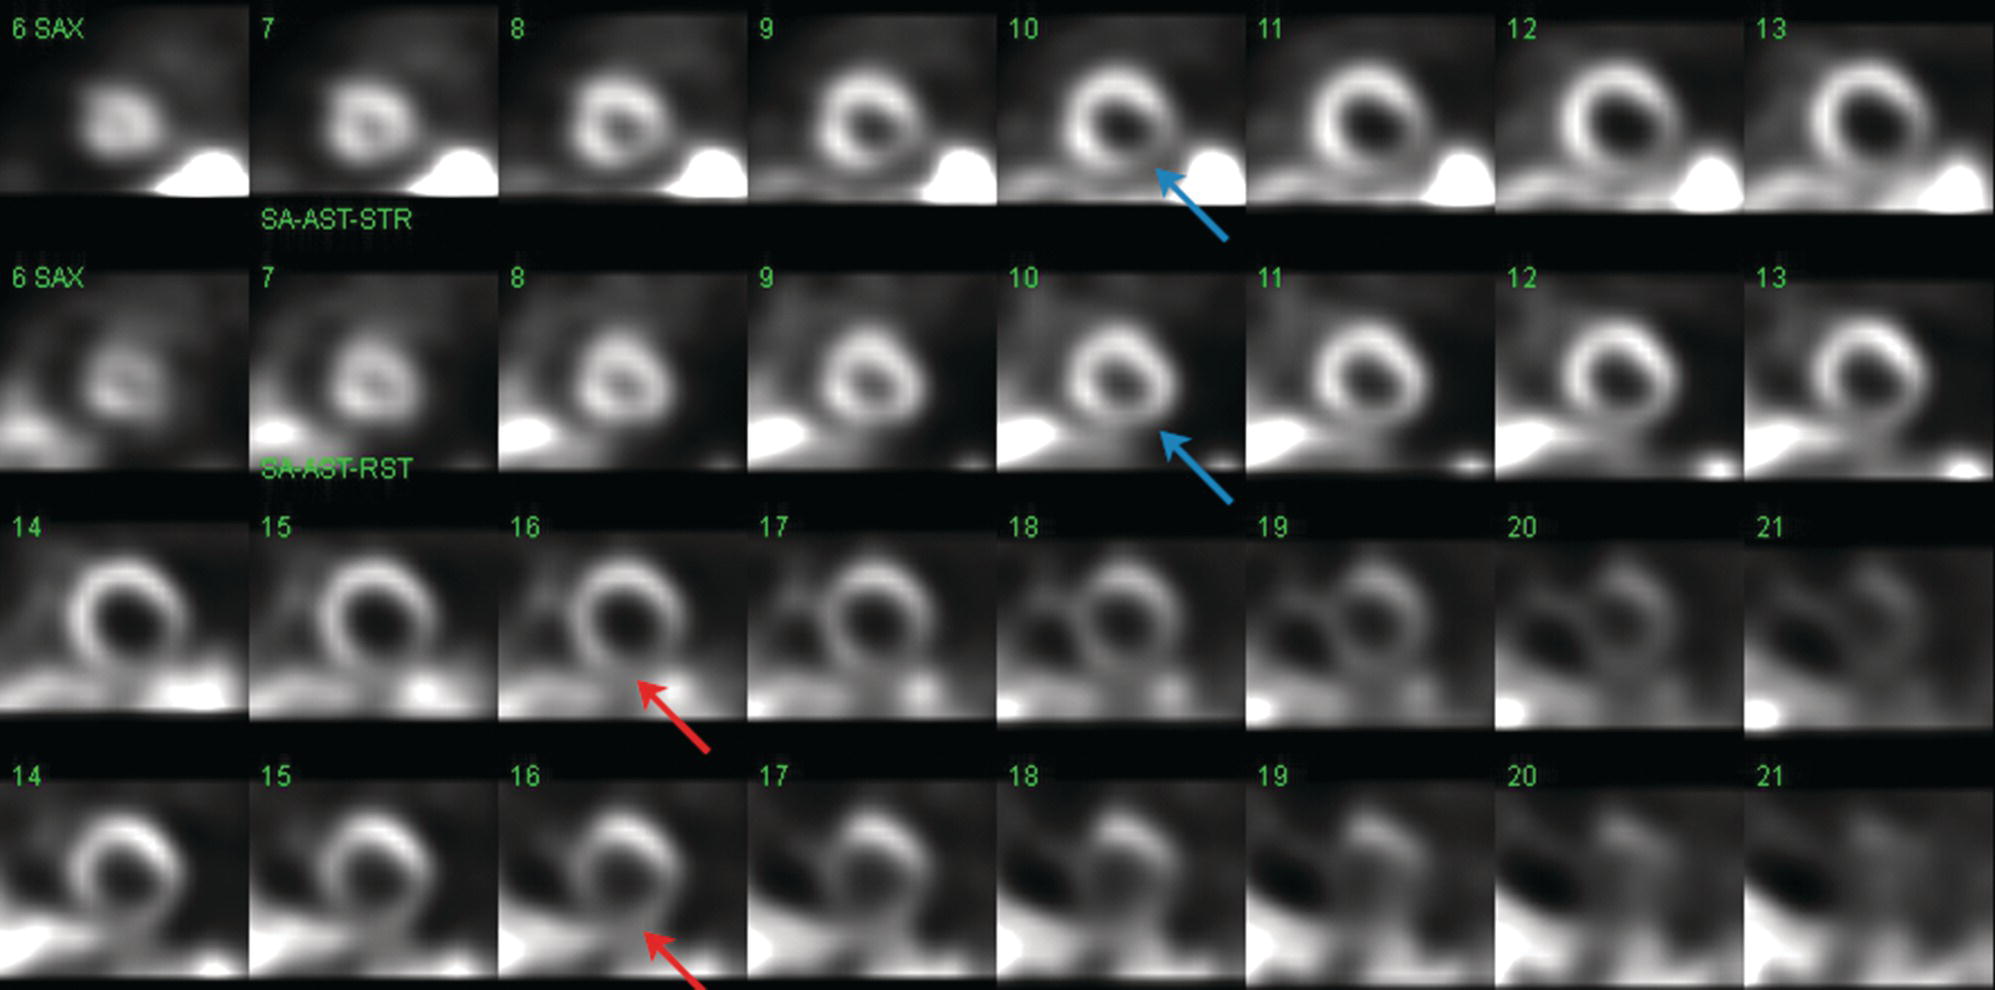
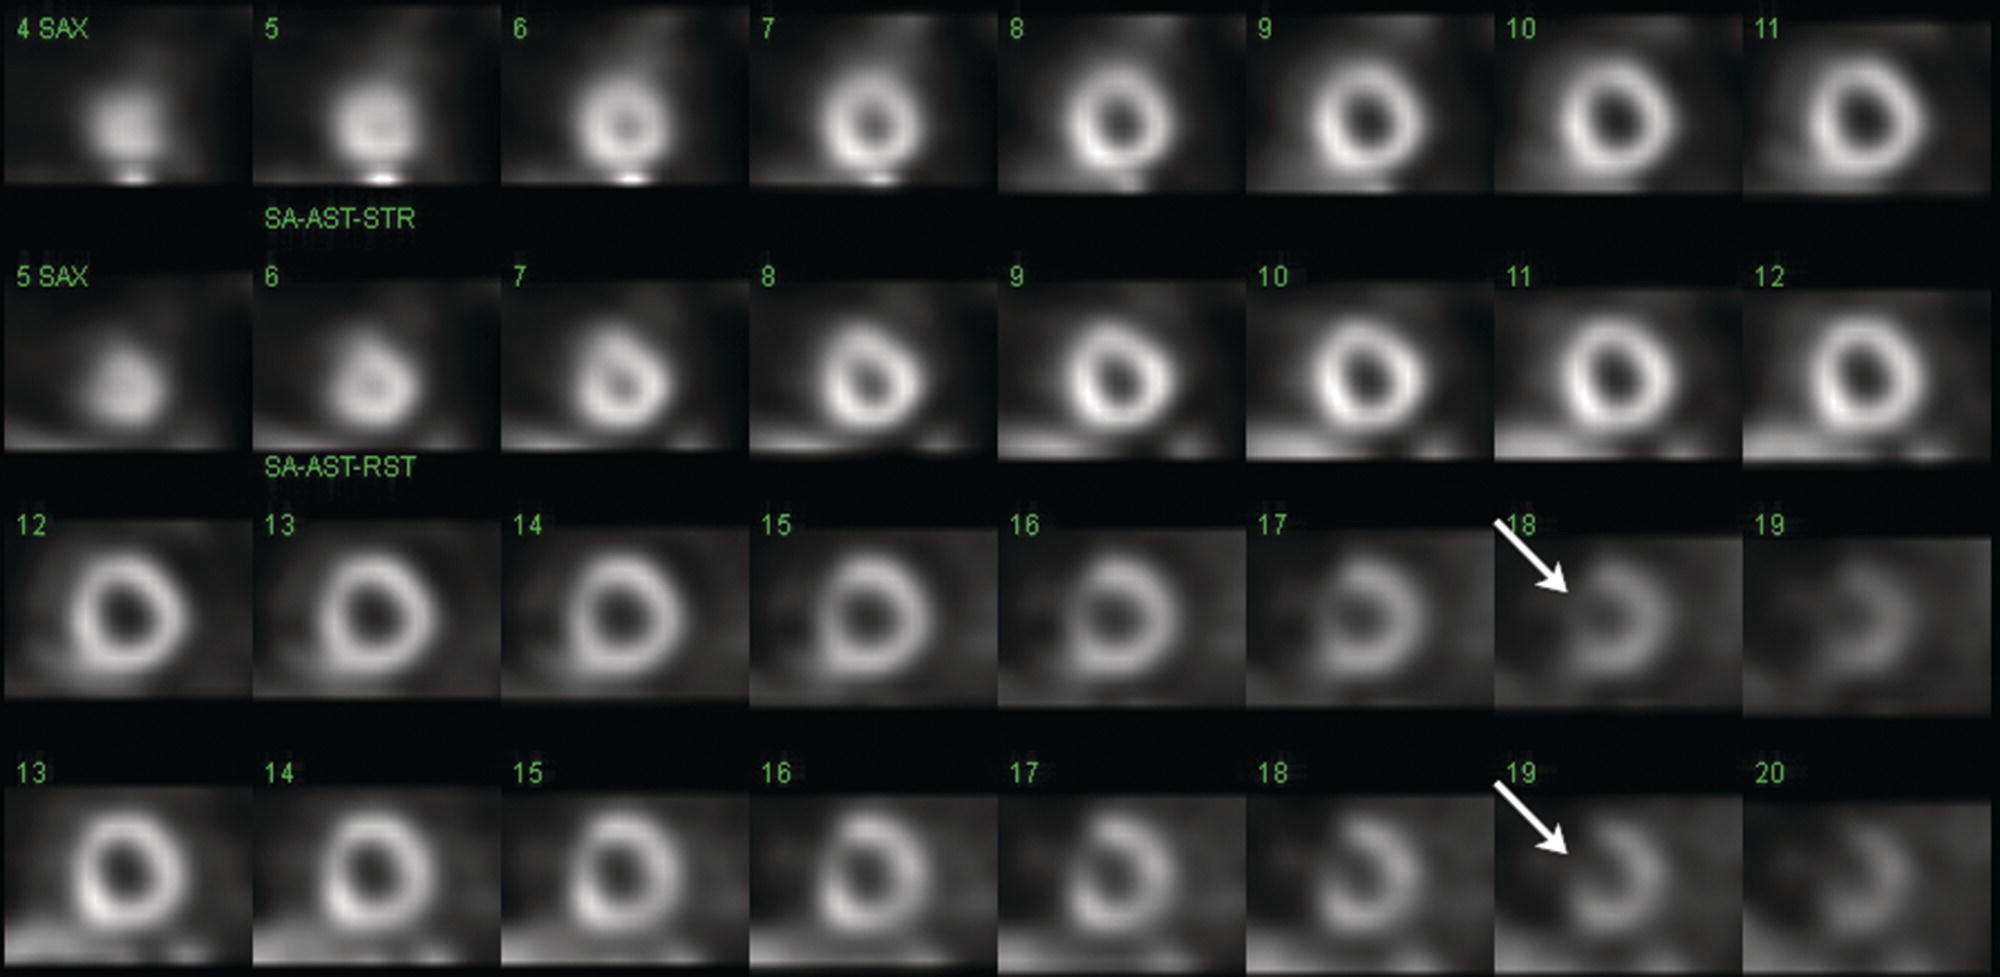
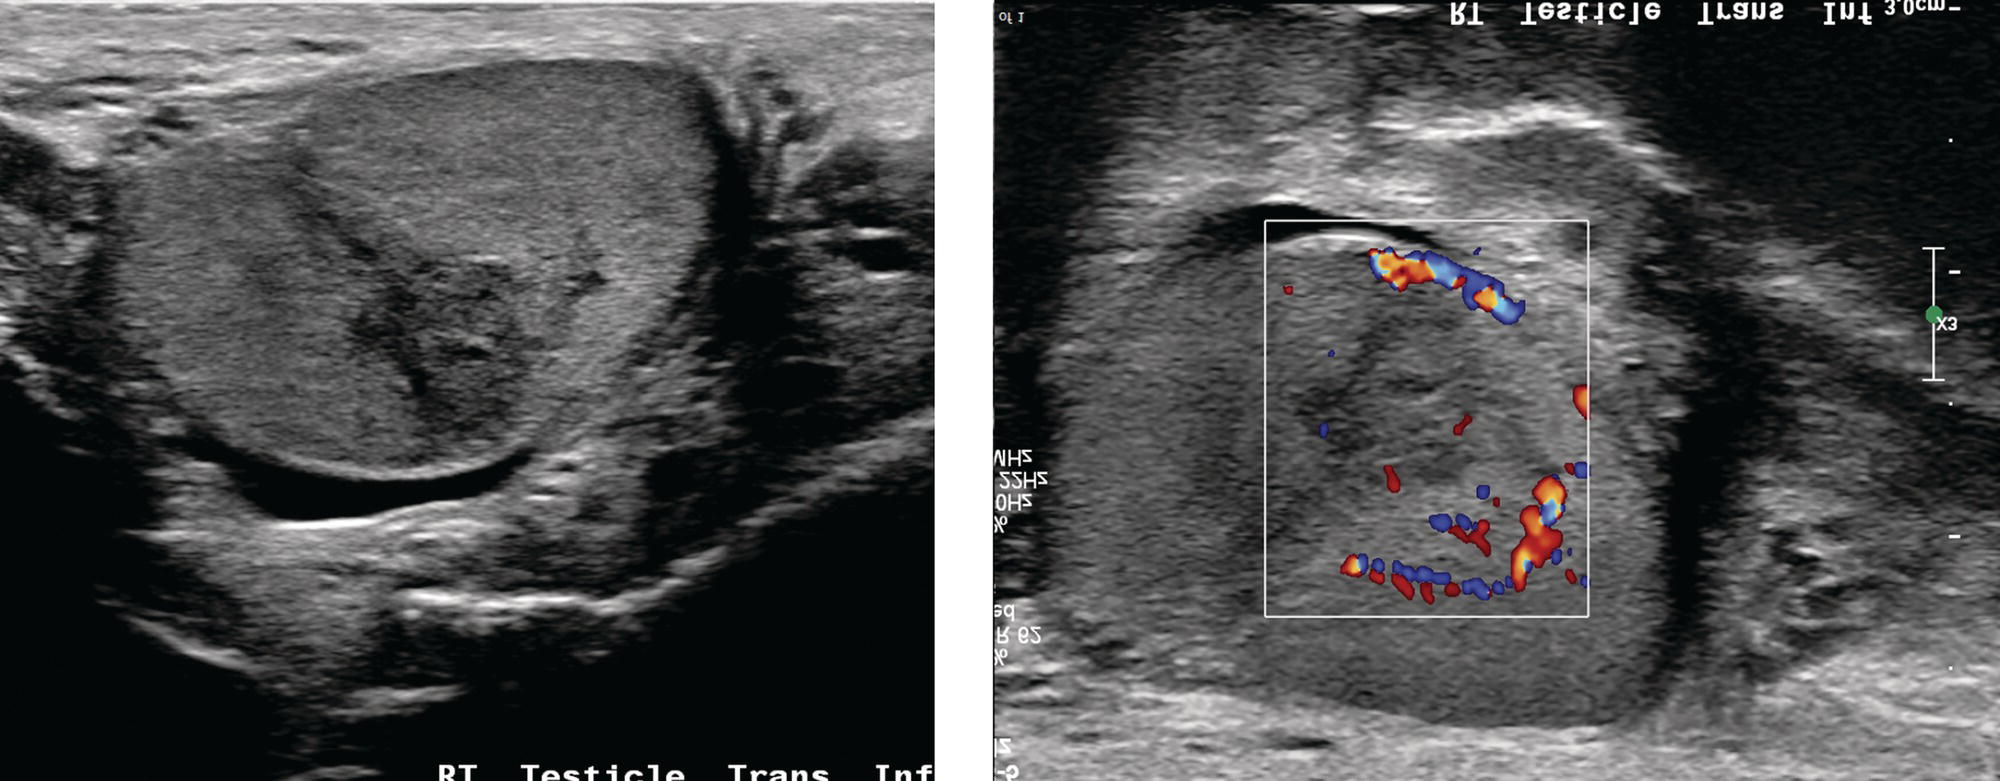
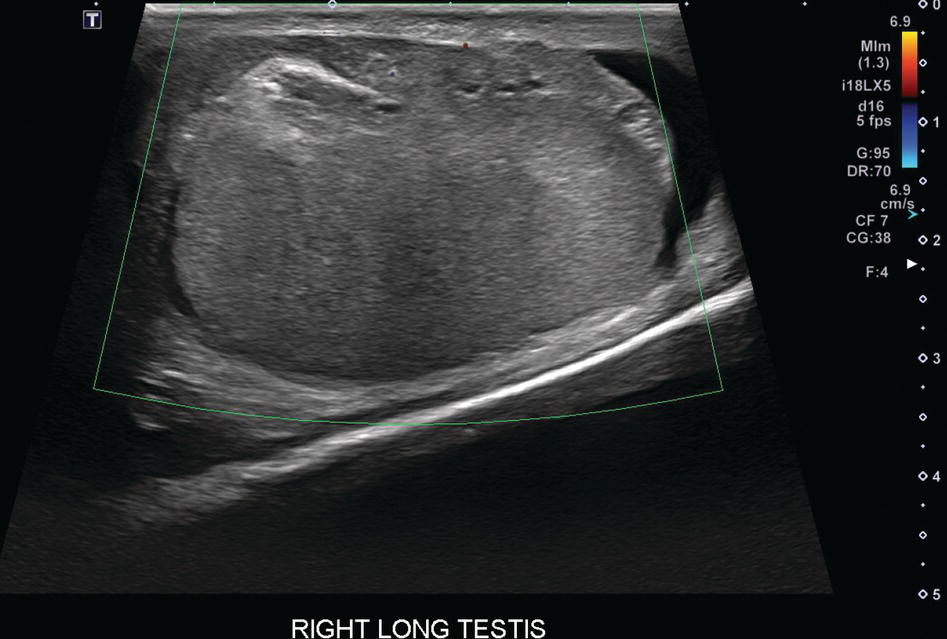
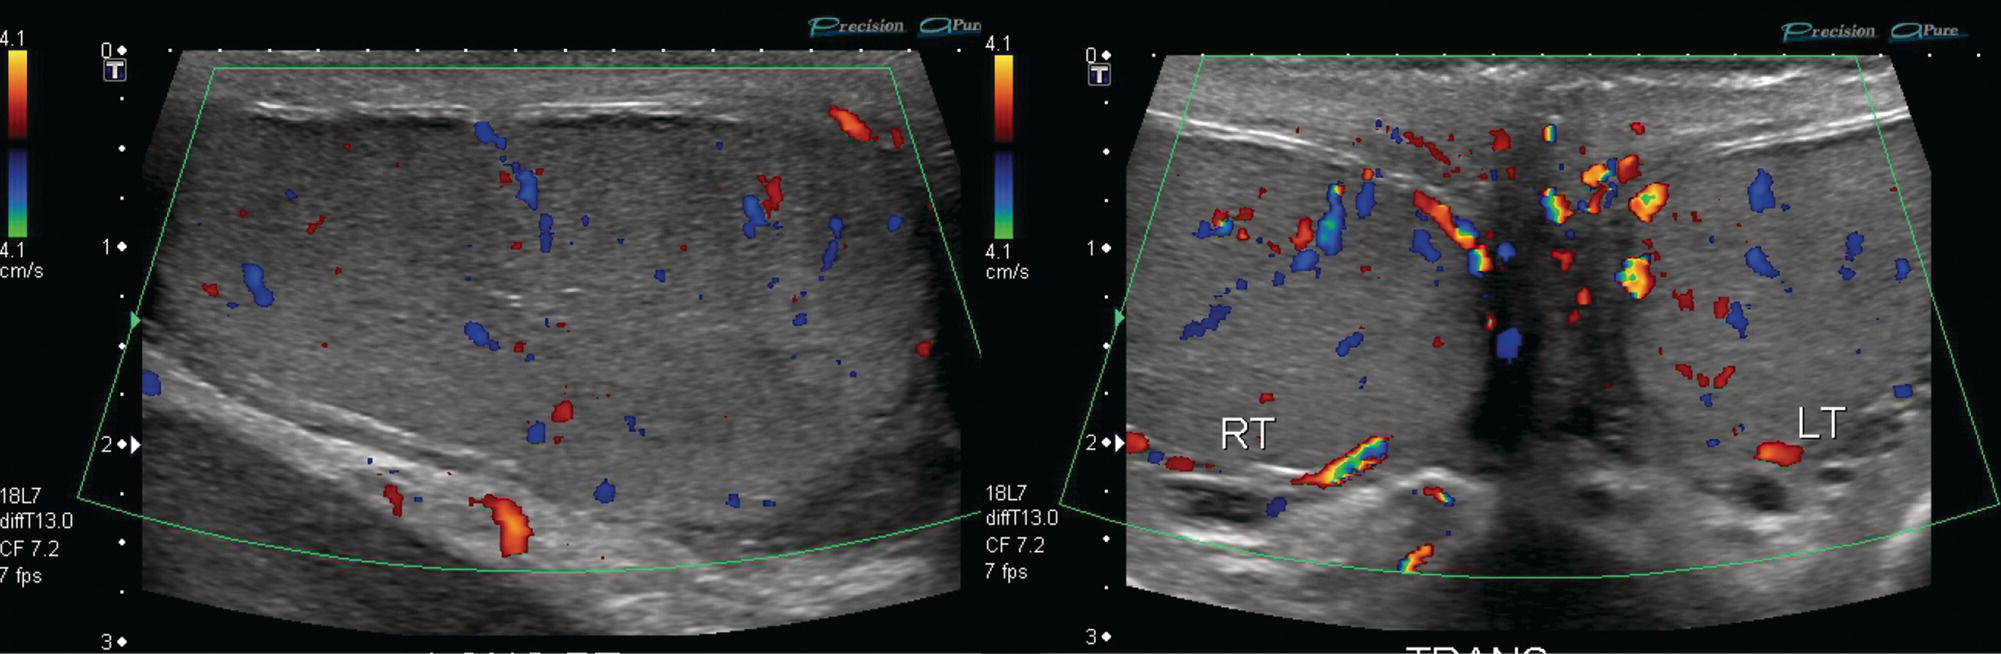
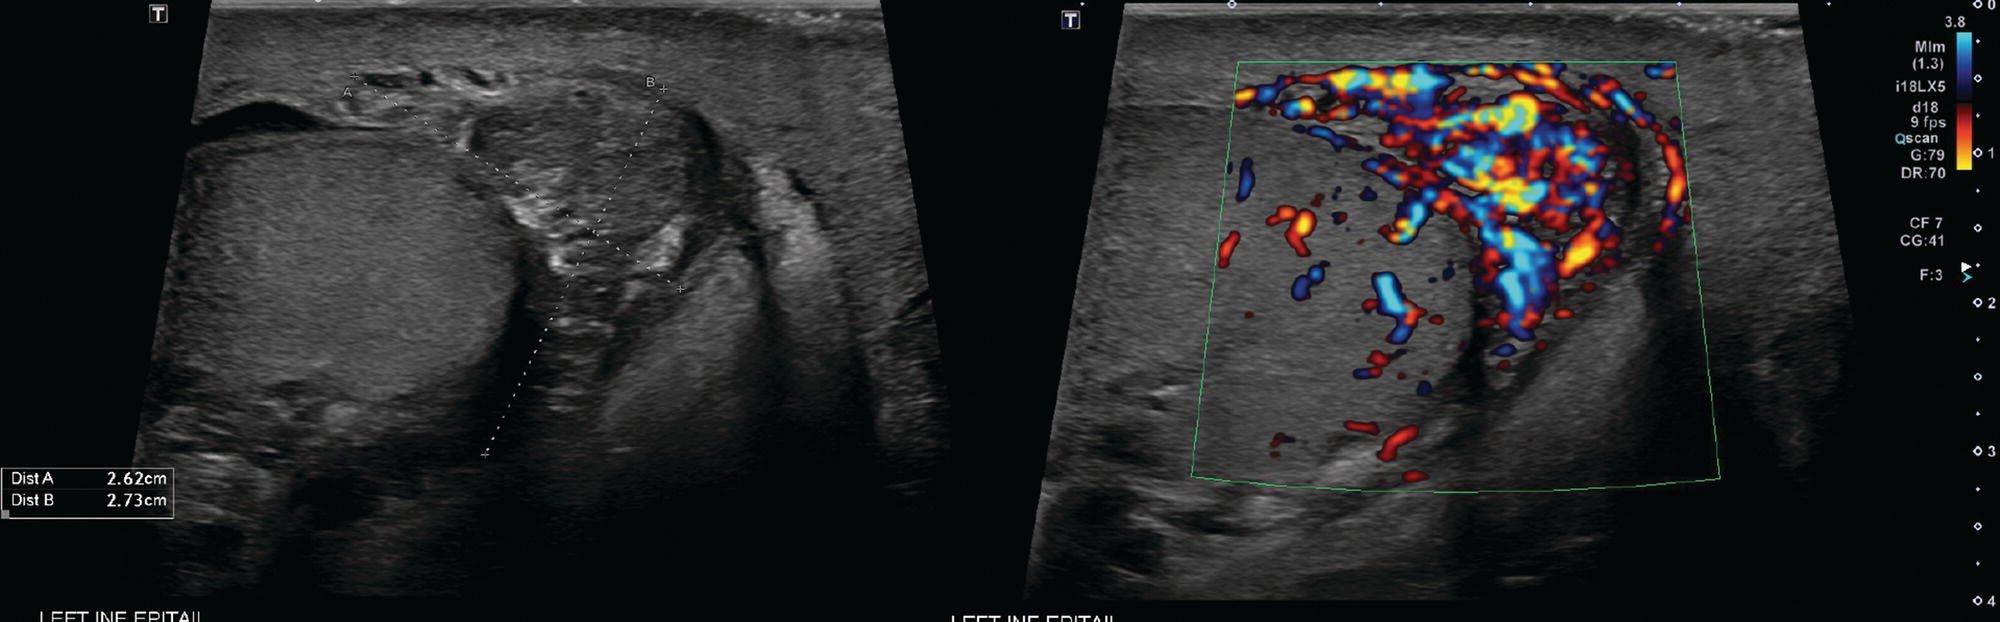
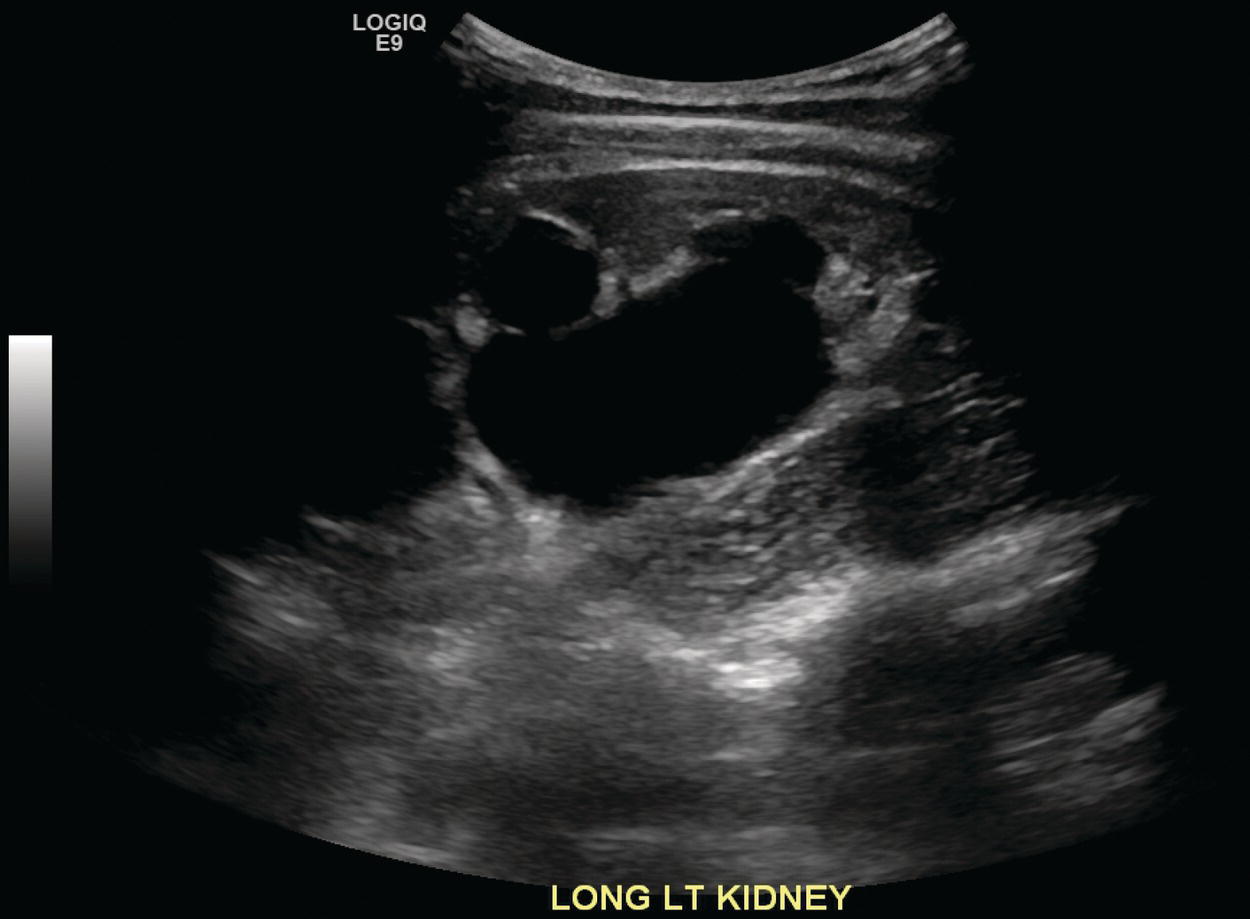
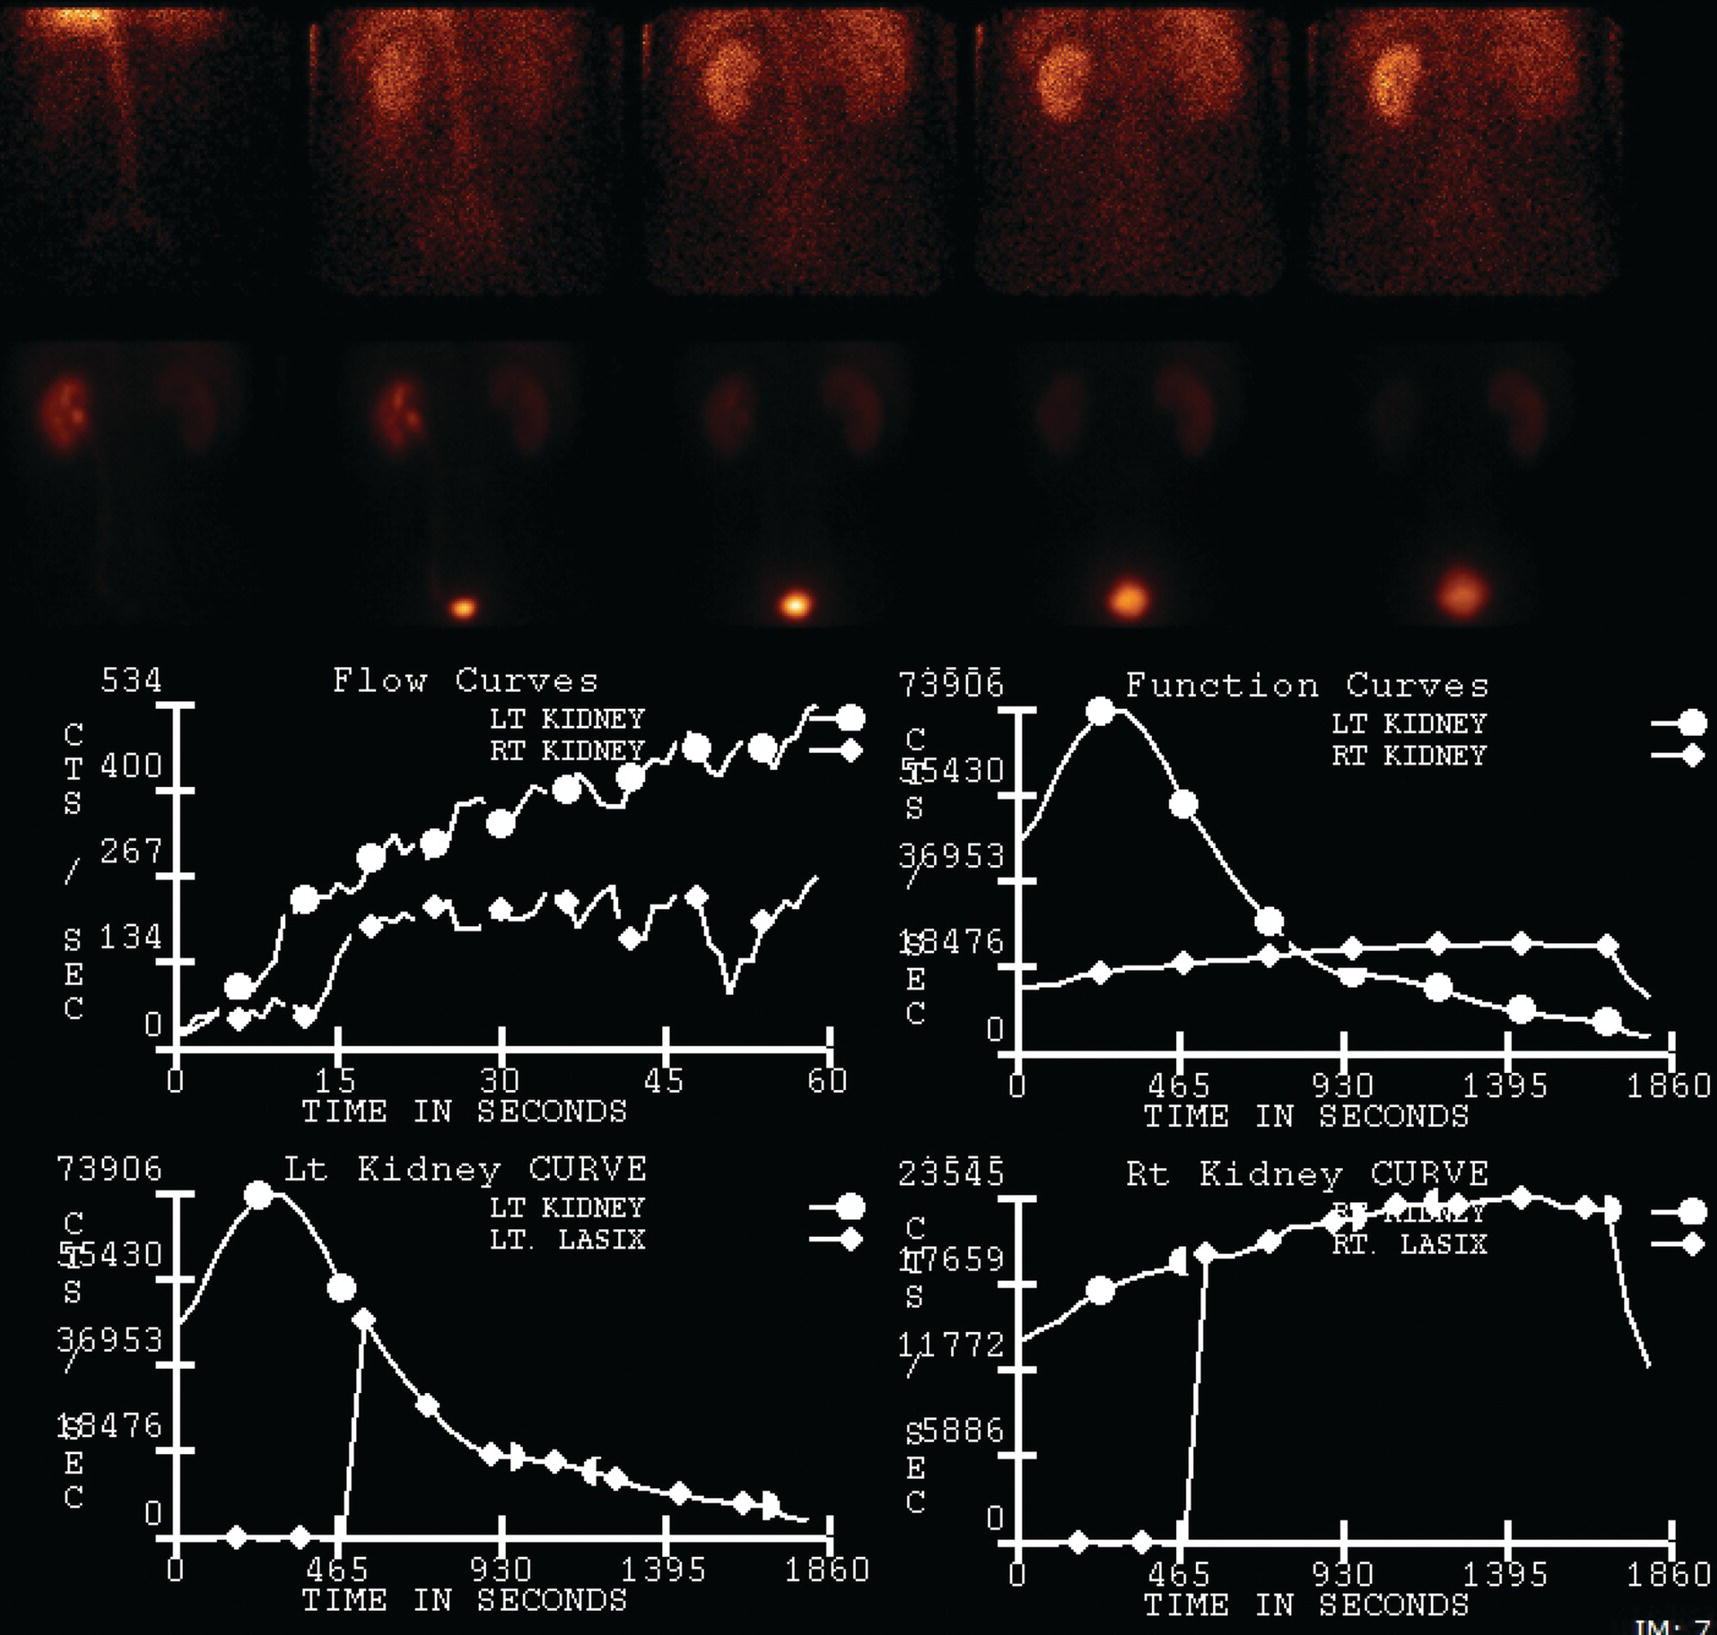
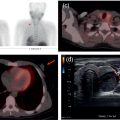
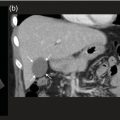
Sean K. Johnston1, Russell Flato2, Peter Hu2, Peter Henry Joyce2, and Andrew Chong2 1 Department of Radiology, Division of Emergency Radiology, Keck School of Medicine of USC, LAC+USC Medical Center, Los Angeles, CA, USA 2 Department of Radiology, Keck School of Medicine, University of Southern California, Los Angeles, CA, USA The role of nuclear medicine in the emergency setting is varied and has changed a lot in the last few decades. While the increasing use of computed tomography (CT) imaging in the emergency room (ER) has led to a drop in the number of emergency nuclear medicine exams such as ventilation/perfusion (V/Q) or tagged red blood cell (RBC) scans ordered around the country, the usefulness of nuclear medicine in the ER remains. Thus, it is even more important now that we educate our colleagues about the important and vital role nuclear medicine imaging can play in the emergency setting. In this chapter we will review some of the more common nuclear medicine tests utilized in the ER and illustrate how they can be used in a complimentary fashion with more commonly used imaging modalities like CT and ultrasonography (US) as well as common pathologies that are encountered. The different examinations discussed in the chapter are covered in greater detail separately within this book and can be referred to if further detail is needed. Chest pain is the underlying reason for approximately 6.5 million emergency department visits in the United States per year [1]. Acute chest pain necessitates a prompt and thorough evaluation in the acute clinical setting to triage patients based on their risk factors and probability of unstable angina or infarct. Patients with a high likelihood of myocardial ischemia or infarction, as confirmed by positive electrocardiography (EKG) findings and/or serum cardiac enzyme levels, will often proceed immediately to coronary angiography. When there is adequate clinical suspicion but routine diagnostic tests are equivocal, myocardial perfusion imaging is often the next step in evaluation to determine whether a patient needs further workup or can be safely discharged. Myocardial perfusion scintigraphy has been previously shown to accurately predict adverse cardiac outcomes in ER patients presenting with typical angina and nondiagnostic EKG findings [2]. Myocardial perfusion scintigraphy provides a map of regional myocardial perfusion, with ischemia or infarction represented as a “cold” region or perfusion defect on the images. The study is usually limited to the acquisition of only resting (nonstress) images for patients with acute chest pain. The examination is commonly performed using electrocardiographically gated SPECT, while 2D planar imaging is reserved for large patients who exceed weight restrictions on the single‐photon emission computer tomography (SPECT) imaging table. The radiotracer typically used is technetium‐99m sestamibi (99mTc‐MIBI) or 99mTc‐tetrofosmin, although thallium‐201 chloride was used historically and newer agents are becoming available. The radiotracer is optimally injected while the patient is actively experiencing angina symptoms, since radiotracer administration after the resolution of chest pain can decrease diagnostic accuracy. Both 99mTc‐sestamibi and 99mTc‐tetrofosmin can be injected in the ER, and since their pharmacokinetics are such that the radiotracers remain fixed within the myocardium, delayed imaging will reflect perfusion at the time of injection. In a normal study myocardial perfusion rest images will demonstrate uniform radiotracer uptake throughout the left ventricular myocardium (see Figure 24.1). The left ventricle will appear doughnut‐shaped on short‐axis views, and the heart will appear horseshoe or U‐shaped on horizontal and vertical long‐axis views. The myocardium will also normally appear thinner at the apex. The right ventricle will have less uptake given its lesser myocardial mass, and the atria are not visualized. Physiologic lung uptake can also be seen, although increased uptake can be seen in chronic smokers and patients with lung disease and heart failure [3]. Figure 24.1 Normal regadenoson sestamibi perfusion study. 10.4 mCi of 99mTc‐MIBI was administered and rest SPECT images were obtained. Subsequently 0.4 mg of regadenoson was administered intravenously followed by 26.2 mCi of 99mTc‐MIBI and stress SPECT images were obtained. The rest and stress images are identical and normal. Given that only resting myocardial perfusion images are acquired in an acute setting, it is not possible to reliably distinguish between myocardial ischemia and infarction. Nonetheless, important features to note when describing a perfusion abnormality include the size of the defect, severity (subendocardial or transmural), location (i.e. coronary artery territory), and presence of ventricular dilatation or wall motion abnormalities. An abnormality seen on rest‐only scintigraphy has been shown to have sensitivity and specificity of 94% and 83%, respectively, for predicting an adverse cardiac event in the setting of acute angina [4]. In other words, a normal study is highly predictive of a good prognosis. If no abnormality is seen at rest‐only imaging, a complete rest‐stress study may be performed at a later time, after the patient’s acute symptoms have resolved (see Figure 24.2). Figure 24.2 Fixed and reversible defects seen on regadenoson sestamibi perfusion study. 9.8 mCi of 99mTc‐MIBI was administered and rest SPECT images were obtained. Subsequently 0.4 mg regadenoson was administered intravenously followed by 28.4 mCi 99mTc‐MIBI and stress SPECT images were obtained. The stress images are displayed above the rest images. There is a moderate‐sized fixed defect involving the basal inferior and inferolateral wall (red arrows), consistent with infarct. Additionally, there is a moderate‐sized partially reversible defect of moderate intensity involving the inferoapical and inferolateral wall (blue arrows), compatible with peri‐infarct ischemia. Anticipating the potential pitfalls to accurate study interpretation requires an understanding of the distinct imaging artifacts that may be encountered. For example, soft tissue attenuation by large breasts or breast implants can simulate an anterior or lateral myocardial wall defect, whereas adipose tissue in the lateral chest wall of obese patients can similarly produce an apparent lateral wall defect (see Figure 24.3). In addition, an overlying left hemidiaphragm may cause attenuation of the inferior myocardial wall and simulate a defect. A method to resolve suspected diaphragmatic attenuation is to reposition the patient prone and repeat the study, which should produce an increase in measured activity if the apparent defect was due to attenuation. Other factors such as superimposed bowel, liver, or spleen activity can also confound myocardial perfusion findings. Therefore, it is always prudent to review the raw data for any potential source of artifact prior to image interpretation. Myocardial perfusion radiotracers are taken up in all metabolically active tissues within the body, except for the brain. Structures that accumulate radiotracer within the routine field of view include thyroid, salivary glands, liver, gallbladder, kidneys, bowel, and skeletal muscle. It is important to recognize these physiologic uptake patterns, since an “extra” focus of activity may represent a metabolically active tumor, such as a parathyroid adenoma or lung cancer. Clearly, an incidental tumor should not be missed and requires further workup. Acute scrotal pain represents a diagnostic challenge for the clinician, requiring careful evaluation to differentiate testicular torsion from inflammatory etiologies, such as epididymitis. Testicular torsion is a medical emergency affecting 4.5 in 100 000 males younger than 25 years annually [5]. Trauma‐related torsion accounts for only 4–8% of cases [6], while the majority tend to occur spontaneously [7]. One predisposing factor involves faulty attachment of the testis to the scrotal wall, most commonly due to a congenital anomaly called the bell‐clapper deformity, in which the tunica vaginalis completely surrounds the testis, resulting in a testis that is solely attached to the spermatic cord and otherwise able to rotate freely. The viability of the testis depends on the duration of torsion and degree of spermatic cord rotation. Proper diagnosis and treatment is ideally achieved within 6 hours of symptom onset, as the rate of testicular salvage is over 90% in the first 12 hours after symptom onset but falls to 18% after 24 hours [8]. Figure 24.3 Breast attenuation. SPECT images from a regadenoson sestamibi perfusion study show a mild central area of hypoactivity within the anteroseptal wall (white arrows) with normal activity distally. This area demonstrates normal wall motion (not pictured) and was attributed to breast attenuation. US has become the main imaging modality for evaluating acute scrotal pain given its widespread availability, ability to be performed quickly, and lack of ionizing radiation. At gray‐scale US, the normal testes appear as ovoid, homogenous structures with medium echogenicity. An echogenic line surrounds each testis, corresponding with the tunica albuginea. In the first few hours of torsion, the testis can appear normal in echogenicity. Over time, the torsed testis may demonstrate increased or decreased echogenicity and a heterogeneous appearance. An enlarged testis with heterogeneous echotexture is suggestive of infarction (see Figure 24.4). Figure 24.4 Testicular infarct. Transverse ultrasound of the right testis shows a wedge‐shaped heterogeneously hypoechoic area extending to the periphery of the right testis. Transverse color Doppler demonstrates diminished vascularity in this area, compatible with infarct. Color Doppler US is a valuable tool to evaluate for ischemia by comparing vascular flow between the normal and affected testes. Complete testicular torsion is demonstrated by the absence of blood flow on the affected side and normal flow on the contralateral side. Less pronounced cases may show asymmetrically decreased flow on the affected side when compared to the normal side. When presented with less definitive findings, it is important to utilize the combination of gray‐scale and Doppler US findings in making the diagnosis (see Figure 24.5). Despite its high diagnostic accuracy, false positives and negatives can occur with gray‐scale and color Doppler US. Technical skill is a limitation, as there is certainly variability based on sonographer experience and equipment. Testicular perfusion can be difficult to detect in prepubertal boys with small volume testes, especially with older US equipment [9]. False negatives can also occur when testicular torsion is mild or intermittent, and there is minimal to no decrease in blood flow at Doppler imaging (see Figure 24.6). Figure 24.5 Testicular torsion. Sagittal color Doppler ultrasound of the right testis shows asymmetric enlargement and heterogeneous echotexture with absent vascular flow, consistent with torsion. Sagittal color Doppler of the left testis demonstrates normal echotexture and vascular flow. Evaluation of acute scrotal pain using scintigraphy was first described by Nadel et al. [10]. The basic premise behind scintigraphy is that a testis which has undergone torsion should have decreased perfusion and demonstrate a “cold” defect on radionuclide scan. Conversely, inflammatory processes, such as epididymitis, should cause hyperemia and exhibit an increased radiotracer uptake “hot” area on imaging. Technetium‐99m sodium pertechnetate is the commonly used radiopharmaceutical agent for scrotal scintigraphy. The typical adult dose is 15 mCi given intravenously, while pediatric patients receive a proportionately smaller dose given differences in body weight [11]. Scrotal scintigraphy can be divided into three phases: early dynamic flow, late dynamic flow, and postdynamic static images. Interpretation requires comparison of the normal and symptomatic sides in a systematic manner. On early dynamic images, flow through the spermatic cord and pudendal vessels is compared with that on the contralateral side, while also comparing cord flow relative to pudendal vessel flow on the symptomatic side. Scrotal wall perfusion is optimally assessed on late dynamic images. Lastly, on static images the appearance of the cord, testis, and epididymis on the normal side is compared with that on the symptomatic side, looking for areas of increased or decreased activity. Scintigraphic findings in testicular torsion can vary based on the degree of ischemia, but generally the findings can be grouped into early, mid phase, and late torsion. In early torsion, relatively increased activity may be seen in the testicular artery proximal to the site of the twist (“nubbin sign”) on dynamic images. On static images, decreased or absent activity may be seen in the region of the affected testis. Figure 24.6 Normal testes after detorsion and orchiopexy. Sagittal color Doppler ultrasound of the right testis and transverse color Doppler of bilateral testes in the same patient as Figure 24.5 show normal echotexture and symmetric blood flow after surgical detorsion and orchiopexy. In the mid phase of torsion, prolonged testicular ischemia leads to infarction, and the scrotal wall subsequently becomes hyperemic. Scintigraphic findings during this stage may demonstrate increased activity in the region of the pudendal vessels and scrotum with relatively decreased or absent activity in the affected testis. This appearance of a “cold” testis with a surrounding halo of increased activity becomes more prominent in late torsion. In the late phase of torsion, persistent ischemia leads to increasing pudendal flow and scrotal hyperemia. As one would expect, the intensity of scrotal activity surrounding the ischemic/infarcted testis increases further. Other causes of acute scrotal pain should be entertained when the imaging findings are equivocal or inconsistent with testicular torsion, such as inflammatory disease and torsion of the appendix testis. Scrotal inflammatory disease, most commonly epididymitis and epididymo‐orchitis, classically shows enlargement of the affected structures on gray‐scale US and asymmetric hyperemia on color Doppler [12] (see Figure 24.7). Scintigraphy may show increased activity in the spermatic cord vessels on dynamic phase images, as well as increased activity in the epididymitis in addition to the testis (in epididymo‐orchitis) on static images. Torsion of the appendix testis classically reveals a round, hyperechoic or mixed echogenicity mass at the upper pole of the epididymis without internal vascular flow [13]. Reactive hypervascularity in the adjacent epididymis and scrotal wall may be seen at color Doppler US. Scintigraphic findings are usually normal or sometimes may show a focal area of increased activity above the testis on static images. Both Doppler sonography and scintigraphy are valuable techniques for evaluating acute scrotal pain, with reported accuracies around 88% and 95%, respectively [14]. Rather than taking a standalone approach, supplementing both imaging modalities can be advantageous in reducing their respective limitations. For example, scintigraphy may detect a photopenic defect overlying the testis caused by a large hydrocele, leading to an incorrect diagnosis of testicular torsion [15]. By correlating with sonography, which would readily visualize a large hydrocele, a potentially false‐positive scintigraphic scan can be avoided. Ultimately, the goal is to correctly identify patients needing urgent surgical intervention while avoiding unnecessary surgery. While US and CT have emerged as the preferred imaging modalities for evaluation of renal anatomy, the use of renal scintigraphy in the acute clinical setting is typically reserved for functional analysis. The most common acute indications for radionuclide renal imaging include urinary tract obstruction, urine leak, and vascular compromise. Renal scintigraphy can be particularly valuable when urgent interventions are being considered, such as percutaneous nephrostomy, ureteral stent placement, or surgery. US is often the initial imaging modality used to assess the urinary system, given its lack of ionizing radiation and ability to be performed at the patient’s bedside. The renal collecting system appears as anechoic spaces that conform to the expected shape of the renal calyces and pelvis [16]. On US, hydronephrosis is defined by dilatation of the collecting system to varying degrees (see Figure 24.8). Mild cases can be identified by modest distention of the renal pelvis and calyces without parenchymal atrophy. Moderate hydronephrosis is demonstrated by progressive dilatation of the renal collecting system with blunting and flattening of the renal calyces and papillae, respectively; slight cortical thinning may also be present. Finally, severe hydronephrosis can be identified by marked dilatation or a balloon appearance of the renal pelvis and calyces with loss of their intervening borders; cortical thinning is also usually seen. Once hydronephrosis is identified, further investigation should be performed to reveal the underlying cause, such as stones, ureteropelvic junction (UPJ) obstruction, or malignancy. Figure 24.7 Epididymitis. Sagittal ultrasound of the left testicle and epididymis shows enlargement of the left epididymal tail. Sagittal color Doppler of the left epididymal tail demonstrates markedly increased flow, consistent with focal epididymitis. Figure 24.8 Severe hydronephrosis. Sagittal grayscale ultrasound of the kidney shows marked dilatation of the collecting system and cortical thinning, consistent with severe hydronephrosis. Alternatively, unenhanced CT may be performed for suspected obstruction caused by renal or ureteral stones. The sensitivity and specificity of unenhanced CT for detecting ureteral calculi has been shown to be around 95–96% and 98%, respectively [17]. CT images frequently reveal varying degrees of hydronephrosis and/or hydroureter upstream of the obstructing calculus, which can be anywhere along the urinary tract. Most stones are radiopaque and commonly contain calcium, although they will vary in density based on their composition. Of note, protease inhibitor (indinavir) stones and other radiolucent stones are usually undetectable on unenhanced CT. Magnetic resonance imaging (MRI) is rarely performed for renal evaluation in the acute setting but may be considered on subsequent workup on a case‐by‐case basis. While US and CT can provide good visualization of renal anatomy, they are not well‐suited for functional analysis. Therefore, renal scintigraphy can be performed for functional evaluation of urinary tract obstruction [18]. Diuretic renal scintigraphy has become a key diagnostic test to help differentiate obstructive hydronephrosis from a nonobstructive cause of collecting system dilatation. The most commonly used radiopharmaceutical agent is technetium‐99m mertiatide (99mTc‐MAG3). Since 99mTc‐MAG3 is cleared primarily by tubular secretion (95%) with minimal glomerular filtration (<5%), its clearance can be used to measure effective renal blood flow, and it can be used in patients with renal insufficiency. Technetium‐99m diethylenetriamine pentaacetic acid (99mTc‐DTPA) is an alternative agent which is excreted via glomerular filtration. Because its renal extraction from plasma is directly dependent on the glomerular filtration rate, 99mTc‐DTPA is limited to use in patients with normal to mildly impaired renal function. After intravenous administration of 10 mCi of 99mTc‐MAG3 (or 99mTc‐DTPA), standard renal perfusion and functional imaging techniques are performed. The diuretic agent (furosemide) is usually given 15–20 minutes after radiotracer injection, once real‐time visual inspection confirms that the collecting systems are full or the renogram curve is near its peak. Response to furosemide is usually seen within 5 minutes after injection, with maximal diuresis achieved after 15 minutes. Regions of interest are drawn over the kidneys, and a renogram washout curve is created by plotting radiotracer activity over time. The normal renogram curve has three phases: a sharp upslope representing renal perfusion, a defined peak representing cortical function, and a rapid downslope representing renal clearance. Additionally, a half‐time excretion for diuretic renography is often calculated from the time of diuretic injection, whereby a half‐time of less than 10–15 minutes is considered a normal response [3]. In the setting of urinary tract obstruction, the renogram curve may show continuously rising radiotracer activity that persists despite diuretic administration. Urine flow is therefore impeded or obstructed at some point along the urinary tract. In addition, a half‐time excretion of more than 20 minutes is considered abnormal and can provide further evidence of obstruction (see Figure 24.9). A nonobstructive cause of hydronephrosis may similarly show a rising time–activity curve prior to diuretic administration, which can initially mimic a true mechanical obstruction. However, furosemide administration causes an increase in urine flow through the collecting system, which washes out the initial pooling of radiotracer activity and allows for drainage of radiotracer from the kidney (and produces a downslope on the renogram curve). It is important to be aware of common conditions which can lead to false‐positive or indeterminate findings of obstruction. For instance, dehydration and poor underlying renal function can both lead to a diminished diuretic response. Bladder distention or noncompliance can result in high filling pressures, which impairs washout from the upper urinary tract. Also, a nonobstructive but severely dilated collecting system can contain a large volume of urine (and accumulated radiotracer activity), resulting in a reservoir effect (see Figure 24.10).
24
Emergency Radiology
Emergency Imaging
Myocardial Perfusion Imaging
Testicular Torsion
Ultrasonography
Scintigraphy
Renal Scintigraphy
Urinary Tract Obstruction
Related posts:
 Nephro‐urinary Tract Pathologies: A Correlative Imaging Approach
 Lymphoma and Myeloma Correlative Imaging
 Imaging in Gliomas: Clinical Principles and Synergies with MRI
 Osteoporosis: Diagnostic Imaging and Value of Multimodality Approach in Differentiating Benign Versus Pathologic Compression Fractures
 A Correlative Approach to Breast Imaging
 Imaging of Pediatric Diseases
![]()
Stay updated, free articles. Join our Telegram channel

Full access? Get Clinical Tree


