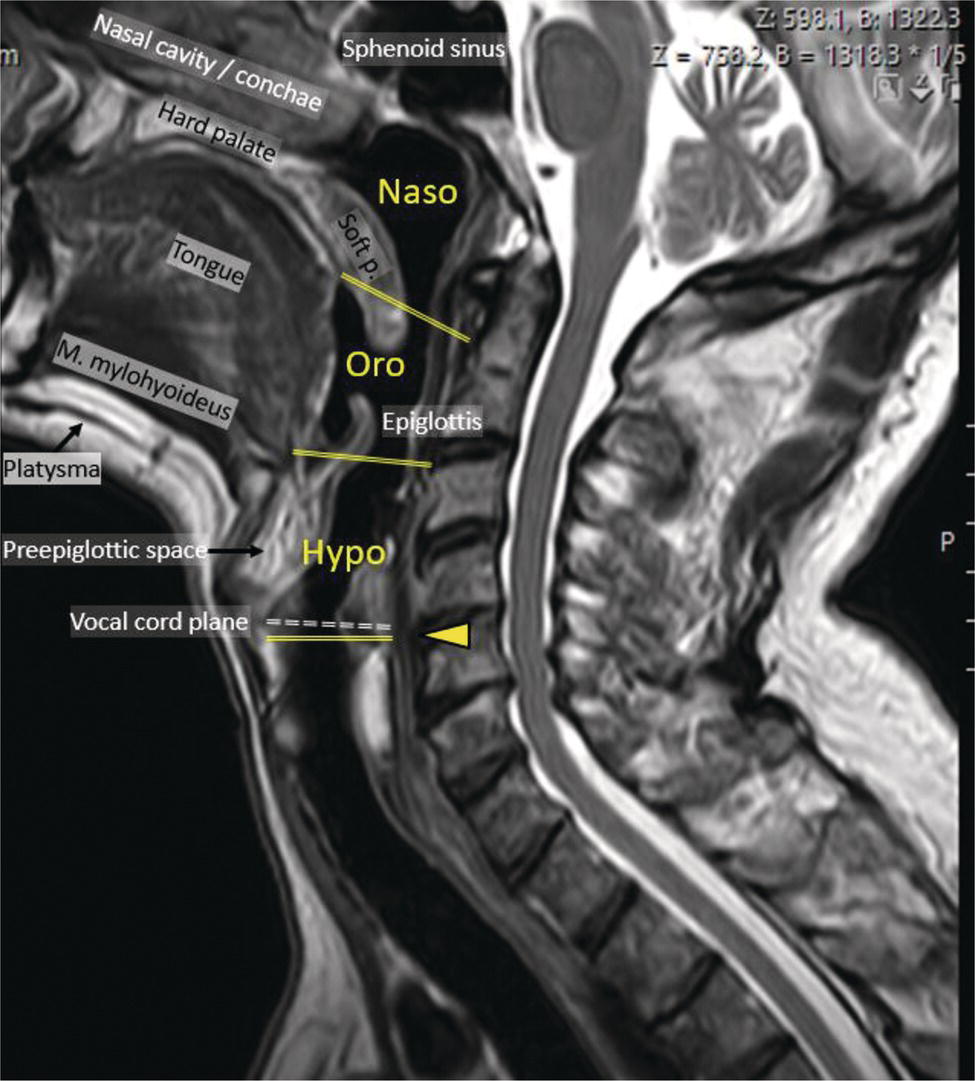
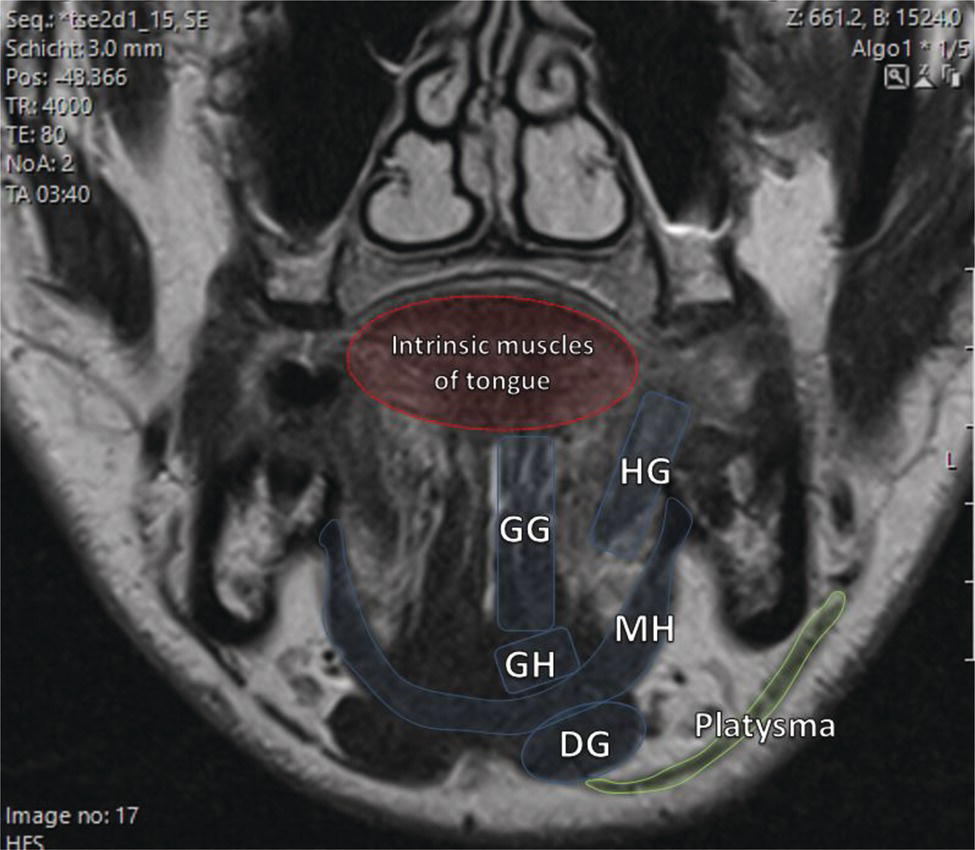
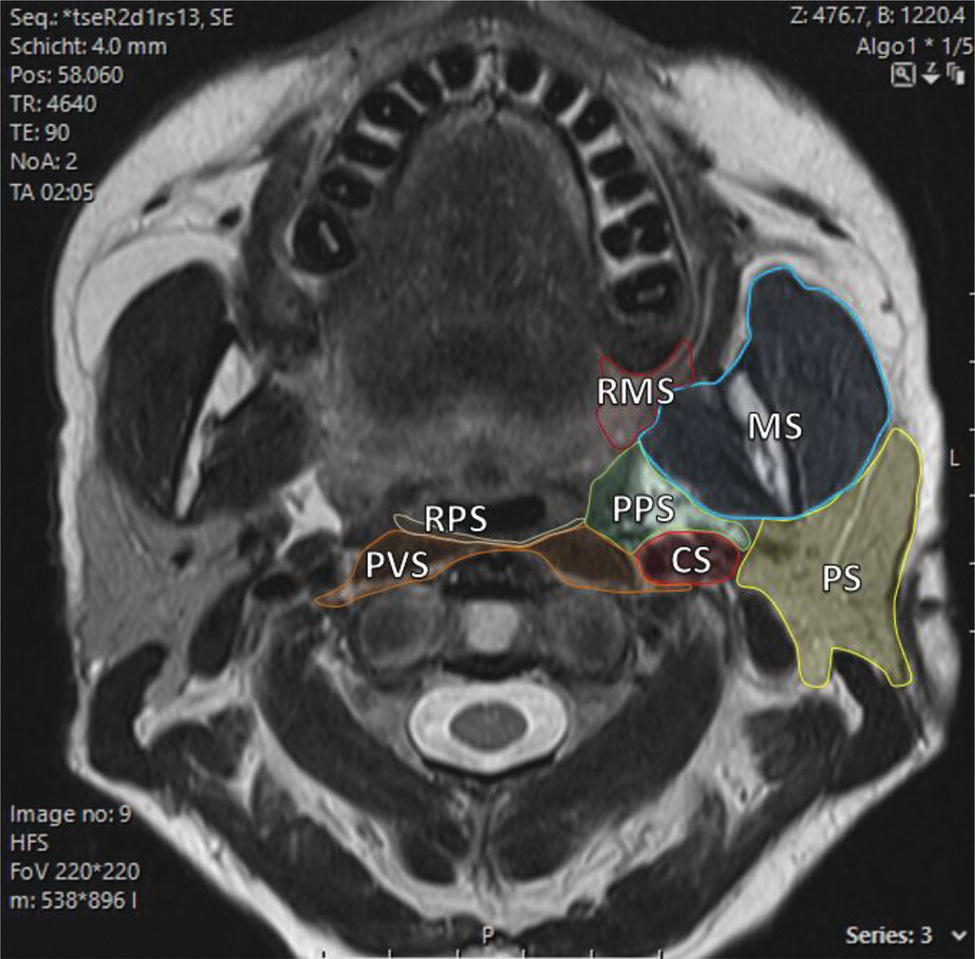
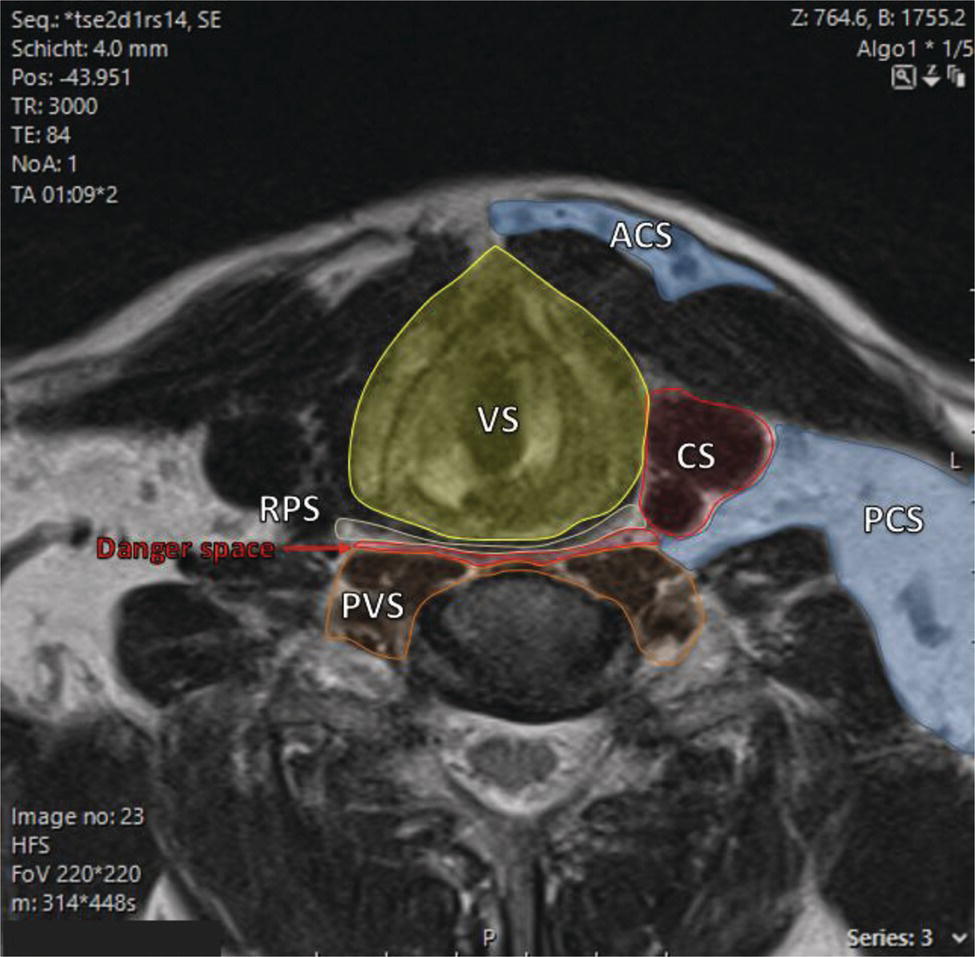
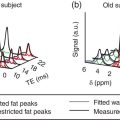
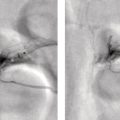
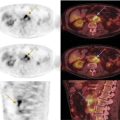
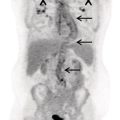
Florian Dammann1 and Jan Wartenberg2 1 Department of Diagnostic, Interventional and Pediatric Radiology, Inselspital, University Hospital Bern, Switzerland 2 Department of Nuclear Medicine, Inselspital, University Hospital Bern, Switzerland The pharynx is divided into three sections (Figure 7.1): nasopharynx, oropharynx, and hypopharynx. The nasopharynx (or epipharynx) is the most superior portion that extends superiorly to the skull base, anteriorly to the back part of the nasal septum and the nares, and inferiorly to the level of the soft palate. The oropharynx includes the pharyngeal wall inferior of the soft palate, the tonsillar glands, and the tongue base (Figure 7.2). It is connected to the hypopharynx at the level of the pharyngoepiglottic fold. The hypopharynx extends laterally of the larynx, including the piriform recess, and is connected to the upper esophageal sphincter. The larynx is a part of the upper respiratory tract and connects the hypopharynx to the trachea. It is built by a cartilaginous skeleton, muscles, and mucosal membranes, including the vocal cord. Fasciae and other organs separate the soft tissue structures of the neck into spaces. These spaces are clinically relevant because they may channel the spread of inflammatory or malignant diseases, or may help in the differential diagnosis of unknown pathologies. Usually suprahyoid spaces are divided from infrahyoid spaces, but some spaces cross the hyoid bone (Figures 7.3 and 7.4). As an example with clinical importance, the “danger space” is a space located between the retropharyngeal space and the prevertebral space. It extends continuously from the skull base to the mediastinum and the diaphragm. Consequently, infectious diseases that originate in the neck and involve the danger zone can easily spread caudally into the thorax (Figure 7.4). Imaging of the head–neck area is frequently affected by artifacts, which are caused by Anatomical conditions of the head–neck may have an impact on field homogeneity in magnetic resonance imaging (MRI). Field homogeneity is frequently impaired by the irregular nonrounded shape of the head and neck area, the pronounced changes of body shape along the long axis of the body, and large proportions of air and bone in the examination field. As a consequence, fat saturation techniques as well as diffusion weighted imaging (DWI) may be impaired. Dental metal artifacts including amalgam fillings, implants, and other nonremovable dentures also may affect the field homogeneity in MRI resulting in signal extinction, distortion of anatomical geometry, and impairment of fat saturation technique as well as DWI with possible involvement of an area much larger than the dental metal itself (Figure 7.5). Computed tomography (CT) imaging may also be impaired by superimposing dental metal artifacts (Figure 7.6). In contrast to MRI, metal artifacts in CT are limited to the axial scan plane level of the metal. Patient positioning with pronounced reclination of the head may allow the relevant anatomical area to be moved and avoid superimposing metal artifacts (Figure 7.7). In patients with extensive dental metal applications, positron emission tomography (PET) may provide accurate tumor staging and volume measurement compared to CT or MRI, leading to improved preoperative planning [1] (Figure 7.6). However, dental metal may also affect attenuation‐corrected PET images and may also affect measurements of standardized uptake values (SUVs) [2]. In conclusion, a combined interpretation of PET‐CT and MRI helps to avoid false‐negative readings [3] (Figure 7.8). Figure 7.1 Anatomy of head–neck spaces. Naso, nasopharynx; Oro, oropharynx; Hypo, hypopharynx; arrowhead, superior esophagus sphincter. Magnetic resonance imaging sagittal T2 weighted image. Figure 7.2 Tongue muscles. Red area, intrinsic muscles of the tongue; blue areas, extrinsic tongue muscles; GG, genioglossus muscle; HG, hyoglossus muscle; GH, geniohyoid muscle; MH, mylohyoid muscle; DG, digastric muscle (anterior belly). Magnetic resonance imaging coronal TSE T2 weighted image. Disease‐related artifacts typically include swallowing artifacts (Figure 7.9), as tumors of the neck as well as treatment effects frequently induce an increased urge to swallow, especially when salivation is reduced or increased due to the disease or the therapy. Swallowing artifacts mainly affects the accuracy of anatomical evaluation of imaging diagnosis. Patient positioning in supine position may also be challenging for the patient due to disease‐related or cervical spine pathologies with reduced ability of cooperation and may result in motion artifacts of the entire head–neck (Figure 7.10). Figure 7.3 Suprahyoid spaces. RMS, retromaxillary (at the level of mandible: “retromolar”) space; MS, masticator space; PS, parotid space; CS, carotid space; PPS, parapharyngeal space; PVS, prevertebral space; RPS, retropharyngeal space. Magnetic resonance imaging axial TSE T2 weighted image. Figure 7.4 Infrahyoid spaces. ACS, anterior cervical space; PCS, posterior cervical space; VS, visceral space; CS, carotid space; PVS, prevertebral space; RPS, retropharyngeal space. Magnetic resonance imaging axial TSE T2 weighted image. However, the effect of any of these conditions on diagnostic image quality is very individual and cannot be predicted on theoretical considerations. In any case, a diagnostic procedure should be attempted once the correct indication for the specific diagnostic procedure is validated. Figure 7.5 Dental metal artifacts in MRI: in this case tumor evaluation is not affected. Extensive dental prosthesis of the upper and lower jaw with implants and curved titanium supraconstruction (e) impairs diagnostic quality limited to the site of the prosthesis at the anterior oral cavity (a–d). At the level of the laryngeal carcinoma no relevant image distortion is present (f–h). In (f) SWOP artifacts of the Dixon imaging due to dental metal effects can be observed anteriorly at the level of the subcutaneous fat tissue that appears as a sharply bordered bright area. (a) MRI TSE T2. (b, f) MRI TSE T1 fatsat +CM. (c, g) MRI STIR T2. (d, h) MRI T1 vibe +CM MPR. (e) Orthopantomogram. Figure 7.6 Dental metal artifacts in PET‐CT: tumor evaluation is not affected. Same patient as in Figure 7.5. (a, f) CT. (b, e) Fluorodeoxyglucose (FDG) PET‐CT fusion image. (c) FDG PET. (d) Orthopantomogram. Figure 7.7 The diagnostic effect of dental artifacts depends on the degree of head reclination. (a–c) Whole‐body CT for initial evaluation of newly observed and fast‐growing cervical lymph nodes. No superimposition of dental metal artifacts in the CT slice at the level of tonsillar gland [slice position of (b) corresponding to yellow line in topogram (a)] due to head resting in the reclined position. However, the primary tumor of the right tonsillar gland (arrow) was not detected in this examination due to insufficient conspicuity, but multiple cervical lymph nodes with central necrosis indicating metastatic disease are clearly visible (arrowhead). (d–f) FDG PET‐CT 3 days later. (e) CT and (f) PET‐CT fused images at the level of the primary tumor [slice position corresponding to the yellow line in topogram (d)]. In CT the tumor is completely masked by superimposing dental metal artifacts due to a more prone position of the head in this examination compared to the whole‐body CT (b). In contrast, FDG‐PET is unaffected by dental metal and shows clearly the primary tumor (arrow) as well as metastatic lymph nodes (arrowhead). Figure 7.8 Reciprocal compensation of artifacts and complementary information by PET‐CT and MRI in a patient with recurrent tumor and lymph node metastases. Recurrent tumor (open arrow) is detected by MRI (d), but missed by FDG PET‐CT (a–c) due to superimposing dental metal artifacts. In contrast, lymph node metastasis (arrow) is depicted by FDG‐PET with a high conspicuity (e, f), but is hardly visible in CT (g), whereas MRI only shows unspecific findings (h). (a, e) FDG PET‐CT fusion images. (b, f) FDG PET. (c, g) CT + CM as a part of PET‐CT. (d, f) MRI TSE T1 fatsat + CM. Figure 7.9 Swallowing artifacts. SCC of the laryngeal face of epiglottis (arrow) is best seen in CT (b) due to nodular thickening of the epiglottis, but does not show FDG accumulation (a) and is hardly visible in MRI (c) due to swallowing artifacts. Ipsilateral large lymph node metastasis at level II (asterisk) with infiltration of the sternocleidomastoid muscle and the skin with clinically apparent ulceration (arrowhead) is clearly diagnosed by all three modalities. (a) FDG PET‐CT fusion image. (b) CT without CM as part of PET‐CT. (c) MRI TSE T1 fatsat + CM. Figure 7.10 Severe cervical spine kyphoscoliosis (a) does not allow standard imaging planes to be applied in this 81‐year‐old patient. However, diagnostic imaging is not impaired significantly. All relevant diagnostic information for classification of this left‐sided submandibular lesion (asterisk) is available: typical malignant pattern including pathological FDG accumulation (b), irregular contrast enhancement (d), and pathologic DWI (e), the exact localization of the lesion, preserved contours of the adjacent mandibular bone without evidence of bone infiltration (c–e), and the identification of a tiny fat space [arrow in (d, e)] separating the tumor from the left submandibular gland. Based on these findings the initial clinical diagnosis of a submandibular gland carcinoma was revised and changed to diagnosis of a lymph node metastasis without primary tumor (CUP). (a) CT scout image. (b) FDG PET‐CT fusion image. (c) MRI STIR T2 coronal plane. (d) MRI TSE T1 fatsat + CM. (e) MRI DWI b = 800. MRI techniques deliver very robust image quality and show clearly the primary tumor (arrow) as well as cervical lymph node metastases (arrowhead) (Figure 7.11). TSE T1 wi (a) looks unaffected, but (a) shows the “fat” not the “water” image, so Dixon imaging characteristics swapped completely due to dental metal material. In DWI (b, c) a complete signal loss is observed in the oral cavity and oropharynx due to dental metal effects. As a consequence, the primary tumor is not visible, and also lymph node evaluation is limited on the ADC maps (arrowheads). Figure 7.11 Impact of dental metal on different MRI techniques. Same patient as Figure 7.7. Dental metal materials do not affect T2 weighted images with or without inversion recovery fatsat (d–f). (a) TSE T1 + CM with Dixon fatsat. (b) DWI b = 800. (c) ADC map. (d) TSE T2. (e, f) STIR T2. Most diseases of the head and neck show clinical evidence in a relatively early stage of disease due to the early impairment of physiological function, including breathing, chewing, swallowing, smelling, or tasting. Most pathologies are located superficially and can easily be assessed by clinical examination. As a consequence, diagnostic imaging modalities should focus on the evaluation of the extent of pathologies into deep spaces and on the detection of pathologies that are confined to deep spaces that are not accessible to clinical examination, or when clinical examination fails to explain clinical symptoms of a patient. As an example, small tumors at a T1 stage that are located at the level of the mucosa can easily be diagnosed by clinical examination, but can be missed by CT, MRI, or PET imaging. In contrast, these imaging modalities are superior to clinical examination in the evaluation of the extent of large tumors, the potential infiltration of a tumor into adjacent organs as bone, cartilage, vessels, or nerves, or the detection of lymph node metastasis in deep areas. In conclusion, clinical examination and imaging modalities provide complementary information in the diagnosis of head and neck diseases. Most malignant tumors of the head and neck are squamous cell carcinoma (SCC). In contrast, adenoid cystic carcinoma (ACC) is a relatively rare tumor, mostly arising from the salivary glands or the adenoid tissue of the Waldeyer’s ring. Despite the relatively low incidence, ACC has a special clinical significance: ACC frequently shows perineural tumor spread. As a consequence, complete surgical removal of the tumor is challenging and loco regional tumor recurrence is frequent [4]. Malignant diseases of the nasal cavity and paranasal sinuses account for 3–5% of all malignant head and neck tumors. SCC is the most frequent tumor entity (Figure 7.12). A minor part of about 10% is constituted by melanoma, lymphoma, esthesioblastoma, and other less frequent tumors (Figure 7.13). Men are twice as likely to be affected as women. Main age of tumor manifestation is the sixth and seventh decades. Main causes of malignant diseases of the paranasal sinuses include nicotine and alcohol abuse, like most head and neck carcinomas, but also chronic exposition of toxic dust containing nickel, tannine, or chrome pigments in the context of occupational diseases. As malignant disease of the nasal cavity and paranasal sinuses is frequently accompanied by chronic inflammatory or allergic disease, and different malignant diseases show very similar characteristics, differential diagnosis is a challenge for clinical examination as well as for imaging modalities. However, complementary functional and anatomical diagnostic information facilitates the final diagnosis, especially in this area. Figure 7.12 SCC of the left nasal cavity and paranasal sinuses. (a–c) Tumor (asterisk) extension to the left pterygoid fossa (arrow) with infiltration of the masticator space, clearly shown by all modalities. (d–f) Subtle arrosion of the medial orbital wall (arrow) indicating initial infiltration. This anatomical detail was missed in PET due to the limited anatomical resolution, but is depicted by CT and MRI by an interruption of the signal‐free osseous lamina. (g–i) Infiltration of the maxillary bone (arrow) is clearly demonstrated by all three modalities due to destruction of high density bone in CT (g), tumor mass with intermediate signal intensity replacing signal‐free maxillary bone (h), and high FDG accumulation of the left maxillary bone compared to the normal right side (i).(a, i) FDG PET‐CT fusion image. (b) CT + CM. (c, f) MRI TSE T1 fatsat + CM. (d, g) CT without CM. (h) MRI TSE T1 without CM. Figure 7.13 Sinonasal melanoma. Paranasal surgery for chronic sinusitis resulted incidentally in the diagnosis of a sinonasal melanoma with involvement of the right ethmoid and sphenoid sinuses. In MRI, malignant tissue (arrows) typically shows low signal intensity in T2wi (a) and a less pronounced contrast enhancement (b) compared to the adjacent mucosa. Low signal intensity without contrast enhancement of a central postoperative defect [asterisk in (b)]. Coronal MRI (c) depicts preserved bony lamellae of the medial orbital wall (long arrows) and the cribriform plate (short arrow). Asterisk marks retained mucus in ethmoidal cells due to tumor obstruction. FDG PET‐CT confirms the extent and localization of the malignant tumor with involvement of the ethmoid (thin arrows in d) and the sphenoid sinus (thick arrow), as well as the preservation of the bony border of the medial orbital wall [thin arrows in (f)]. (a) MRI TSE T2. (b) MRI TSE T1 fatsat + CM. (c) MRI TSE T1 without CM, coronal plane. (d) FDG PET‐CT fusion image. (e) FDG PET. (f) CT axial slice, bone kernel, and window. The majority (over 80%) of salivary gland tumors occur in the parotid gland. Most parotid tumors are benign, including pleomorphic adenoma, which is the most important benign tumor. In contrast, about 50% of minor salivary gland tumors are malignant. SCC is the most frequent malignant tumor found within the parotid gland (Figure 7.14). In the majority of cases it is a metastasis of a primary skin or head and neck malignancy [5]. Histopathology of primary salivary gland malignancies is very complex and diverse, including adenoid cystic, mucoepidermoid, and anaplastic carcinoma. The SUVs of FDG are significantly higher in most malignant tumors than in benign tumors. However, few benign tumors, such as Whartin tumors, may show high SUVs, whereas some malignant salivary gland tumors, including adenoid cystic carcinomas, low‐grade mucoepidermoid carcinoma, or necrotic SCC, may not have significant FDG avidity [3]. FDG PET‐CT is not able to improve the differentiation of benign from malignant salivary gland lesions when compared to MRI. However, PET‐CT is advantageous in primary staging and in detection of distant metastases and synchronous cancers [6]. Figure 7.14 SCC (asterisk) extending within the deep and superficial lobe of the left parotid gland (a–c). The tumor infiltrates medially the deep parapharyngeal space and laterally the adjacent sternocleidomastoid muscle [open arrow in (b, c)]. In contrast, the cortical bone of the ramus mandibulae is preserved [arrowhead in (d, f)], excluding bone infiltration. Both tonsillar glands show marked FDG accumulation [arrows in (a)] and slightly asymmetrically pronounced left tonsillar gland [arrow in (e)]. Considering the marked bilateral tonsillar calcifications (arrows in d) and lack of contrast enhancement [arrows in (f)], the finding was classified as chronic inflammatory disease. However, subsequent tonsillectomy revealed a pT1 SCC of the left tonsillar gland as primary tumor. Consequently, the parotid malignancy was classified as a lymph node metastasis of the tonsillar SCC. (a, e) FDG PET‐CT fusion image. (b, d) CT + CM as part of the PET‐CT. (c, f) MRI GRE T1 + CM. The incidence of nasopharynx malignancies is much lower compared to oropharynx or hypopharynx tumors in most western societies, but a higher incidence is reported in South‐East Asia and northern Africa. The most frequent histologic entity of nasopharynx malignancies is SCC (Figure 7.15), less frequent are ACC (Figure 7.16) and lymphoepithelial carcinoma (Schmincke–Regaud tumor). The latter has a frequent association with Epstein–Barr virus (EBV) and is highly sensitive for radiation therapy. At the time of diagnosis, nasopharynx malignancies have frequently reached an advanced stage because early tumor stages are often nonsymptomatic. In advanced tumor stages, tumor infiltration of the base of the skull may cause headache or cranial nerve malfunctions. Lymph node metastases of nasopharyngeal tumors frequently involve the retropharyngeal and bilateral cervical space. Perineural tumor extension into intracranial spaces is a typical complication of advanced tumor stages (Figures 7.16 and 7.17). Imaging diagnosis is of highest importance because perineural tumor spread is difficult to diagnose by clinical examination, but has a high clinical relevance. This includes decreased survival as well as higher risk of local recurrence and metastatic disease. The trigeminal and facial nerves are the most frequently affected nerves by perineural tumor spread [7, 8]. MRI is the established gold standard in assessment of perineural tumor spread [8], whereas the role of FDG PET‐CT remains to be evaluated [7, 8]. Figure 7.15 Nonkeratinizing EBV positive nasopharyngeal carcinoma (NPC) with bone infiltration and bilateral lymph node metastases. (a–c) FDG PET clearly demonstrates the localization and extent of the clinically detected tumor (arrow), whereas CT and MRI did not show any pathologic soft tissue mass at the nasopharynx. However, with knowledge of a pathologic FDG accumulation at the anterior surface of the clivus [arrow in (e)], a subtle bone arrosion can be discovered in CT as well as in MRI at that site with contrast enhancement [arrow in (f–h)]. Resuming all imaging information the diagnosis of a tumor infiltration into the bone was made, resulting in a cT3 stage of the tumor. Bilateral lymph node metastases were clearly diagnosed by all three modalities [asterisks in (d)]. (a, e) FDG PET‐CT fusion image. (b) CT + CM. (f, h) High‐resolution CT multiplanar reformations. (c, g) MRI T1 vibe + CM axial reformations. (d) MRI T1 vibe + CM coronal reformation. Figure 7.16 Adenoid‐cystic carcinoma of the nasopharynx (asterisk) without significant FDG accumulation in this case. Perineural extension to the skull base (arrow). (a, b) Only minor FDG accumulation at the anterior and the posterior face of the tumor (arrowheads). (c) The tumor is visible in CT as an asymmetric space occupying soft tissue lesion, but tumor margins are not clearly delimited. (d, e) In this case MRI is the modality of choice to diagnose tumor extent, including perineural spread into the skull base (arrow) and secondary complications including an effusion of the left‐sided mastoid cells due to tumor obstruction (open arrow). (a) FDG PET attenuation corrected image. (b) FDG‐PET CT fusion image. (c) CT + CM. (d) MRI TSE T1 fatsat + CM axial slice. (e) MRI TSE T1 fatsat + CM coronal slice. Figure 7.17 Perineural tumor extension of nasopharyngeal SCC. (a–c) Nasopharyngeal SCC predominantly on the right side, but with continuous infiltration of both sides (arrowheads). Detailed evaluation of tumor extension is easy on MRI and PET, but is limited on CT due to the minor soft tissue contrast. (d–f) Perineural tumor growths into the skull base through the foramen lacerum on the right side (arrow) clearly recognizable on MRI and PET. (a, f) MRI TSE T1 fatsat + CM axial plane. (b, f) FDG‐PET CT fusion images. (c) CT + CM. (e) MRI TSE T1 fatsat + CM coronal plane. The incidence of oropharyngeal carcinoma amounts to up to 2/100,000 population. Men are affected three to four times more often than women. Histology is mostly SCC, less frequent adenocarcinoma or others. Due to different patterns of tumor spread and lymphatic drainage, tonsillar carcinomas (Figure 7.18) are differentiated from tumors of the anterior or posterior palate arch, the soft palate, and the tongue base. Exogenous noxes, including alcohol abuse, smoking, and chewing tobacco, play an important role in tumor genesis, as in all tumors of the upper aerodigestive tract. However, in the past decade the most common cause of oropharyngeal SCC has shifted to the human papillomavirus (HPV). HPV p16‐related oropharyngeal SCC have a significantly better response to treatment and improved prognosis compared to tobacco‐related SCC [9]. This circumstance has led to major adjustments in the 8th edition of the Staging Manual of the UICC [10]. Clinical symptoms depend on tumor site and size. Tumors of tonsils and tongue ground may remain without clinical symptoms up to advanced tumor stages, and lymph node metastases may be the initial finding in those cases.
7
Diseases of the Head and Neck
Anatomy
Cross‐sectional Imaging
Artifacts
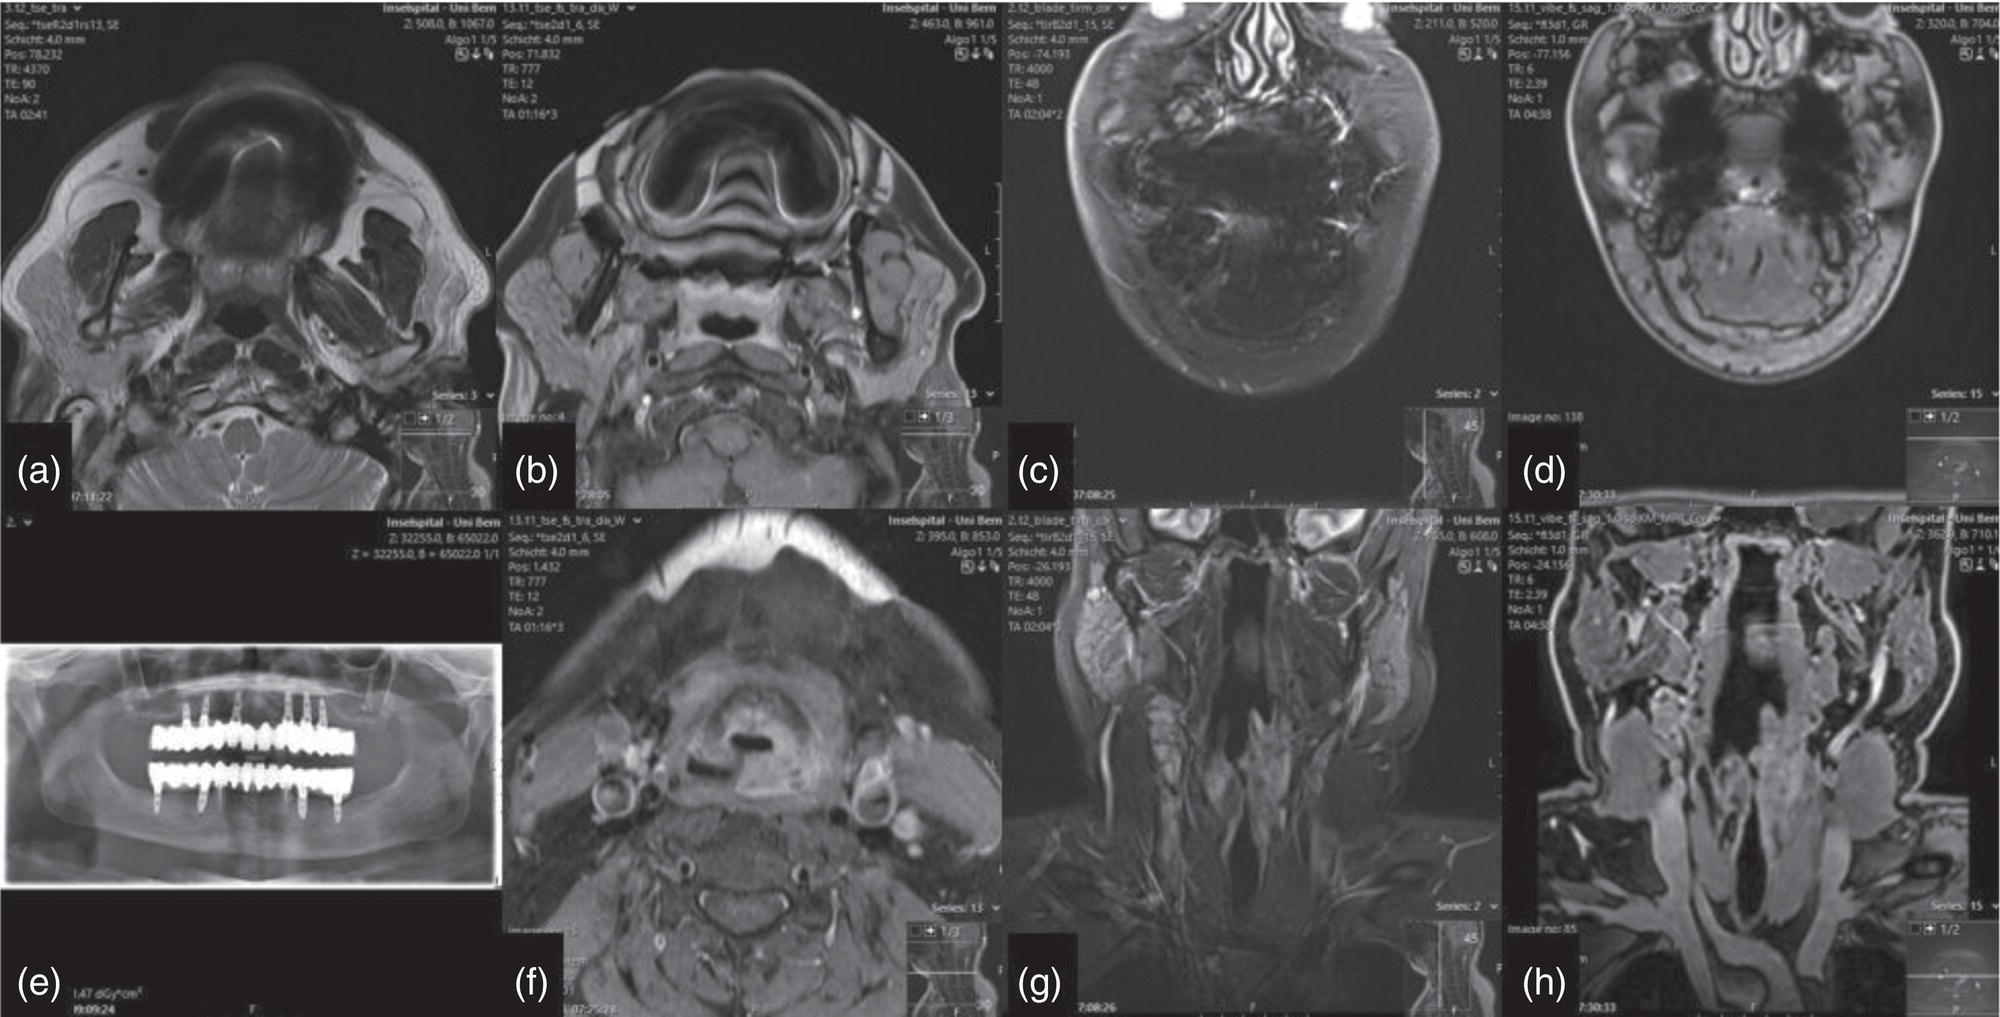
Dental Metal Artifacts in MRI: Tumor Evaluation Not Affected
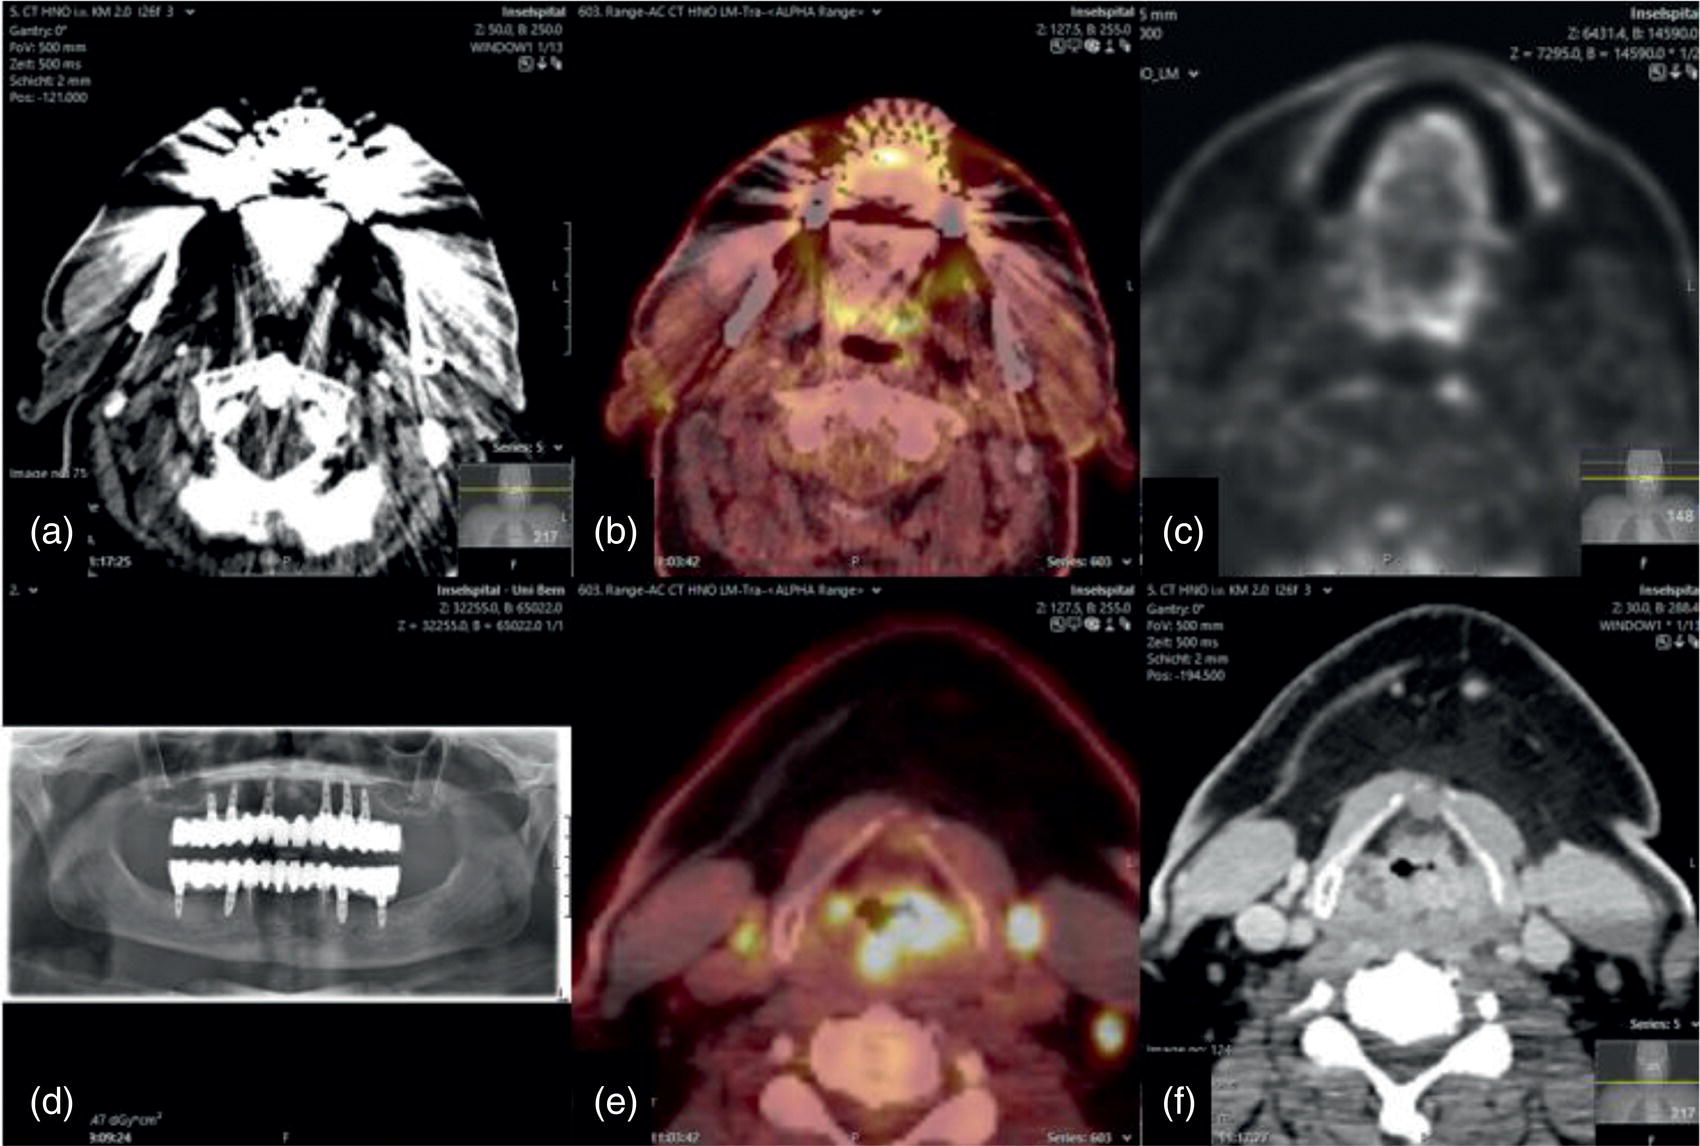
Dental Metal Artifacts in PET‐CT: Tumor Evaluation Not Affected
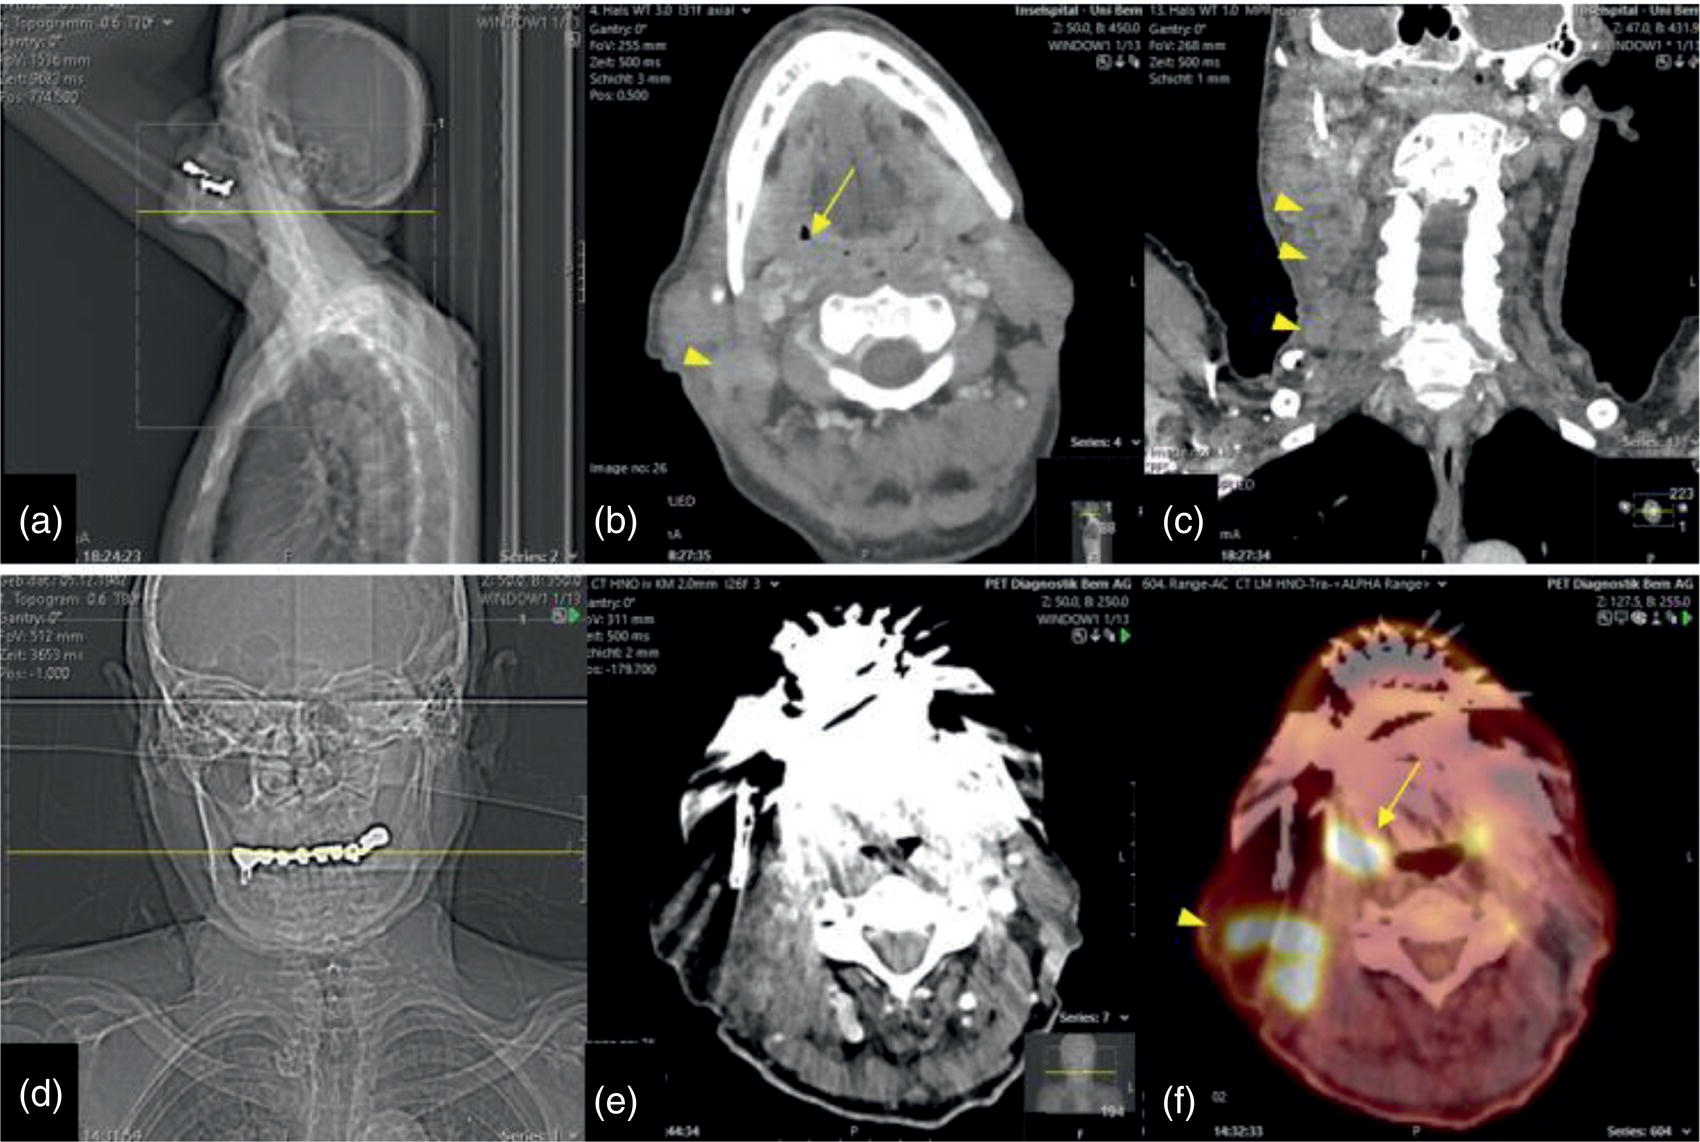
Dental Artifacts Effect Depends on Degree of Head Reclination
Complementary Information by PET‐CT and MRI
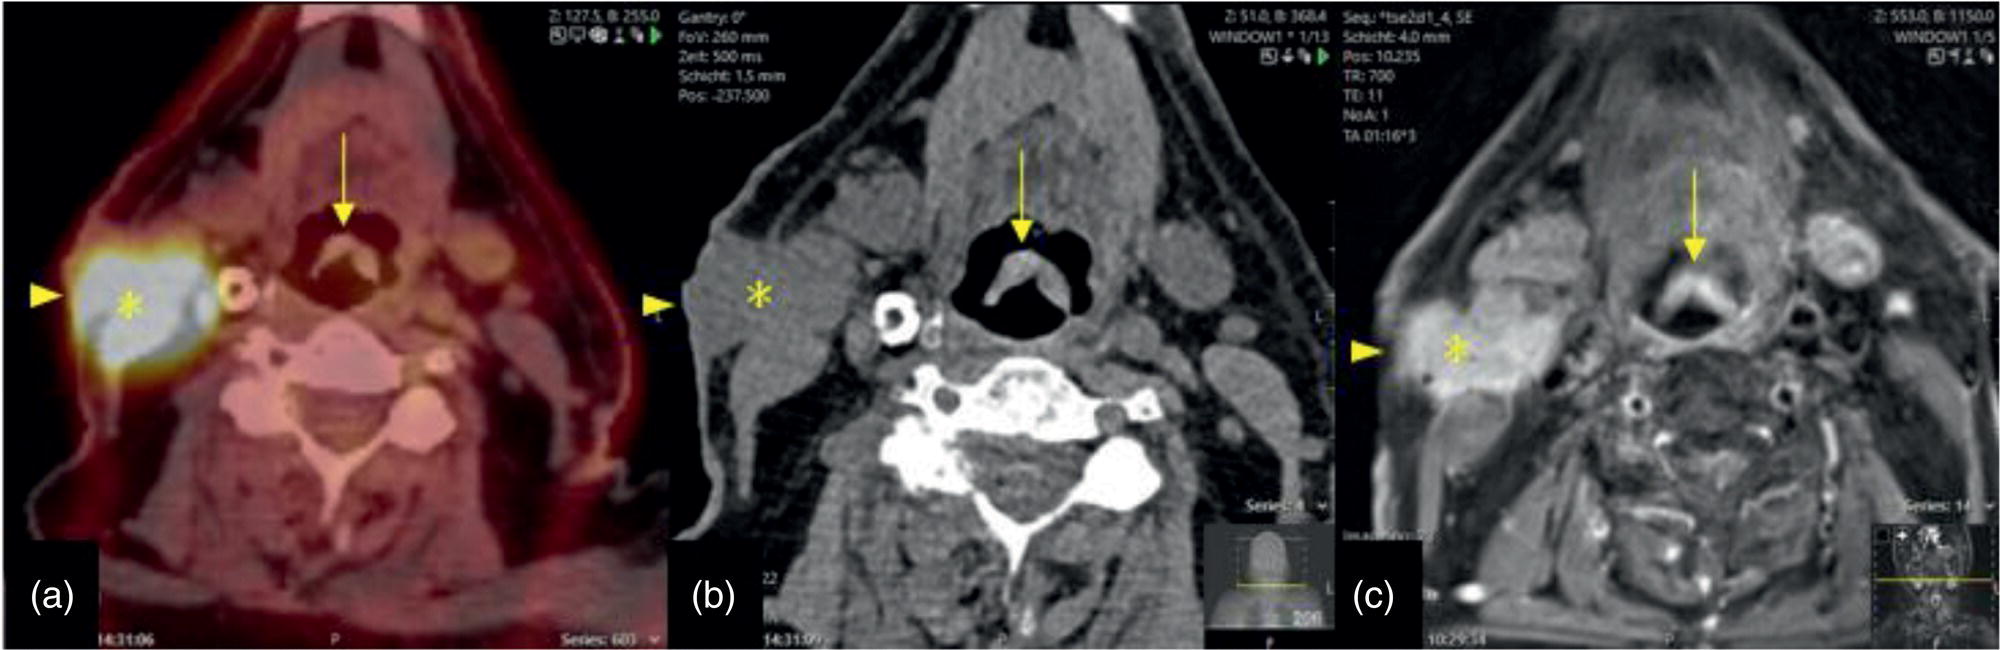
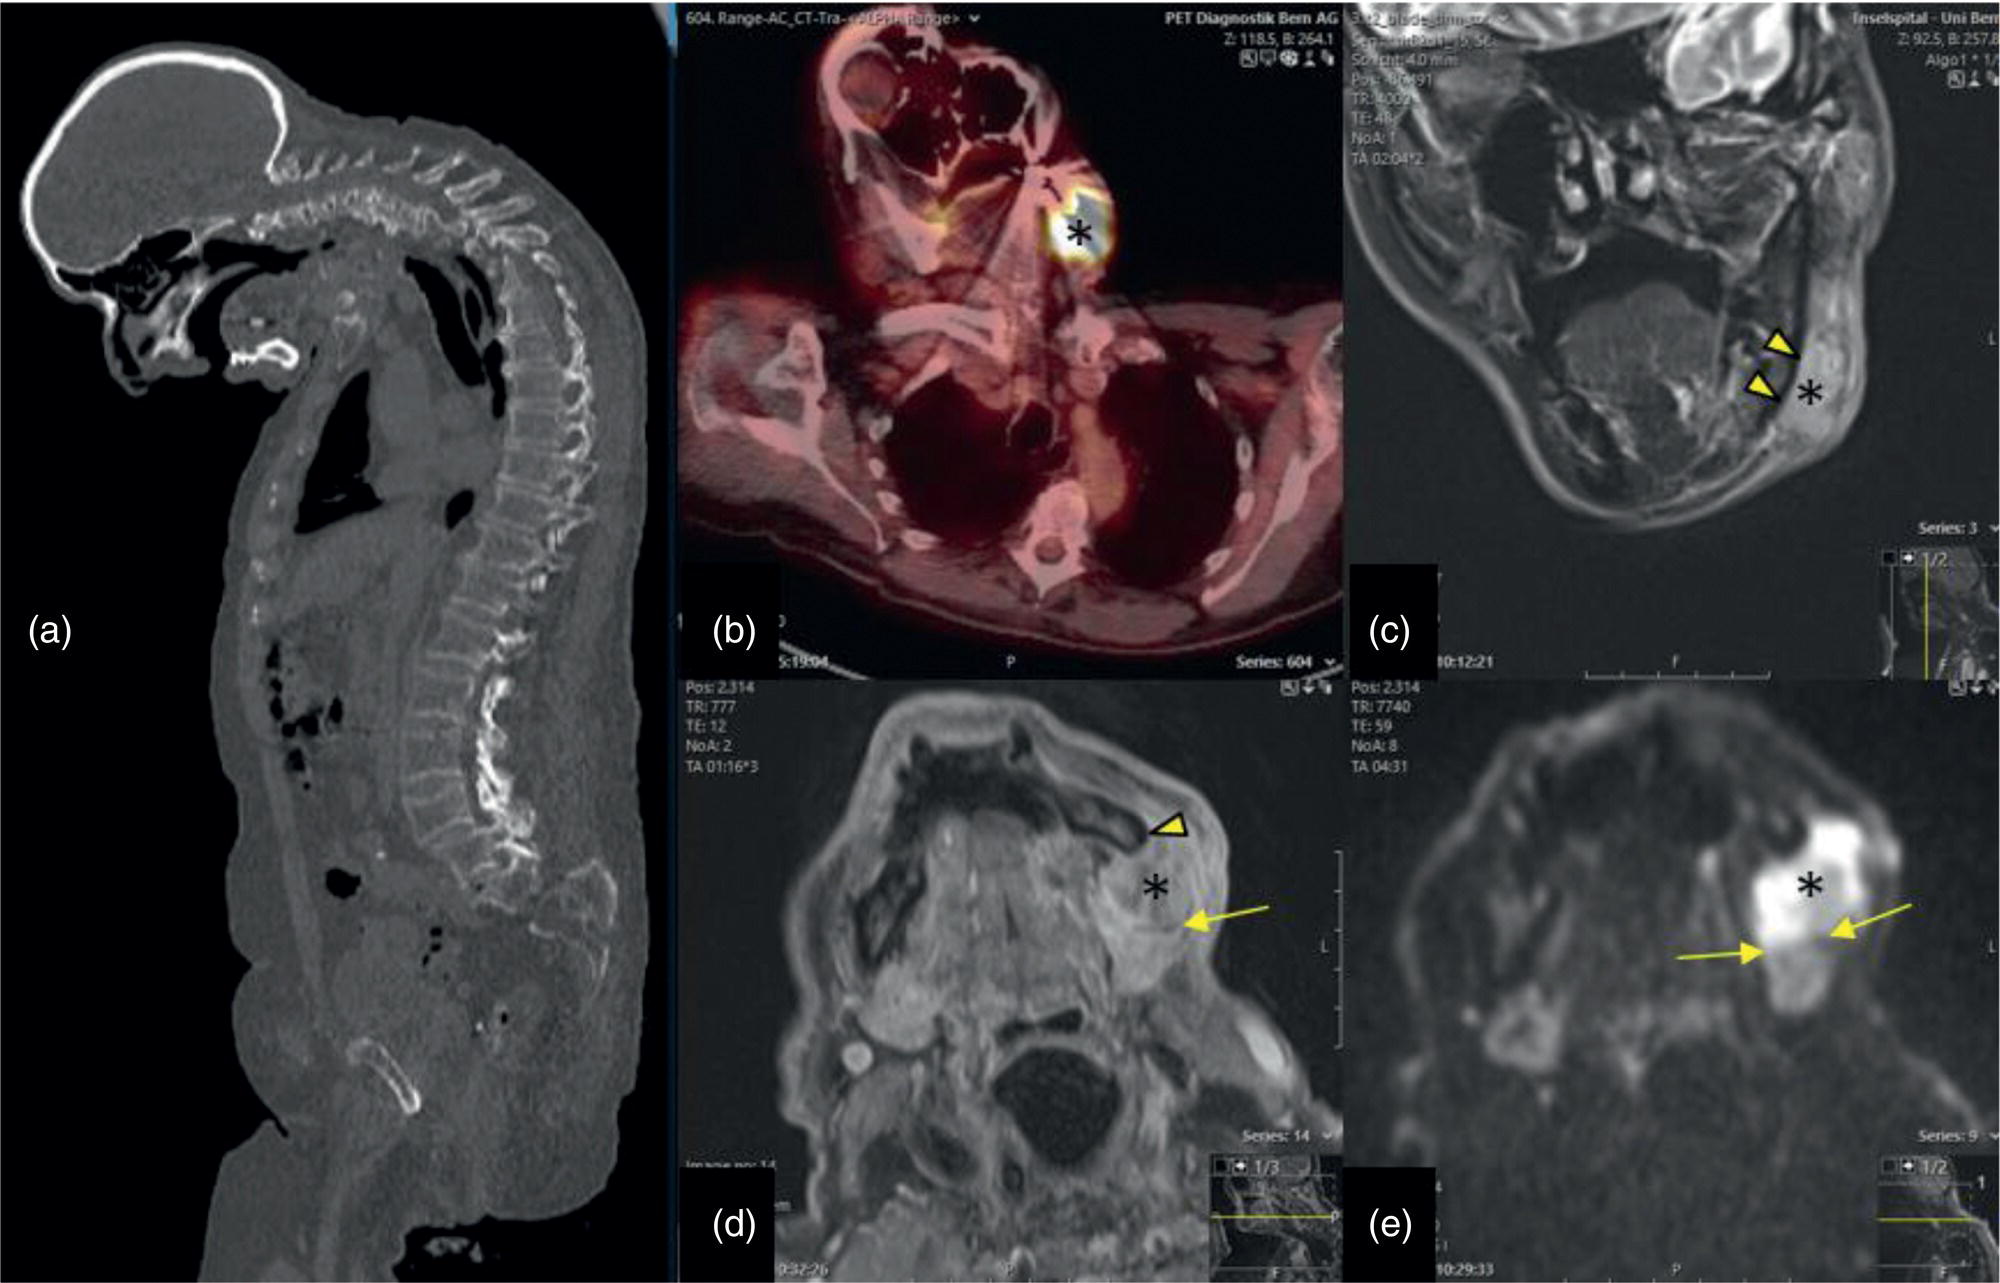
Swallowing Artifacts
Cervical Spine Kyphosis
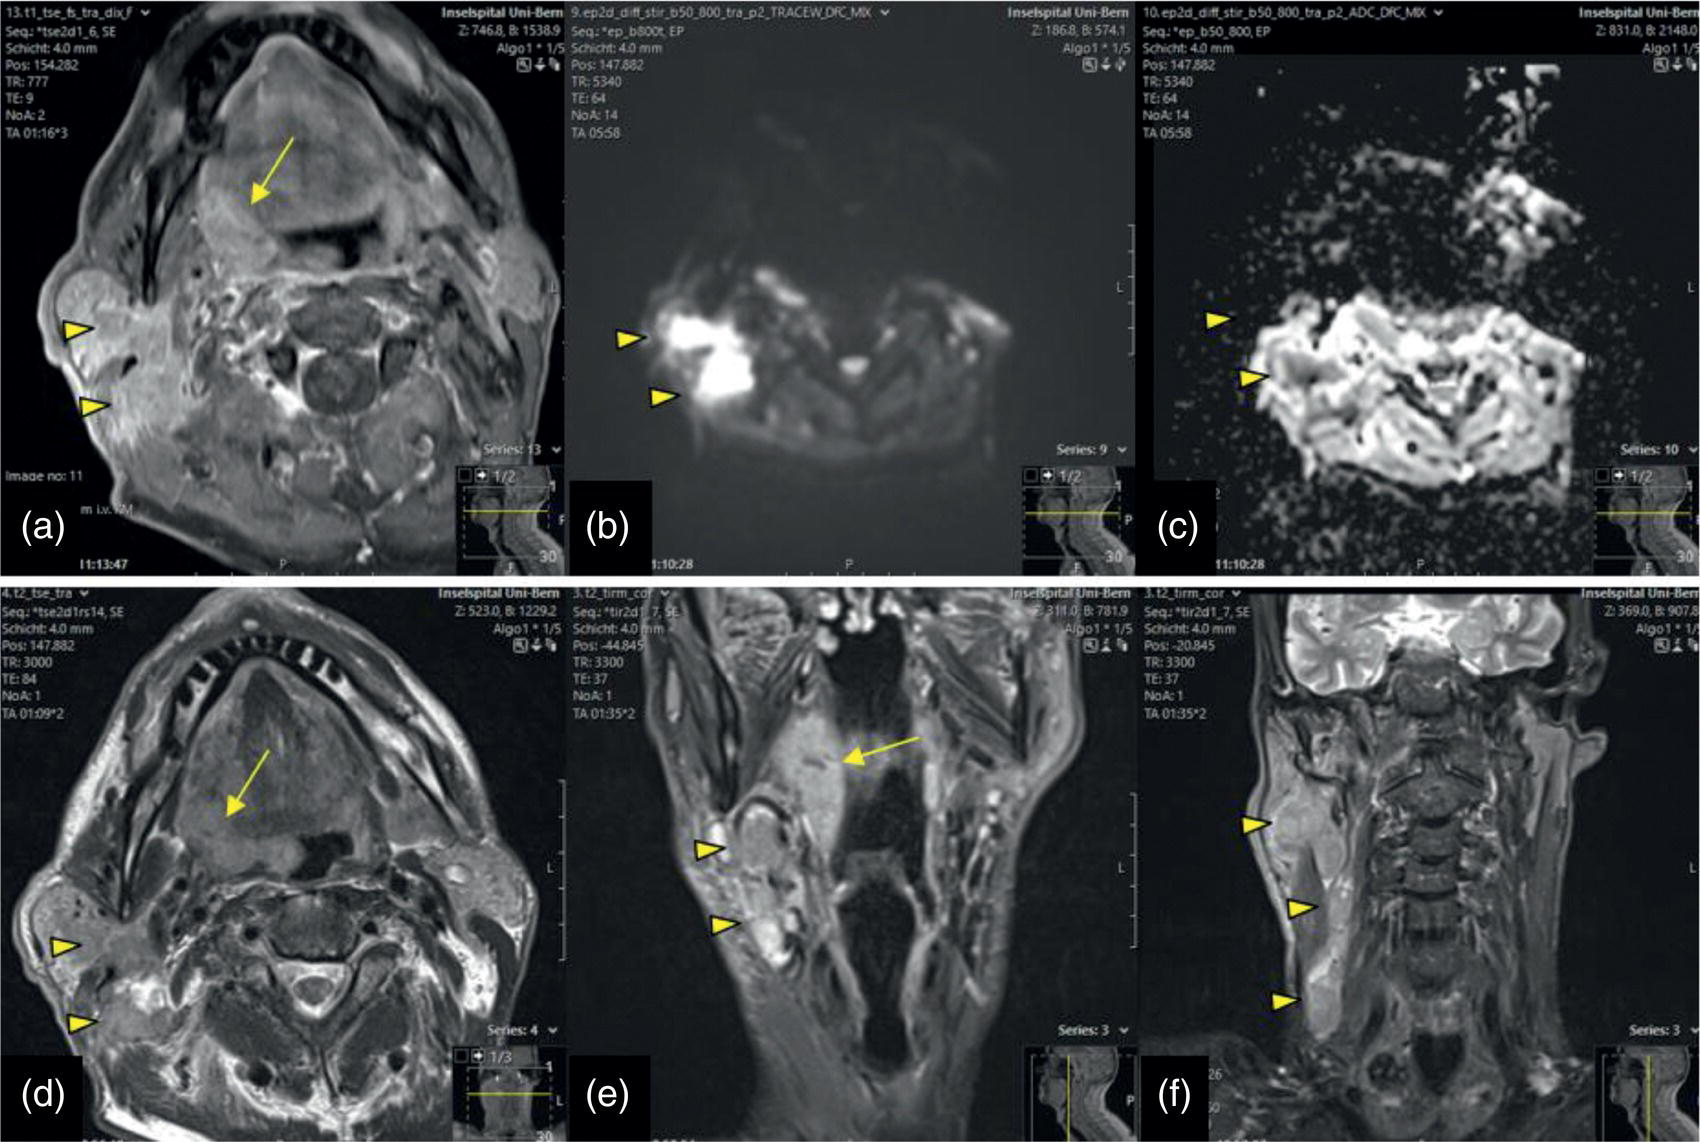
Impact of Dental Metal on Different MRI Techniques
Pre‐Therapeutic Findings
Nasal Cavity and Paranasal Sinuses
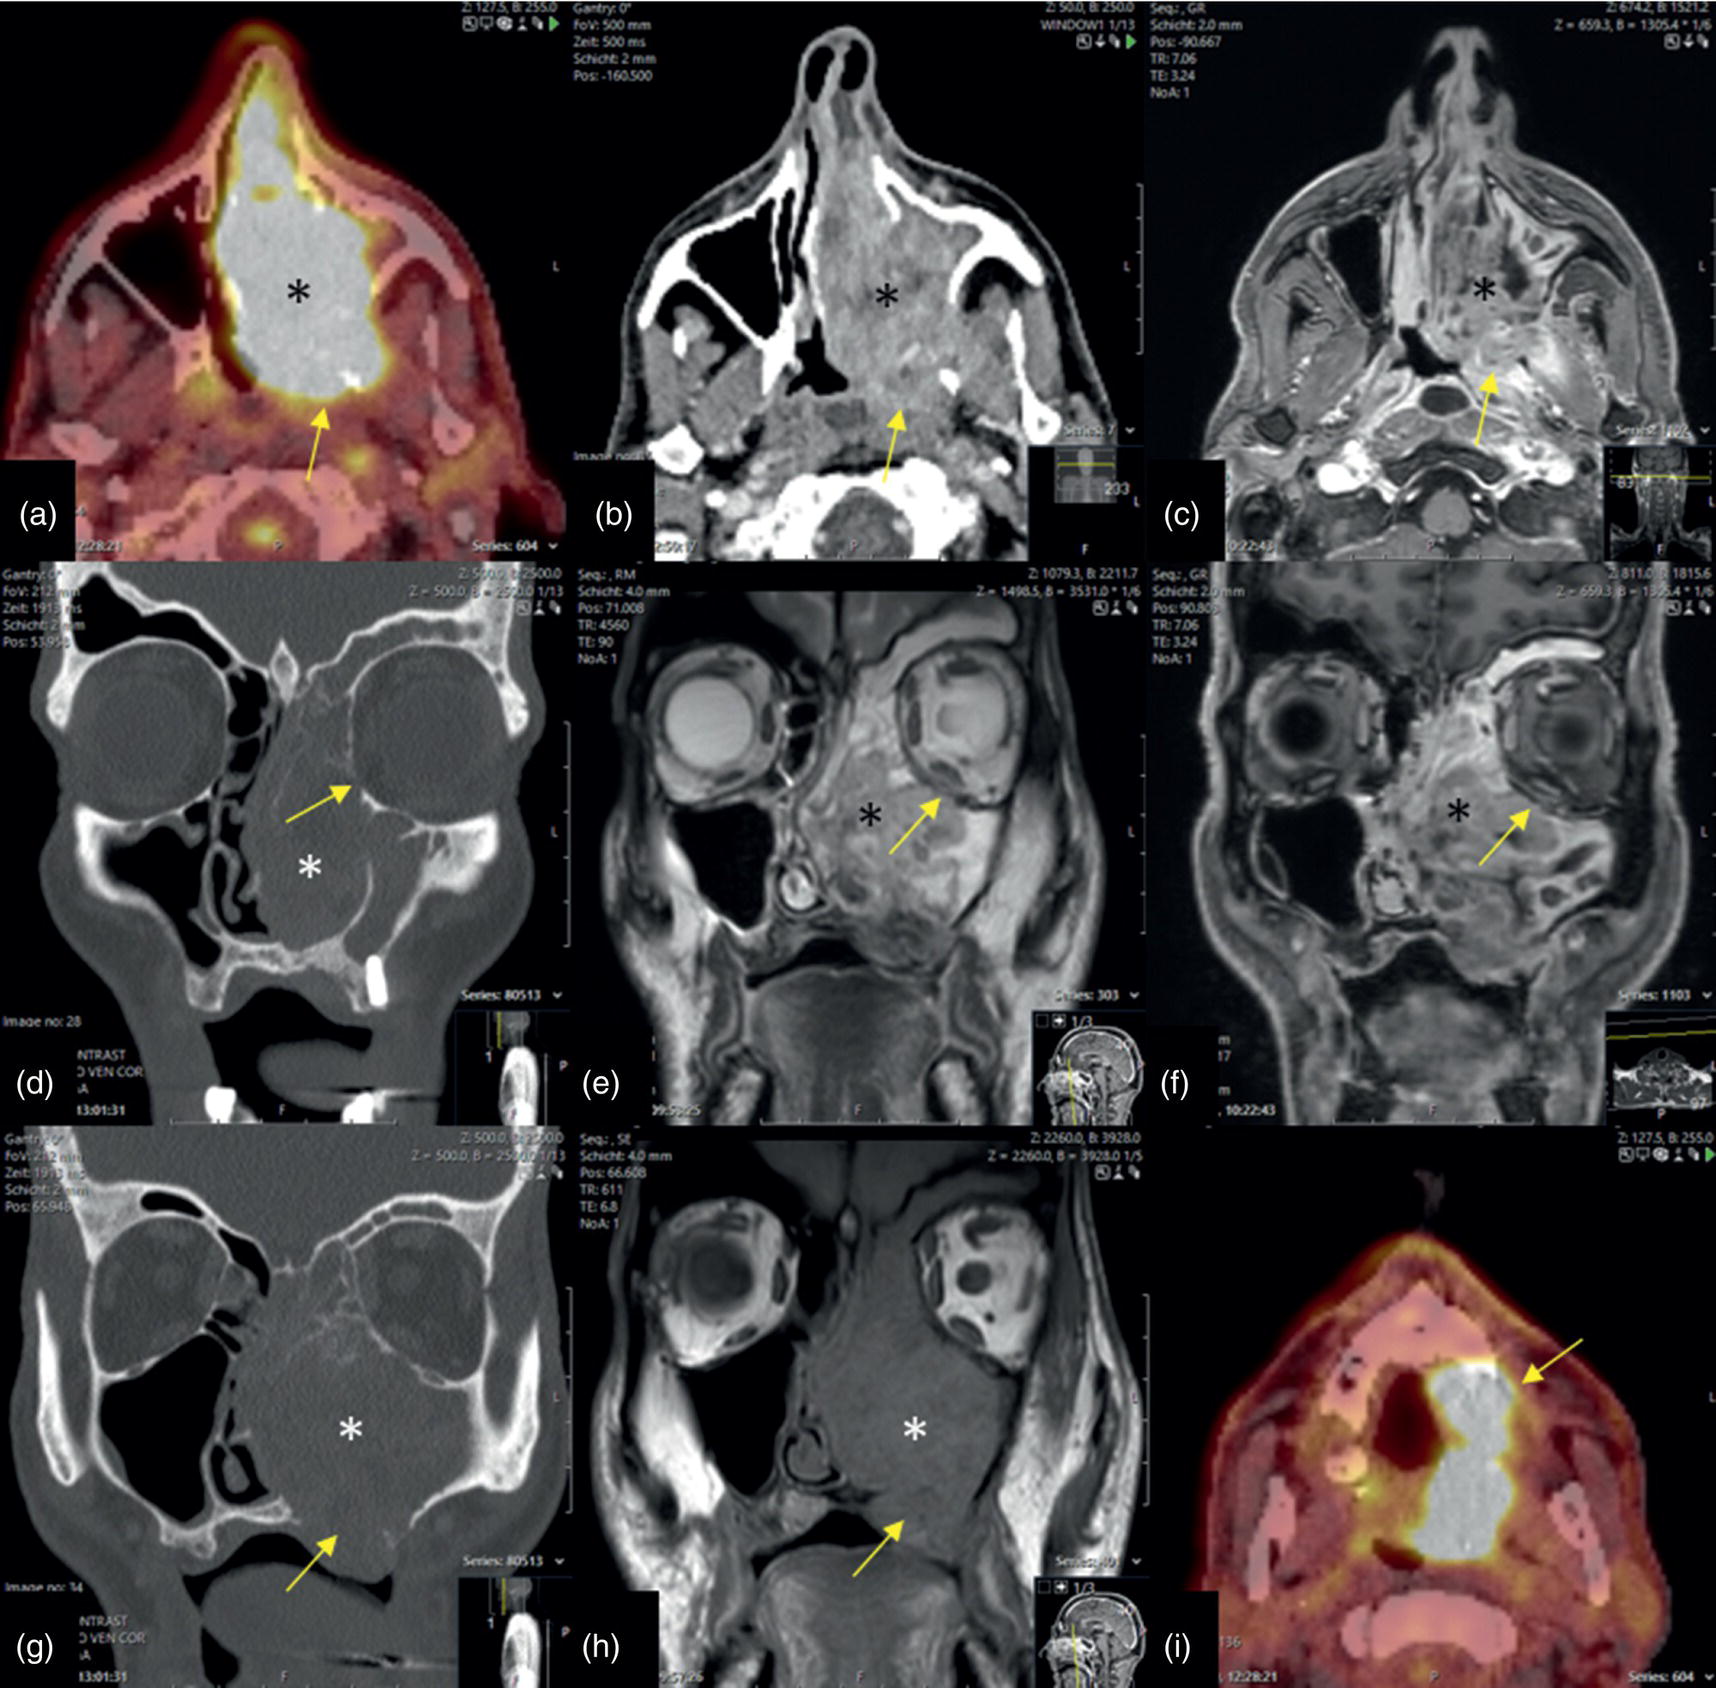
SCC of the Paranasal Sinuses
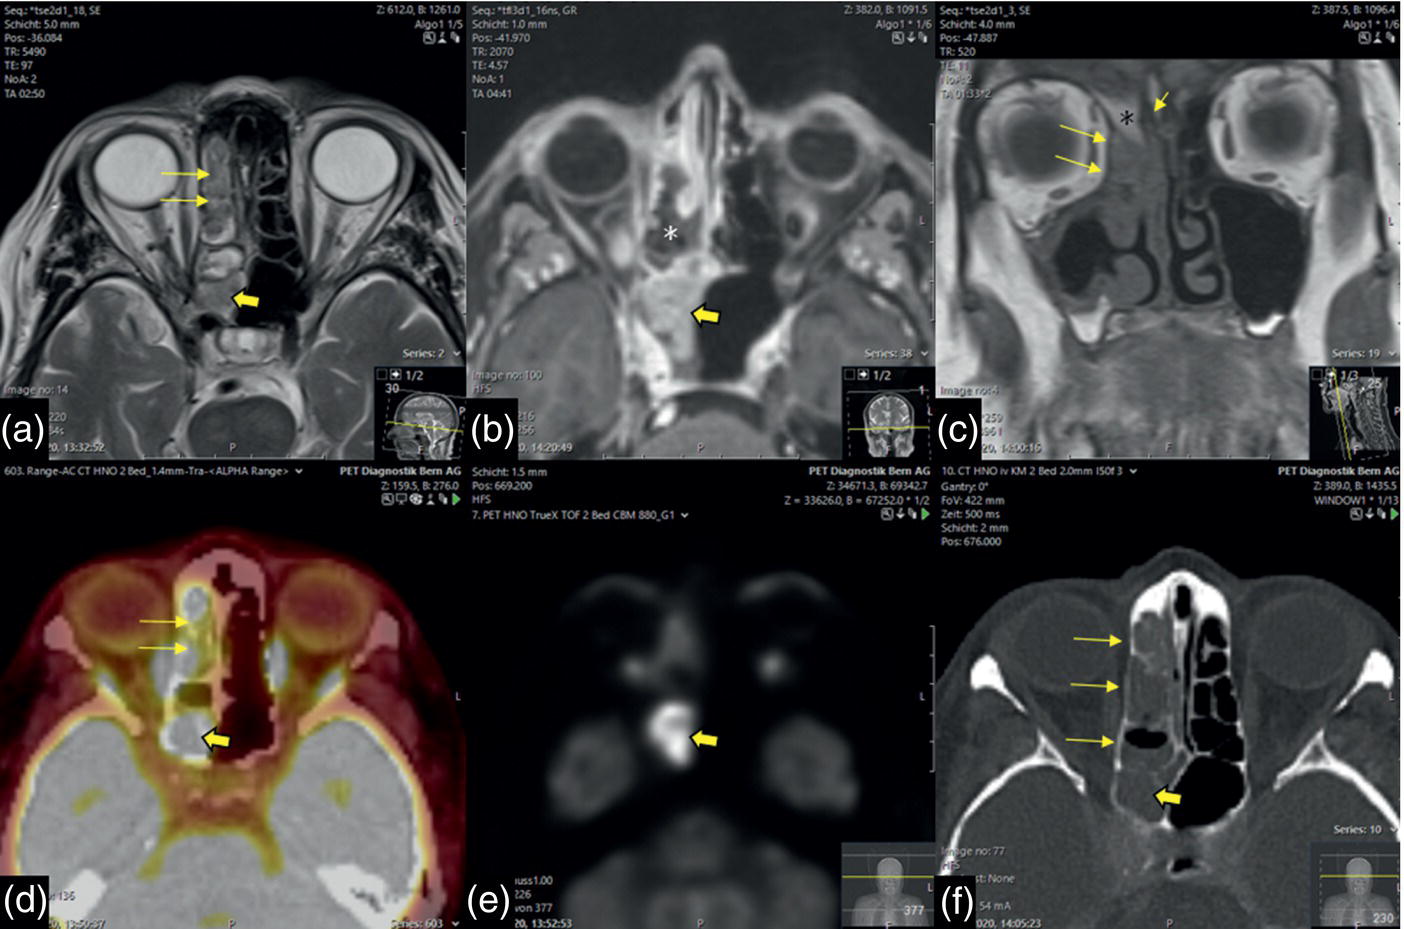
Sinonasal Melanoma
Salivary Glands
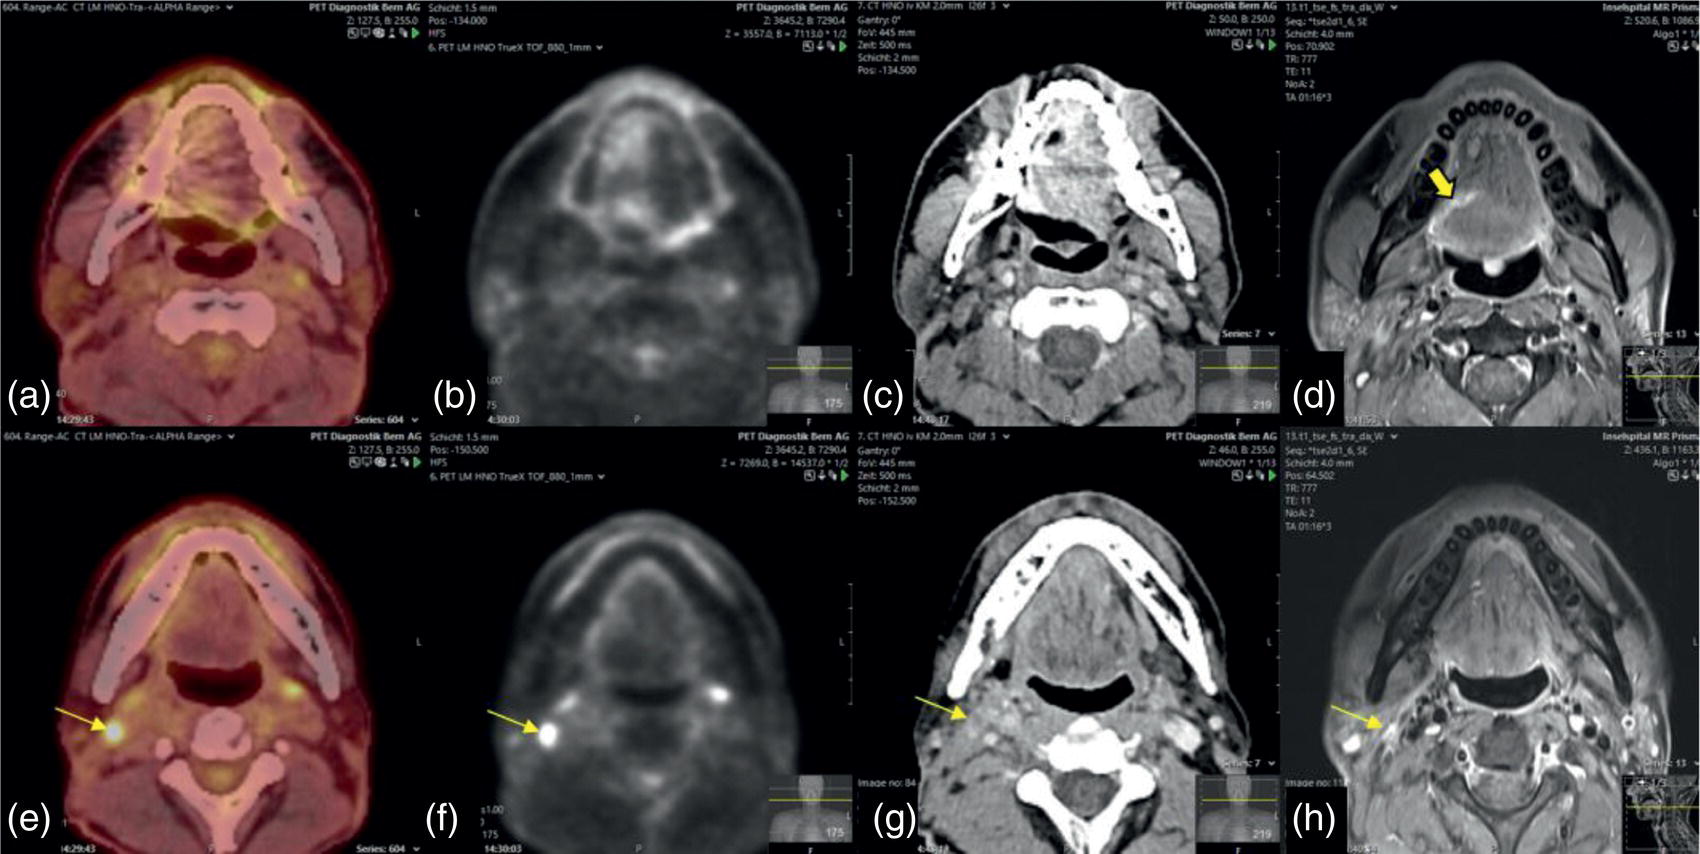
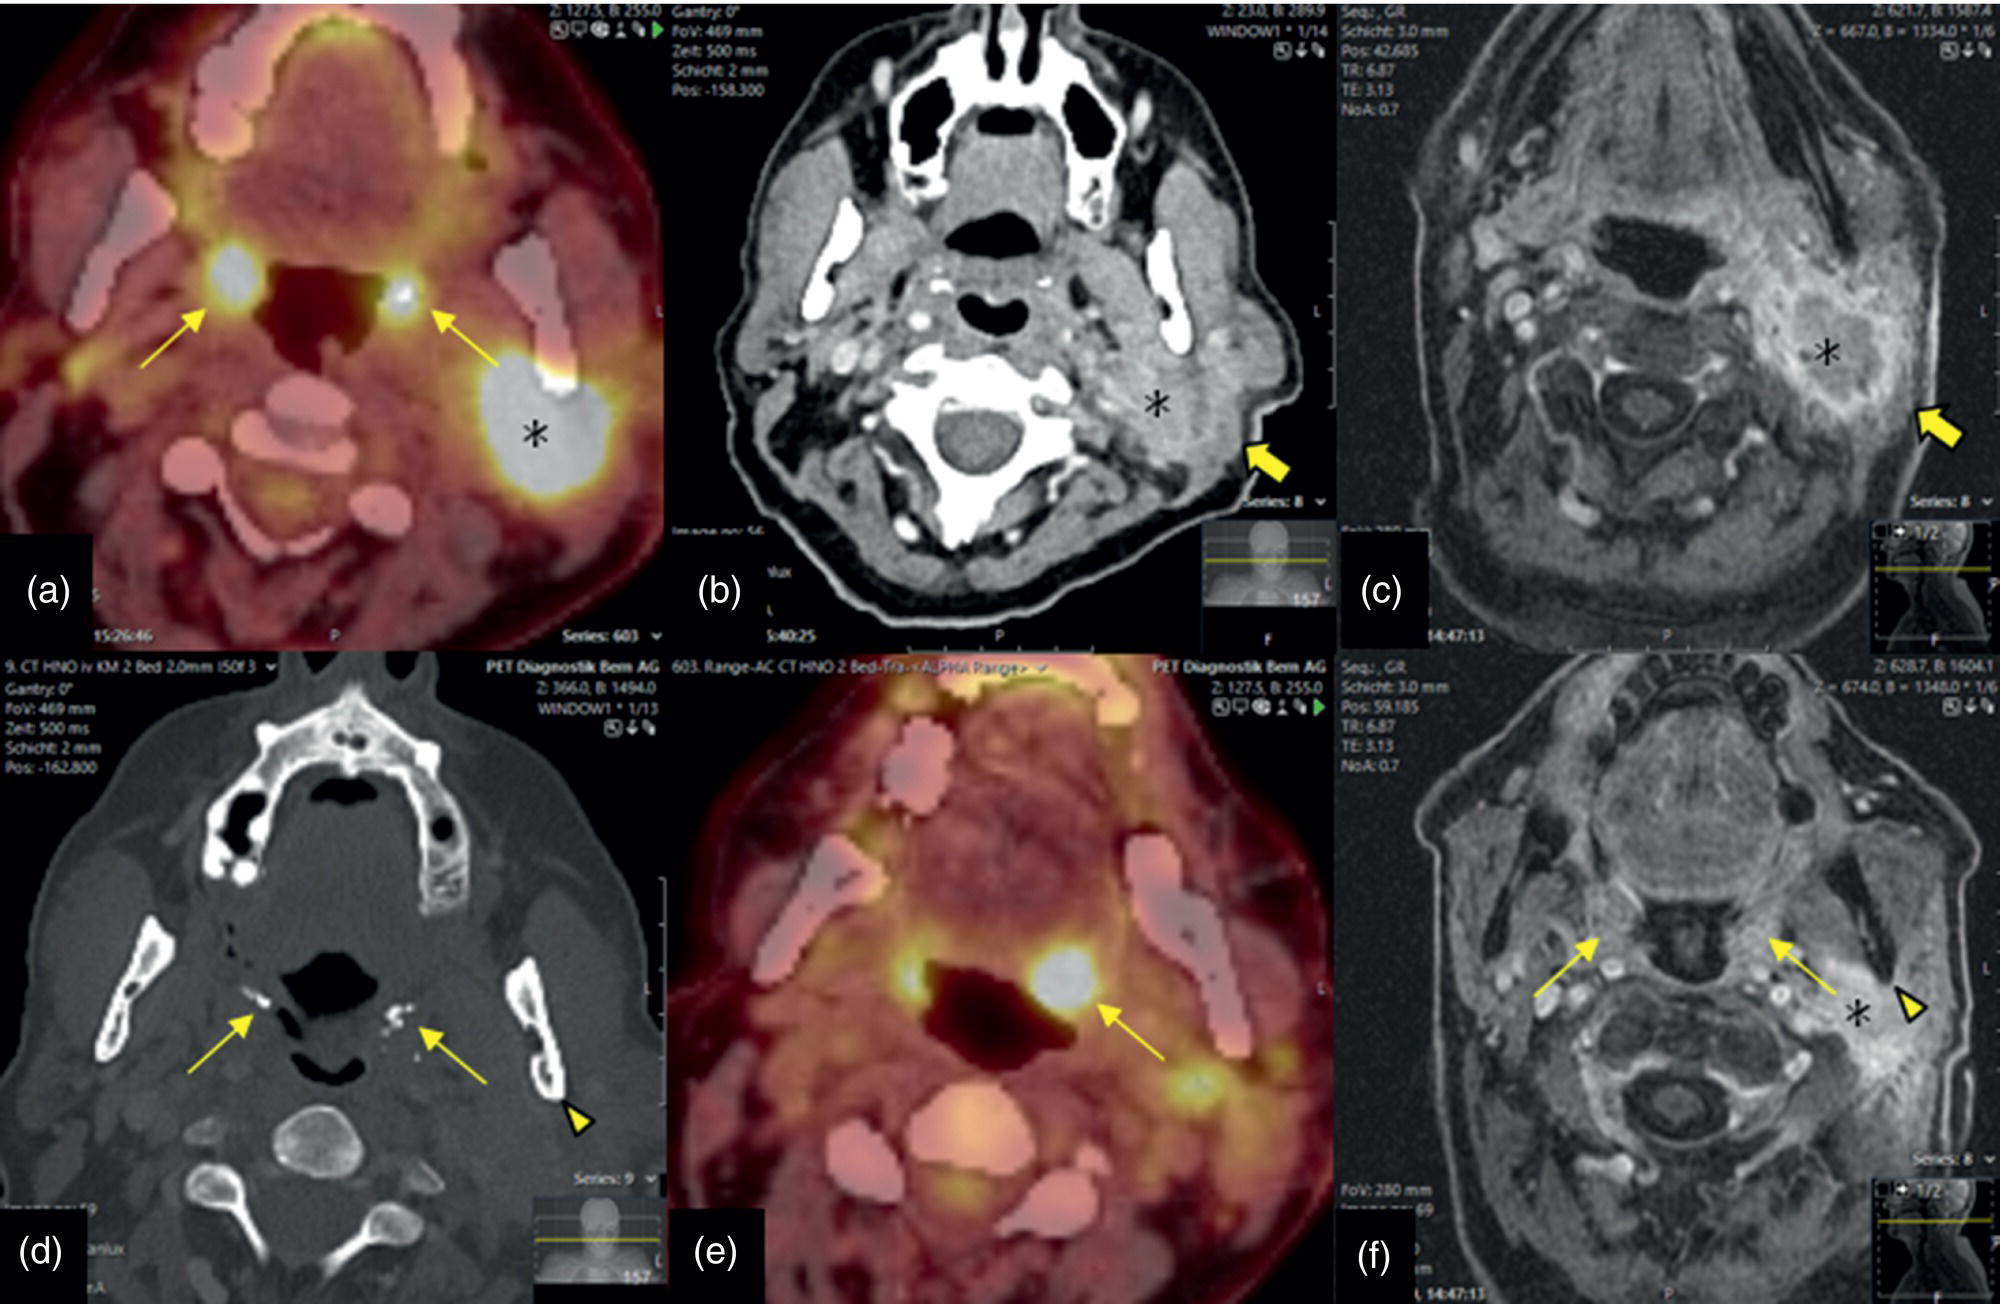
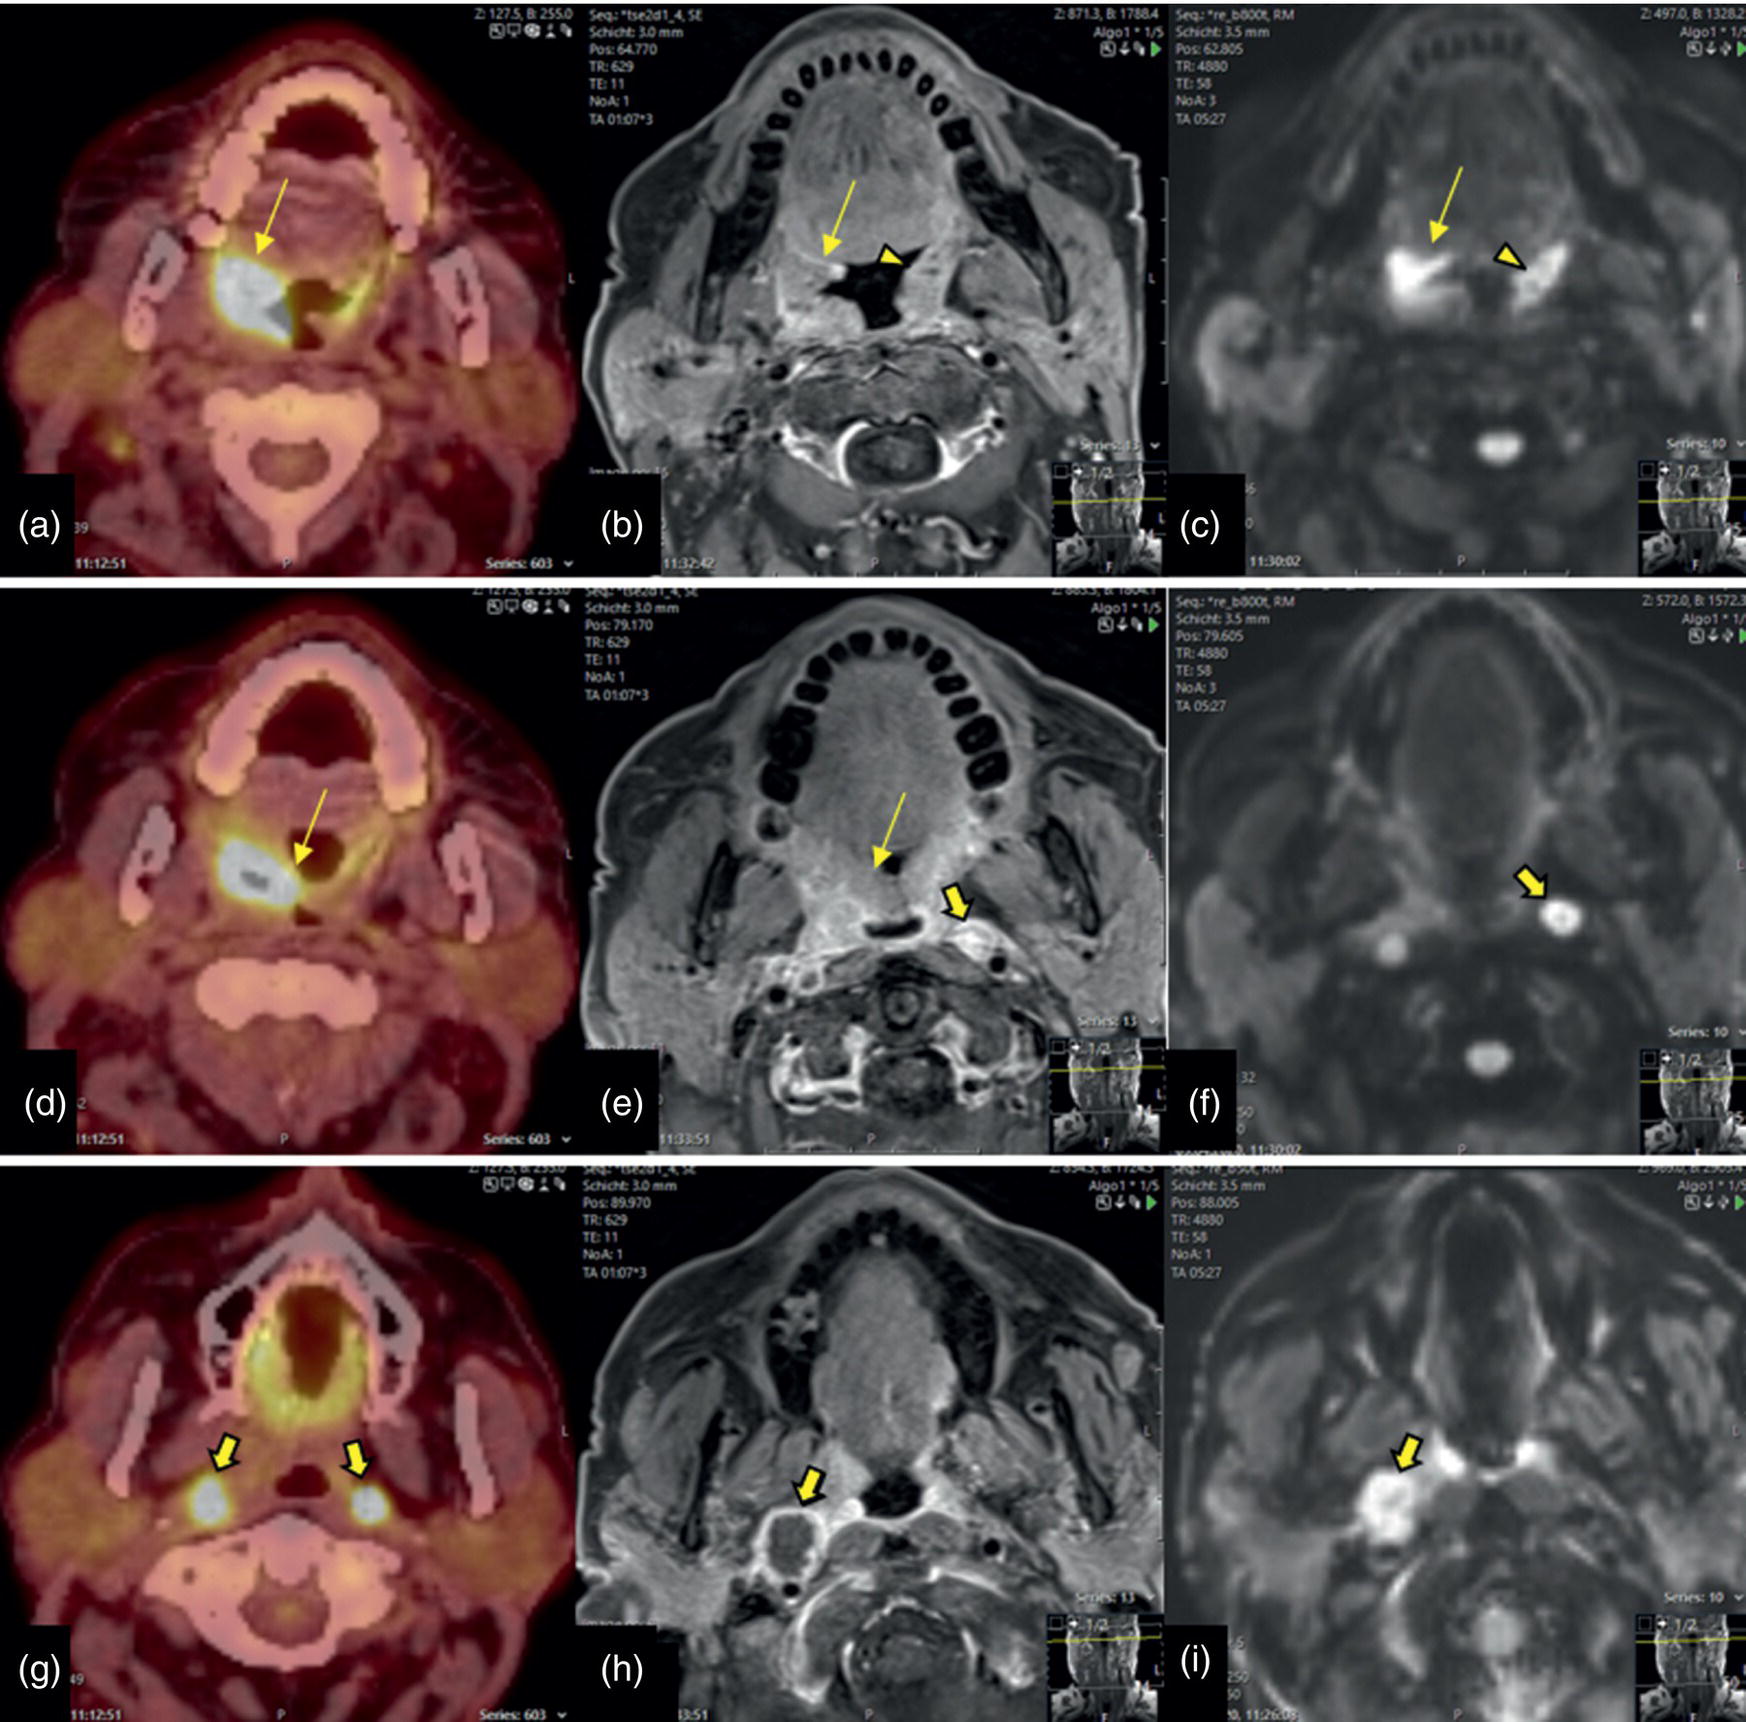
Parotid Malignancy (SCC)
Nasopharynx
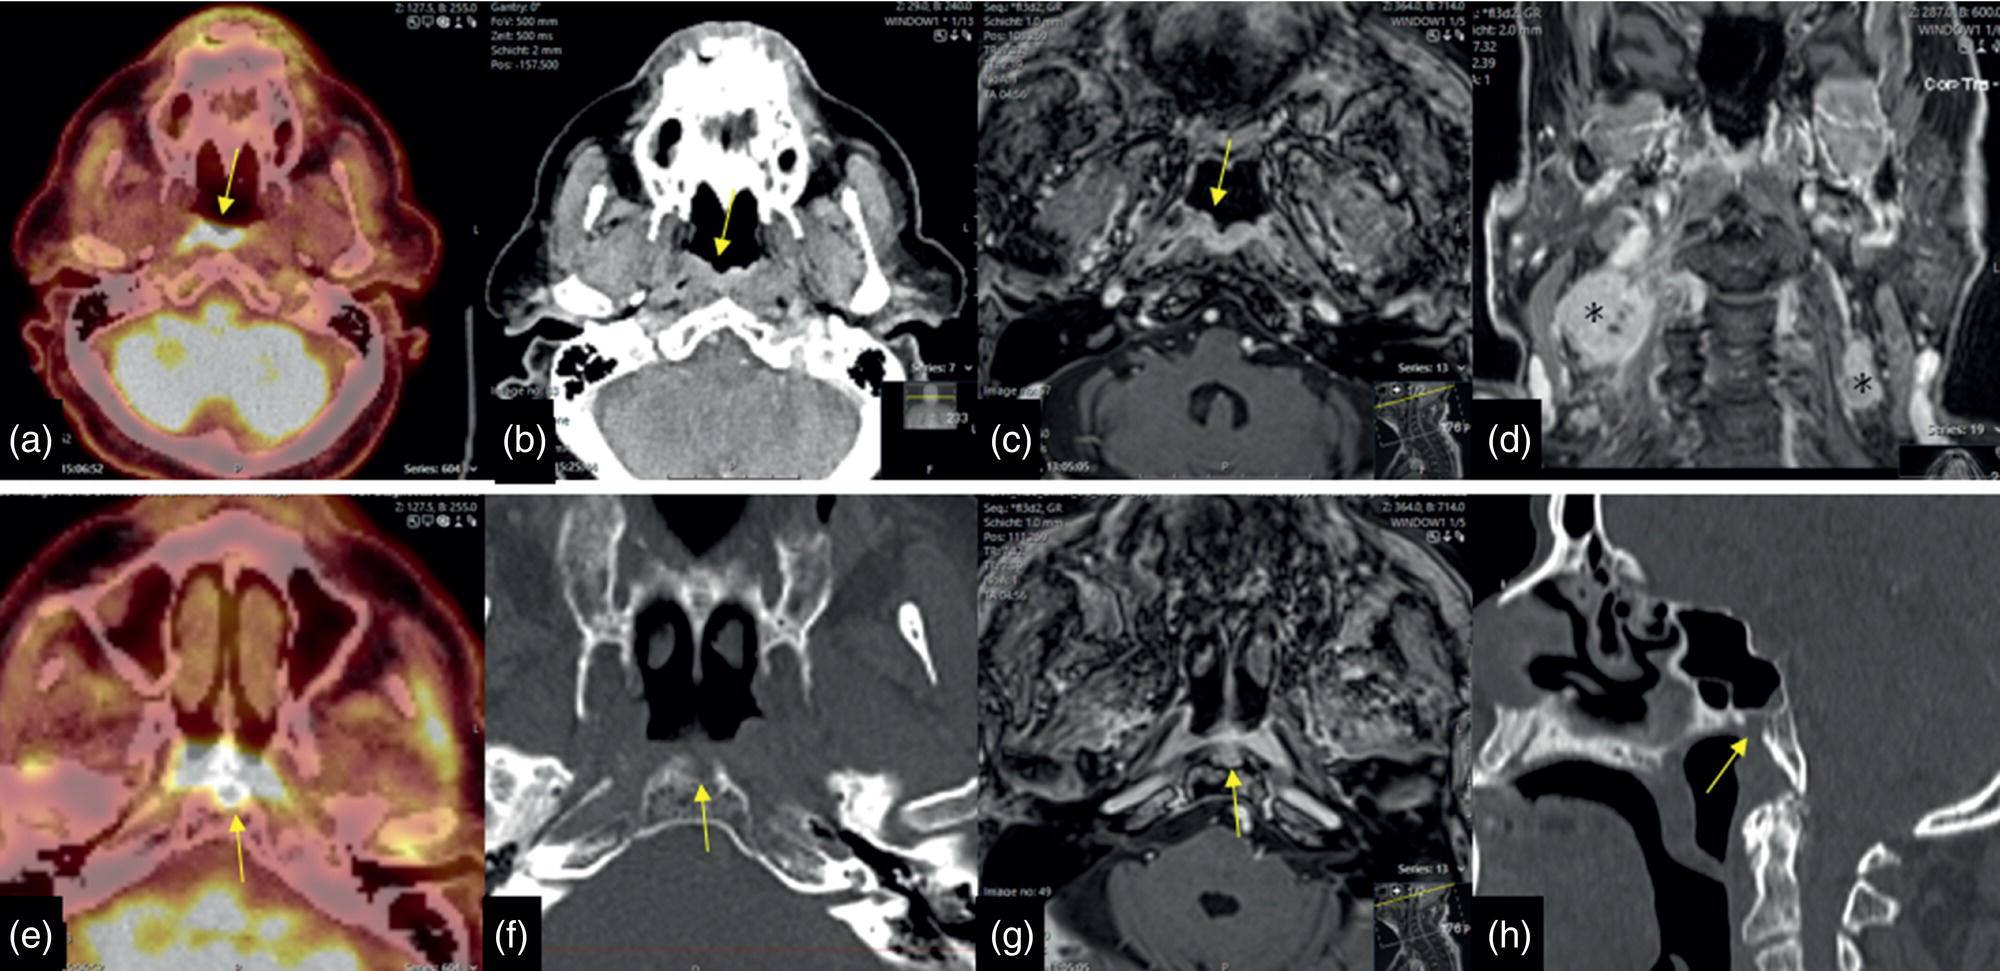
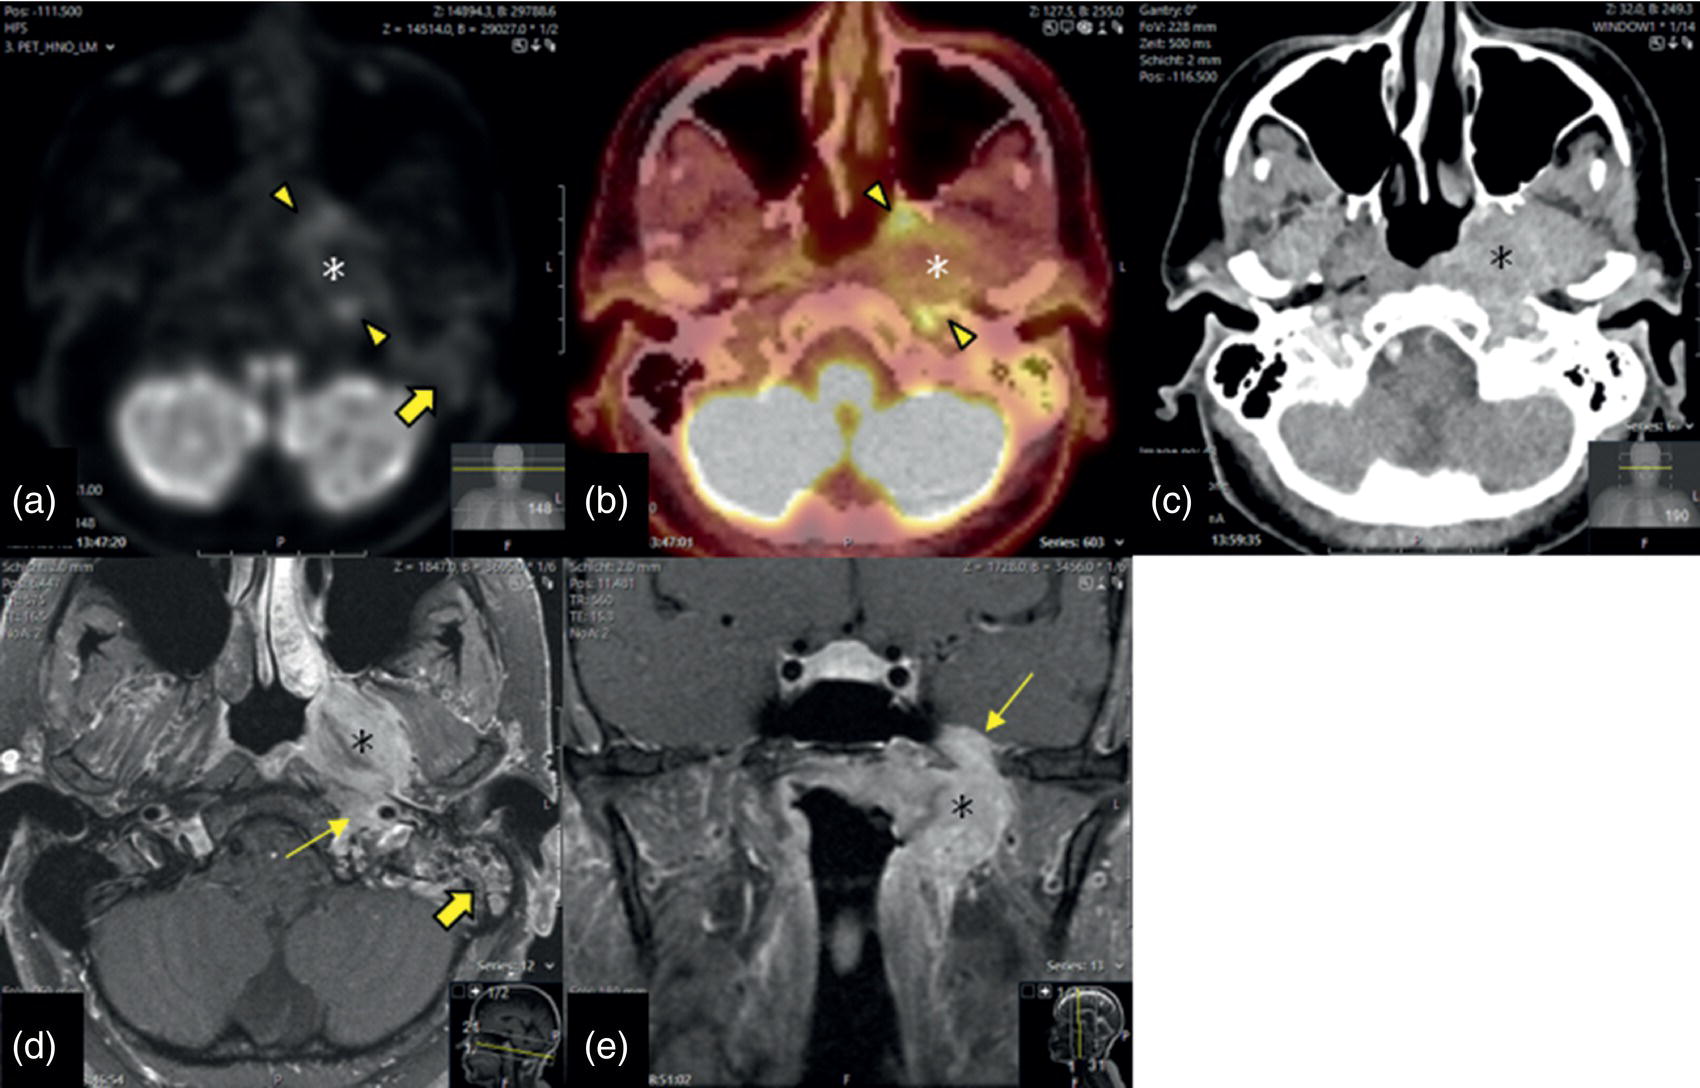
Nasopharyngeal Carcinoma
Adenoid‐cystic Carcinoma without FDG Accumulation
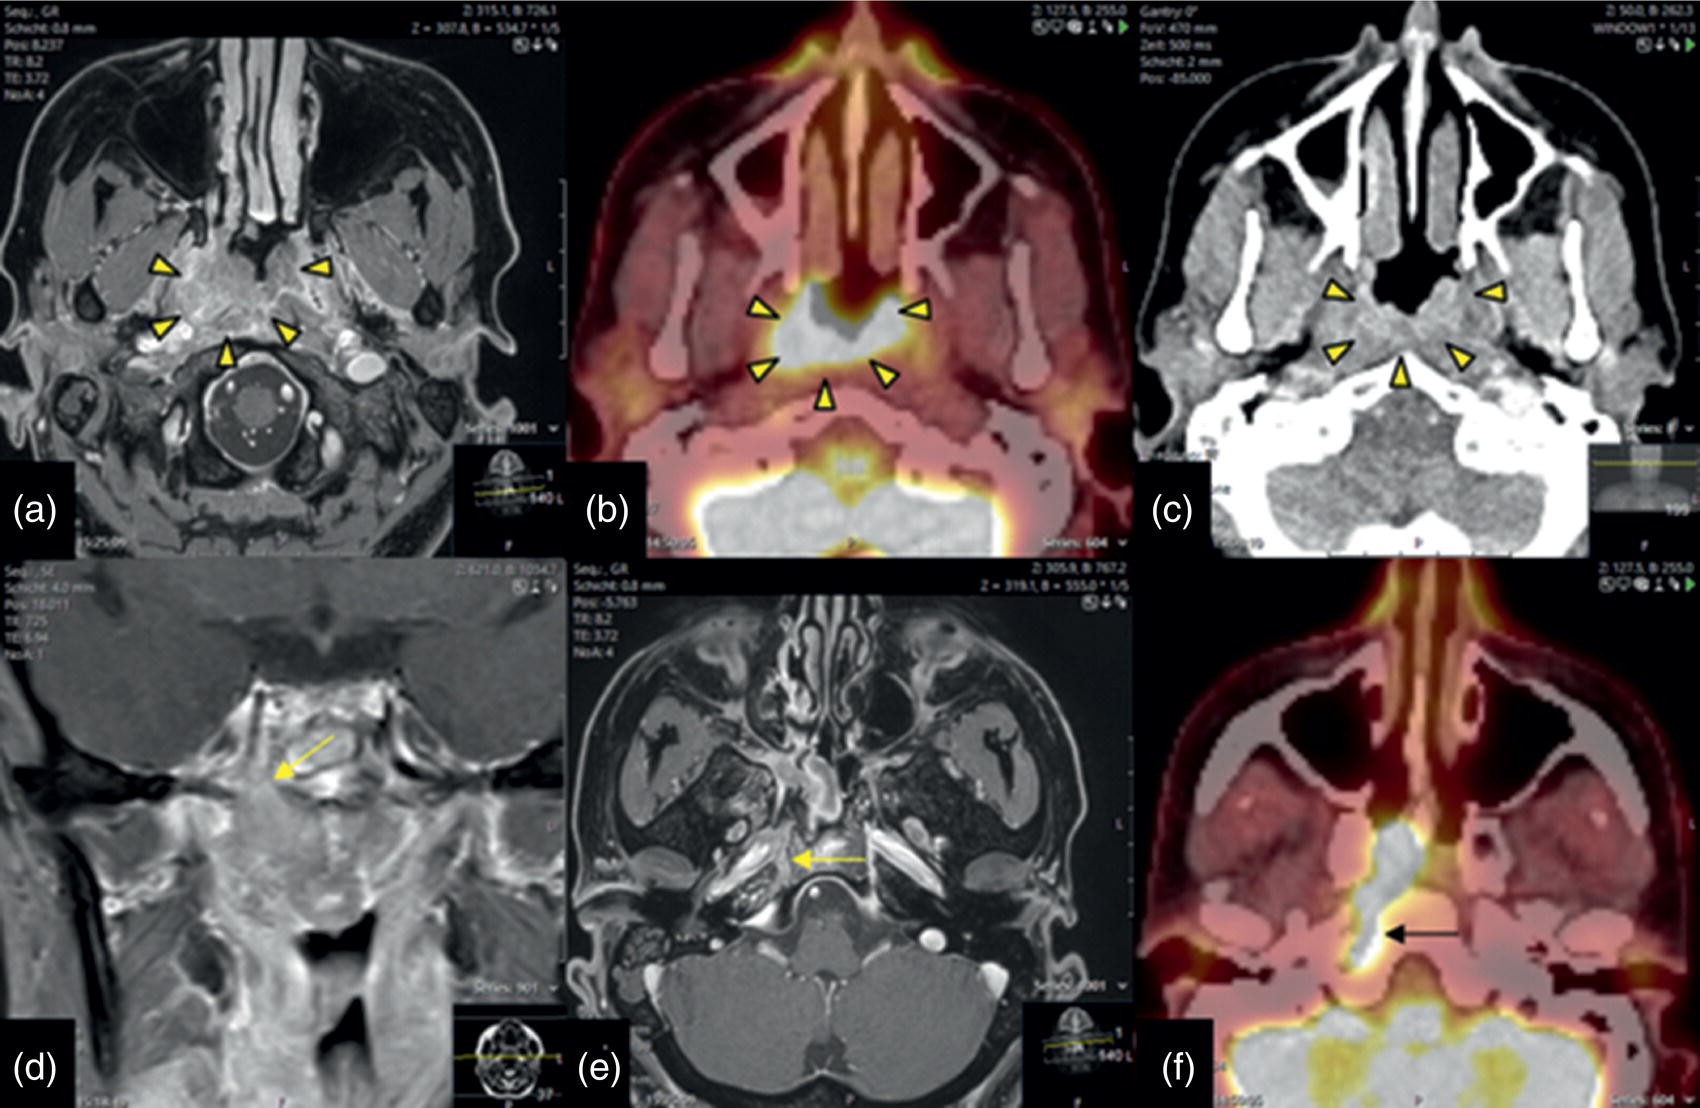
Perineural Tumor Extension of Nasopharyngeal SCC
Oropharynx
Tonsillar SCC
Related posts:
 Nephro‐urinary Tract Pathologies: A Correlative Imaging Approach
 Imaging in Gliomas: Clinical Principles and Synergies with MRI
 Osteoporosis: Diagnostic Imaging and Value of Multimodality Approach in Differentiating Benign Versus Pathologic Compression Fractures
 Emergency Radiology
 Vascular System
 Infection/Inflammation Imaging
![]()
Stay updated, free articles. Join our Telegram channel

Full access? Get Clinical Tree


