Fig. 12.1
Fetal circulatory pathways showing the three shunts, ductus arteriosus (DA), ductus venosus (DV), and the foramen ovale (FO). The via sinistra (red) directs blood from the umbilical vein (UV) through the DV and FO to reach the left atrium (LA), left ventricle (LV) and ascending aorta (AO) thus supplying the coronary and cerebral circuit with well oxygenated blood before joining with the via dextra (blue) in the descending AO. The via dextra receives deoxygenated blood from the abdominal inferior vena cava (IVC) and superior vena cava (SVC) directed to the right atrium (RA), right ventricle (RV), pulmonary trunk (PA) bypassing the pulmonary circuit through the DA. Splanchnic blood from the main portal stem (MP) is provided to the right liver lobe after blending with umbilical blood that reaches the right portal branch (RP) through the left branch (LP). CCA common carotid arteries, FOV foramen ovale valve, LHV left hepatic vein, MHV medial hepatic vein, PV pulmonary vein. With kind permission from Springer Science + Business Media: Ductus venosus, Kiserud T. In: Doppler ultrasound in obstetrics and gynecology, 2nd ed., Maulik D, Zalud I, editors, 2005
Although its presence was recognized since the sixteenth century, the importance of the ductus venosus in fetal circulatory physiology and pathology has been appreciated only very recently, with the advent of Doppler sonography [8]. A detailed discussion of the ductus venosus is beyond the scope of this chapter, but Kiserud has comprehensively reviewed the topic elsewhere [9, 10]. Utilizing two dimensional, color Doppler and pulsed spectral Doppler sonography, Kiserud and colleagues studied longitudinally the ductus venosus flow in normal women from 18 weeks to term, and noted an increase in the mean peak velocity with the progression of gestation. They also reported reversed flow during atrial systole in two cases with fetal cardiac disease. Numerous investigators over the last two decades demonstrated the value of ductus venosus Doppler in understanding circulatory pathophysiology, as well as its prognostic utility in complicated pregnancies, especially with fetal growth restriction [11]. Subsequent studies have reported the potential of ductus venosus Doppler in prenatal risk assessment for aneuploidy and congenital cardiac disease in the first trimester of pregnancy, which is discussed in this review.
Doppler Imaging Technique for the Ductus Venosus
Optimal imaging technique for Doppler interrogation of the ductus venosus has been well described [12, 13]. The ultrasound modalities include two-dimensional, color flow Doppler, and spectral Doppler imaging. The essential guidelines are as follows.
The high-pass filter is set as low as permitted by the device and is usually set at about 50 Hz level. An adequate Doppler frequency range should be selected to accommodate peak velocities without aliasing. The acoustic power output (the mechanical and thermal indices) should be set at a level as low as practically achievable for adequate image quality following the ALARA principle [14]. Anterior sagittal fetal plane is optimal for imaging the ductus (Fig. 12.2). However, posterior sagittal plane may also be helpful. These approaches allow viewing the ductus venosus in a long axis, displaying aliased high velocity color flow at the isthmus and enabling optimal pulsed spectral Doppler interrogation with a minimal insonation angle. In difficult fetal positions, an oblique cross sectional view may be the only choice; however, this will limit imaging at an optimal angle. In early pregnancy, the fetal image should be large enough to include just abdomen and thorax. This minimizes measurement errors related to small size. The sample volume should be adjusted to include only the target vein in order to avoid collecting signals from other veins in proximity, such as the umbilical vein, the hepatic vein or the inferior vena cava. Imaging should be performed only when the fetus is at rest, without body movements, breathing or hiccups.
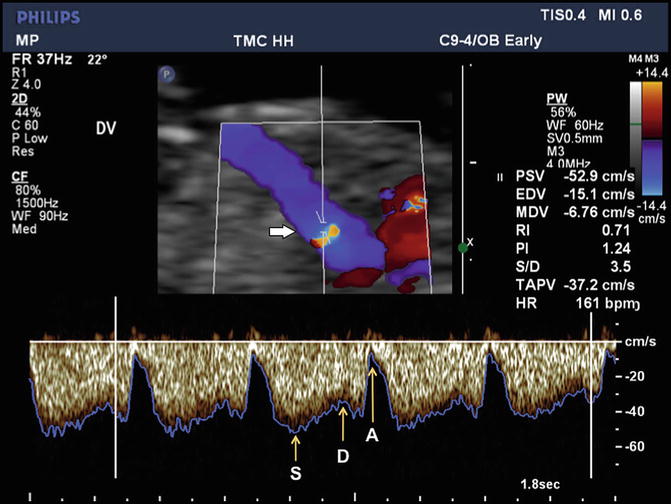

Fig. 12.2
Doppler ultrasound imaging of ductus venosus flow in the sagittal plane at 12 weeks’ gestation is depicted in color Doppler and spectral Doppler modes. The upper panel shows color Doppler flow pattern with aliasing related to high velocity, which guides the placement of the Doppler sample volume (horizontal arrow). The flow is away from the transducer as indicated by the color map. The lower panel depicts the triphasic spectral waveforms from the ductus. In this display, the blue line corresponds to the peak velocity envelope through the cardiac cycle. S, peak systolic velocity; D, peak diastolic velocity; A, lowest peak velocity due to atrial contraction
Ductus Venosus Doppler Waveforms
In normal pregnancies, blood flow in the ductus venosus is directed toward the fetal heart. The Doppler waveform is triphasic with two peaks and a trough reflecting the phases of the fetal cardiac cycle (see Fig. 12.2). The first peak is the highest velocity during the ventricular systole and is designated as the S wave. The second peak, termed the D wave, is the highest velocity during the ventricular diastole and is lower than the S wave. The trough, called the a-wave, is the lowest velocity of the Doppler waveform corresponding to the minimum velocity during the atrial contraction. The Doppler waveforms from the ductus venosus can be analyzed in terms of the actual velocity values, which require an optimal insonation angle and angle correction. Alternatively, various indices of pulsatility have been described which obviates the need for angle correction. In all these measurements the maximum frequency shift envelope of the waveform is utilized (see Fig. 12.2).
In clinical practice, the most relevant and frequently used attribute is the a-wave, which is related to the atrial contraction. A zero or negative waveform indicates an increased end-diastolic filling pressure in the right heart (Fig. 12.3).
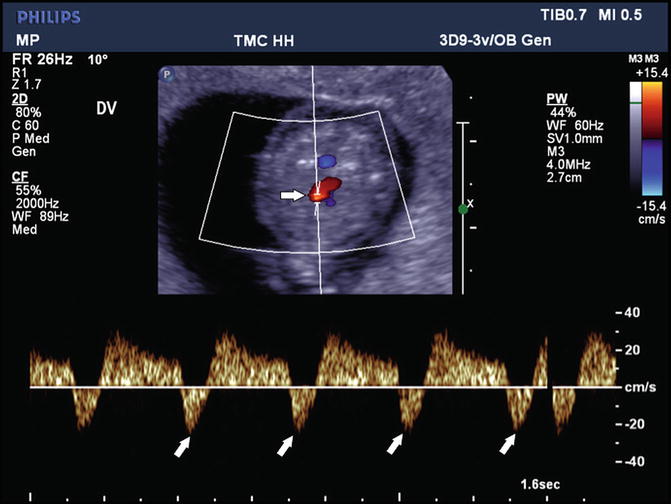

Fig. 12.3
Reversal of flow in the ductus venosus is depicted in color Doppler directed spectral Doppler display. The upper panel, in the oblique axial plane, shows the color Doppler flow in the ductus and the lower panel the spectral display. The oblique arrows indicate reversal of flow. The horizontal arrow shows the placement of the Doppler sample volume
Factors Affecting the Ductus Venosus Waveform
In early pregnancy, the velocity of blood flow in the ductus venosus increases with gestational age. The increase is throughout the fetal cardiac cycle. In a cross-sectional study of 262 normal singleton fetuses between 8 and 20 weeks gestation, van Splunder and associates noted a significant nonlinear rise in S, D and time-averaged peak velocity (Vta) but a significant decline in the pulsatility index for veins (PIV) [15]. The Vta increased almost fourfold. Prefumo and colleagues measured the ductus venosus velocity parameters between 10 and 14 weeks in 201 normal fetuses in a cross-sectional study [16]. During this period, the mean S wave increased from 27 to 33.6 cm/s, the mean a-wave from 5.9 to 7.8 cm/s, and the time-averaged peak velocity from 19.4 to 25.3 cm/s. These increases level off beyond the first half of pregnancy. The reference ranges for the ductus venosus Doppler velocity components from this study are depicted in Figs. 12.4, 12.5, 12.6, and 12.7.


Fig. 12.4
Ductus venosus pulsatility index for veins (PIV) measurements according to crown-rump length in 198 fetuses presented with 5th, 50th, and 95th centiles. The equation for the 50th centile is y = −0.0014x + 1.1279 and for the standard deviation is SD = 0.0004x + 0.1233. Reprinted from Prefumo F, Risso D, Venturini PL, De Biasio P. Reference values for ductus venosus Doppler flow measurements at 10–14 weeks of gestation. Ultrasound Obstet Gynecol. 2002;20(1):42–6, with permission from John Wiley & Sons

Fig. 12.5
Ductus venosus S-wave velocity measurements according to crown-rump length in 198 fetuses presented with 5th, 50th, and 95th centiles. The equation for the 50th centile is y = 0.1304x + 22.083 and for the standard deviation is SD = 0.0448x + 4.862. Reprinted from Prefumo F, Risso D, Venturini PL, De Biasio P. Reference values for ductus venosus Doppler flow measurements at 10–14 weeks of gestation. Ultrasound Obstet Gynecol. 2002;20(1):42–6, with permission from John Wiley & Sons

Fig. 12.6
Ductus venosus A-wave velocity measurements according to crown-rump length in 198 fetuses presented with 5th, 50th, and 95th centiles. Log10 transformation was performed for data analysis; data are displayed after antilog transformation. The equation for the 50th centile is y = 100.0024x+0.679 and the standard deviation is SD = 100.1492. Reprinted from Prefumo F, Risso D, Venturini PL, De Biasio P. Reference values for ductus venosus Doppler flow measurements at 10–14 weeks of gestation. Ultrasound Obstet Gynecol. 2002;20(1):42–6, with permission from John Wiley & Sons

Fig. 12.7
Ductus venosus time-averaged maximum velocity (TAMXV) measurements according to crown-rump length in 198 fetuses presented with 5th, 50th and 95th centiles. The equation for the 50th centile is y = 0.1174x + 14.95 and for the standard deviation is SD = 0.0342x + 3.9375. Reprinted from Prefumo F, Risso D, Venturini PL, De Biasio P. Reference values for ductus venosus Doppler flow measurements at 10–14 weeks of gestation. Ultrasound Obstet Gynecol. 2002;20(1):42–6, with permission from John Wiley & Sons
Fetal breathing movements produce intrathoracic pressure fluctuations, leading to changes in the venous pressure dynamics. Breathing induced pressure gradients of up to 22 mmHg across the ductus venosus have been estimated in fetuses during 18–40 weeks of pregnancy utilizing the Bernoulli equation [17]. This is the rationale for not assessing the ductus venosus Doppler hemodynamics during fetal breathing. Breathing movements in early gestation are not regular and become more frequent as the fetus approaches mid-gestation [18]. There is a dearth of information regarding the quantitative effects of breathing movements on precordial venous dynamic in early pregnancy. Fetal movements will also affect the Doppler shift.
Fetal heart rate affects ductus venosus Doppler waveform. Bradycardia allows an increased venous return and atrial filling, leading to an enhanced atrial contraction and, consequently, an enhanced a-wave. In a sheep model, Gudmundsson and coworkers noted changes in ductus venosus velocity waveform directly related to fetal bradycardia consequent to fetal hypoxemia, [19]. Any increase in the fetal myocardial compliance will lead to changes in the ductal waveform. Thus, hypoxia, acidosis or intra-thoracic lesions such as pleural effusion pressing on the heart lower cardiac compliance, leading to augmented a-waves [9, 13]. Blood viscosity also modifies venous Doppler waveforms, which is seen in fetal anemia. Lam and co-investigators reported significant increases in S, a-wave and Vta in nonhydropic fetuses between 12 and 13 weeks with homozygous alpha thalassemia-1 [20]. This was attributed to lower blood viscosity in anemia and also to hypoxia.
Ductus Venosus Doppler in First-Trimester Aneuploidy Screen
The most frequent and important utilization of ductus venosus Doppler in the first trimester of pregnancy is for aneuploidy screening. Various investigators have demonstrated its efficacy, with or without the nuchal translucency and various biomarkers. Selected reports are discussed below and summarized in Table 12.1 [21–30].
Table 12.1
Reported abnormal ductus venosus doppler in fetal aneuploidy in the first trimester of pregnancy
First author (reference) | Date | Total patients | Euploid cases | Aneuploid cases | Abnormal DVD aneuploid cases (%) | Abnormal DVD in euploid fetuses (%) |
|---|---|---|---|---|---|---|
Matias [22] | 1998 | 486 | 423 | 63 | 90.5 | 3.07 |
Antolin [23] | 2001 | 924 | 911 | 13 | 77.0 | 4.28 |
Murta [24] | 2002 | 372 | 343 | 29 | 89.7 | 2.04 |
Zoppi [25] | 2002 | 325 | 292 | 33 | 69.7 | 13.0 |
Borrell [26]a | 2003 | 3382 | 3289 | 93 | 64.5 | 4.93 |
Toyama [27] | 2004 | 1097 | 1075 | 22 | 68.2 | 6.42 |
Prefumo [28] | 2005 | 572 | 497 | 47b | c | 5.23 |
Maiz [29] | 2009 | 19,800 | 19,614 | 186 | 64.0 | 3.17 |
Florjański [30] | 2013 | 1526 | 1480 | 46 | 63.0 | 7.43 |
Totals | 28,484 | 27,924 | 532 | 69.9 | 3.89 |
Borrell and colleagues reported Doppler velocimetry of the ductus venosus, prior to performing invasive diagnostic procedures for trisomy 21, in 534 consecutive fetuses of 10–18 weeks of gestation [21]. Trisomy 21 was present in 11 fetuses, eight of whom had venous pulsatility index >95th centile, and three had the a-wave below 5th centile. Matias and coworkers performed Doppler velocimetry of the ductus venosus, just before fetal karyotyping, in 486 consecutive singleton pregnancies between 10 and 14 weeks [22]. Of the 63 fetuses with chromosomal anomaly, 57 (90.5 %) had reverse or absent a-wave. Abnormal ductus venosus Doppler was also observed, however, in 13 (3.1 %) of the 423 euploid fetuses. Multivariate regression analysis demonstrated that only the abnormal a-wave offered a significant independent discrimination between the euploid and the aneuploid cases.
In a cohort of about 20,000 singleton pregnancies, Maiz and colleagues performed a combined first-trimester screening test, comprising maternal age, fetal nuchal translucency thickness, fetal heart rate, serum free beta-human chorionic gonadotropin, pregnancy-associated plasma protein-A (PAPP-A), and the ductus venosus Doppler [29]. The a-wave was reversed in 66–75 % of aneuploid, but in only 3.2 % of euploid fetuses. Universal inclusion of the first-trimester ductus venosus Doppler would detect 96 %, 92 %, 100 % and 100 % of trisomies 21, 18 and 13 and Turner syndrome, respectively, at a false-positive rate of 3 %. Similar detection rates were achieved in a two-step strategy with a false-positive rate of 2.6 %, necessitating ductus venosus Doppler in only 15 % of the total population.
It should be appreciated that most fetuses with abnormal ductus venosus Doppler are euploid and not all fetus with aneuploidy will have abnormal findings. As shown in Table 12.1, which summarizes several studies on first-trimester ductus venosus Doppler, abnormal Doppler findings were present in 70 % of aneuploid fetuses, but only in 4 % of the euploid fetuses (see Table 12.1).
Obviously, prenatal noninvasive risk assessment for chromosomal abnormalities during early gestation involves multiple modalities, such as the sonographic assessment of nuchal translucency and measurement of multiple analytes. The efficacy of incorporating the ductus venosus Doppler in these algorithms is further discussed later.
Ductus Venosus Doppler Screening for Congenital Heart Disease
Ductus venosus Doppler waveforms reflect fetal central hemodynamics, especially that of the right heart. Functional and anatomical abnormalities are expected to alter this waveform. This prompted many to explore its screening potential for the early detection of fetal cardiac disease.
Matias and coworkers performed Doppler velocimetry of the ductus venosus in 200 singleton fetuses with increased nuchal translucency, at 10–14 weeks’ gestation, immediately before fetal karyotyping [22]. The results suggested that in euploid fetuses with increased nuchal translucency, the presence of abnormal ductus venosus blood flow recognized those with major cardiac defects.
In a study involving over 41,000 euploid fetuses, reversal of ductus venosus a-wave was observed in about 28 % of the fetuses with cardiac anomalies and in about 2 % of the fetuses with no cardiac anomalies [31]. The authors estimated that comprehensive fetal echocardiography would detect approximately 39 % of major cardiac defects, at an overall false-positive rate of about 3 %, in cases with nuchal translucency above the 99th centile and those with reversed a-wave, independent of the nuchal translucency measurement.
This has been further confirmed, more recently, by Borrell and associates who studied the efficacy of various first-trimester ultrasound screening strategies for the recognition of major cardiac malformations, in euploid fetuses [32]. The sonographic methods included fetal nuchal translucency and Doppler indices of the ductus venosus. If the ultrasound findings were abnormal, early echocardiography was recommended. Verification of the fetal cardiac status was performed by fetal echocardiography in mid- and late gestation, neonatal assessment or autopsy. Of the 37 euploid fetuses with a major cardiac malformation, the nuchal translucency was above the 99th centile in 27 % cases and the ductus venosus a-wave was absent or reversed in 39 % of the fetuses. The authors noted a 47 % detection rate of major heart defects, with a false positive rate of about 3 %.
These and other investigations suggest a role for ductus venosus Doppler to identify early those fetuses at a higher risk of CHD. Early fetal echocardiography can be challenging and may not obviate the need for comprehensive ultrasound examination at mid-pregnancy. However, Zidere and associates recently demonstrated that, in expert hands, it could achieve a high degree of accuracy [33]. Future research should further address the effectiveness of early fetal echocardiography in clinical practice.
Doppler Investigation of Tricuspid Flow in the First Trimester
Over the recent years, there has been a progressively wider use of Doppler echocardiography for assessing fetal cardiac function in early pregnancy. Of the various aspects of fetal cardiac function, the tricuspid flow patterns have received the most attention, especially regarding its association with congenital cardiac malformations and aneuploidy.
Doppler Insonation Technique
The Doppler echocardiographic modalities used for assessing tricuspid flow include two-dimensional image of the fetal heart, which directs spectral Doppler interrogation. It is beyond the scope of this review to discuss the technique in detail. The principles are essentially the same as in later gestation [5]; however, Huggon and associates have addressed the specific technical issues related to first-trimester application [34]. Briefly, an apical or a basal four chamber view is preferred, as it allows aligning the Doppler beam with the atrioventricular flow direction, with a minimal angle of insonation, which should be kept below 30°. As described earlier with the ductus venosus Doppler, the high pass filter should be set to the lowest level allowed by the device, and the power output should be kept as low as possible. Color Doppler flow will show reversed flow related to the regurgitation and color M-mode has the advantage of providing more accurate temporal resolution. However, color modes are seldom used for the first-trimester screening, because of their inconsistency in depicting intracardiac flow in early gestation. In common practice, spectral Doppler interrogation is guided by two-dimensional B mode imaging, which assists in placing the Doppler sample volume across the tricuspid valves.
Tricuspid Flow Pattern
Spectral Doppler insonation of the atrioventricular flow reveals a biphasic flow pattern, reflecting the contributions of ventricular relaxation and atrial contractions to the Doppler flow velocity waveforms (Fig. 12.8). The first peak, called the E wave, represents the peak flow velocity due to the atrial systole. The second peak, A wave, is the peak flow velocity caused by the ventricular diastole. In the right heart, the A wave is substantially greater than the E wave, whereas in the left heart the waves are less discrepant. This observation suggests a physiologically lower compliance of the right ventricle compared to the left. Neonates and infants demonstrate a similar pattern.


Fig. 12.8


Doppler imaging of the tricuspid flow in the first trimester of pregnancy is depicted here. The upper panel shows two-dimensional echocardiography of an apical four-chamber view of the fetal heart at 13 weeks’ gestation. The horizontal arrow indicates the Doppler sampling location. Note the optimal alignment of the ultrasound beam path with the flow direction (vertical white line). The Doppler spectral display of the biphasic blood flow velocities across the tricuspid orifice is shown in the lower panel. E, peak flow velocity during ventricular diastole; A, peak flow velocity during the atrial systole; RA, right atrium; RV, right ventricle; LA, left atrium; LV, left ventricle; SP, spine
Stay updated, free articles. Join our Telegram channel

Full access? Get Clinical Tree


